

Dashboard Setup and Layout
Dashboard Management
Card grid displaying ad creative assets (images/videos) with performance metrics.
1. Create a dashboard
- Open the dashboard page. The welcome screen shows two options: Start with a blank grid or Use cross-channel template.
- Click Start with a blank grid to begin from scratch, then select a data table from the dropdown in the banner.
- Click Use cross-channel template to start with a pre-built layout: 4 KPI widgets, a line chart (Performance Trends), a pie chart (Spend Distribution by Platform), and a bar chart (Total Conversions).
2. Edit the dashboard title
- Click the dashboard title heading to make it editable.
- Type a new title and press Enter or click outside to confirm.
Note: Special characters like < > & / render correctly as text. Clearing the title shows a placeholder rather than breaking the layout.
3. Customize dashboard appearance
- Click the ⋮ (three-dot) menu in the top-right header and select Customize.
- In Colors, switch between Light, Dark, and System themes, or enter a custom hex value for the page background.
- In Layout, choose Compact (centered, max-width) or Full Width (edge-to-edge) for the page layout.
- In Whitelabel, enter a Logo URL and choose a size to show custom branding in the header. Add a Watermark URL for a semi-transparent overlay.
4. Dashboard actions menu
- Save the dashboard to switch to view mode.
- Click the ⋮ menu in the top-right header to access: Customize, Duplicate, Delete, and more.
Duplicate a Dashboard
- Open the ⋮ menu and select Duplicate.
- Choose Current workspace, or select another workspace where you are a member.
- For a multi-page dashboard, keep Include all pages selected to copy every page. Clear it to create a standalone copy of the page you are viewing.
- Confirm the action. Improvado opens the new copy in the selected workspace.
Note: The duplicate keeps the source dashboard's data table configuration. If the target workspace should use a different table, update the default table after the copy opens.
Find a Dashboard or Widget Setting
Use the search field at the top of Customize or a widget's Properties panel. Matching sections open automatically and matching text is highlighted. Search by a visible label, option, section name, or related term such as font, cache, axis, or dimension. Clear the field or press Esc to restore the full list of settings.
5. Save your dashboard
- In edit mode, click Save in the top-left banner.
- The dashboard switches to view mode — Save and Cancel are replaced by Edit and Chat. Chat opens the AI Agent panel next to the dashboard.
Result: All widgets, filters, and title changes persist across page reloads.
6. Cancel unsaved changes
- In edit mode, click Cancel in the top-left banner.
- The dashboard reverts to its last saved state — added widgets, metric changes, and title edits are all discarded.
Note: If a confirmation dialog appears, click Discard to proceed.
7. Delete a dashboard
- Click the ⋮ menu in the top-right header and select Delete.
- Confirm in the dialog. The welcome screen reappears, ready for a new dashboard.
Layout and Positioning
Layout Modes:
- Grid View — Cards in responsive grid (2-6 columns)
- List View — Single-column with larger previews
Card Content Modes:
- Full — Image + title + metrics + performance badges
- Minimal — Image + title (metrics on hover)
- Media Only — Thumbnails only (metrics on hover)
8. Add multiple widgets to the grid
- Click any widget button in the bottom toolbar (KPI Scorecard, Table, Chart, Pie, Text) to add it.
- Configure the widget in the Properties Panel, or close it to configure later.
- Repeat as needed — the grid expands and scrolls vertically as widgets are added.
Note: Unconfigured widgets show a “Select Metric” prompt. Scroll down to see widgets below the fold.
9. Reorder widgets by dragging
- In edit mode, click and hold the title or header area of a widget.
- Drag it to a new position in the grid and release. The grid snaps to available positions.
10. Resize widgets
- Select a widget to open the Properties Panel and expand the Layout section.
- Column span — sets horizontal width from 1 to 12 columns on the 12-column grid.
- Height — choose Small, Medium, or Large (or a custom value).
You can also drag the right edge of a widget directly to resize it horizontally.
11. Widget card appearance
- Expand the Layout section in the Properties Panel.
- Adjust visual options with the dropdowns: Card style (Default / Tinted), Border (Off / On / Thick), Background (Solid / Tinted / Off), and Shadow (Off / On / Large).
12. Enable a sidebar panel
- Open Appearance from the ⋮ menu and expand the Layout section.
- Change Filter Position to Sidebar. A sidebar panel appears on the left side.
- Use the + button inside the sidebar to add widgets that stay visible while scrolling the main grid.
Widget Management
13. Add widget types from the toolbar
- In edit mode the bottom toolbar shows: KPI Scorecard, Table, Chart, Pie, and Text.
- Click More (⋯) to access additional types: Funnel, Heatmap, Creatives Gallery, and Custom Component.
14. Open and use the Properties Panel
- Click any widget in edit mode to open its Properties Panel on the right.
- Click a different widget to switch the panel to that widget — previous configurations are preserved.
- Click section headers (Basics, Data, Layout, Filters, etc.) to expand or collapse each group of settings.
- Click X in the panel header to close it.
15. Edit a widget title
- Open the Basics section in the Properties Panel.
- Clear the Widget Title field and type a new name. The widget heading updates immediately.
16. Duplicate a widget
- Open the widget’s Properties Panel and click Duplicate at the bottom.
Result: A copy with the same configuration appears on the grid. The Properties Panel switches to the new copy.
17. Remove a widget
- Open the widget’s Properties Panel and click Delete at the bottom.
18. Export table data
- Hover over a table widget and click the ⋮ icon in its header. In edit mode, the same menu is also at the bottom of the table’s Properties Panel.
- Choose Export as CSV, Export as Excel (.xlsx), or Copy to Clipboard.
Note: This menu is available on table widgets once they have loaded data. To export every widget at once — charts, KPI cards and other widget types included — use Export in the dashboard header and choose CSV or Excel. See Export data to CSV or Excel.
Cross-Widget Filtering: Click any cell to filter other widgets by that cell's dimension values. Filter chips appear in the Active Interaction Bar.
Cached Data and Refresh (Beta)
Cached widget results are in beta. The feature is on by default; if a dashboard must recompute on every open, turn it off per dashboard as described in step 21.
Widget queries that take more than a few seconds are saved after they run. The next time anyone opens the dashboard, those widgets are drawn from the saved result right away and refreshed in the background as they age. This caches query results, not your data — data is still pulled from the platforms on its usual schedule; the cache only skips re-running the same heavy query over data that is already in Improvado.
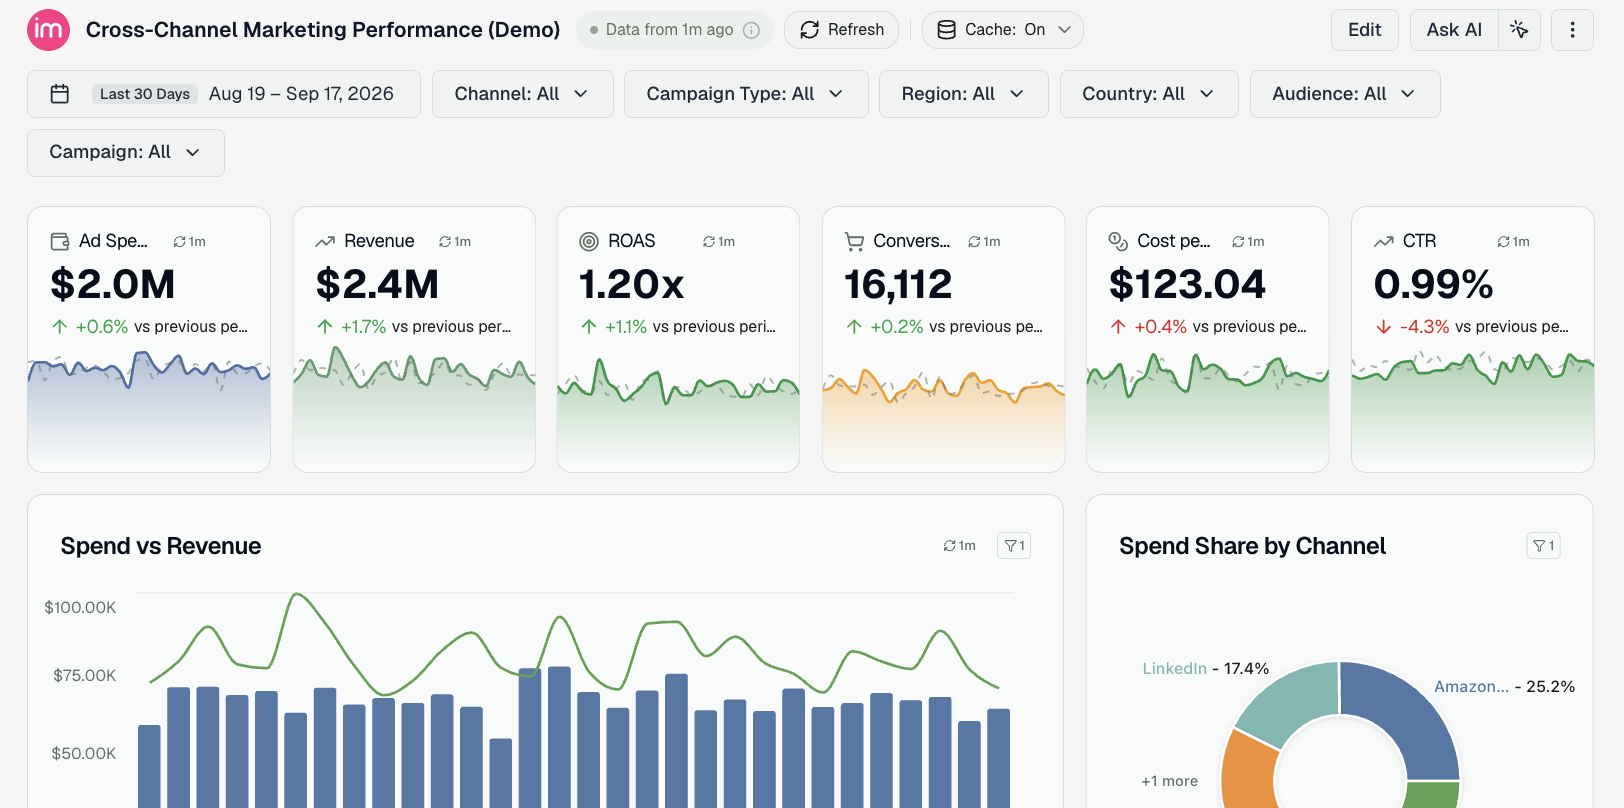
19. See how fresh the numbers are
- Look next to the dashboard title: Data from 20m ago shows the age of the oldest cached widget on the page.
- Hover the label to see when the numbers were last computed and how long the query takes without the cache. Each cached widget also carries a small chip with its own age.
Note: The label and chips only appear when at least one widget was served from the cache. Fast widgets always run live and show nothing.
20. Refresh on demand
- Click Refresh next to the title to re-run every widget query from scratch, skipping the cache. Widgets keep showing their current data with a spinner until the new numbers arrive.
- Click the age chip on a single widget to reload just that widget.
- Open any filter's dropdown and click ↻ to reload that filter's list of values — for example after a new campaign or tag appears.
21. Turn the cache off for a dashboard
- Click Disable cache next to the title, or open Customize from the ⋮ menu, expand Data, and switch off Cache widget results.
- Save the dashboard. Every widget now recomputes on each open, exactly as before.
Note: Only dashboard editors can disable the cache. Viewers can still use Refresh.
Was this article helpful?
Thanks for the feedback!
Questions? The Improvado team is always happy to help. Send us an email, contact your Customer Success Manager, or raise a request in the Improvado Service Desk.