AI Dashboards
Overview
AI Dashboards let you build flexible, interactive analytics views directly inside Improvado — from quick AI-generated layouts to fully custom dashboards built from scratch. Visualize your data, apply global filters, compare performance over time, and share dashboards with anyone, even outside Improvado.
Creating a New Dashboard
There are three ways to create a dashboard:
Describe to AI Agent — Open the AI Agent and describe what you need in plain language. The Agent builds the layout, selects widgets, and connects your data automatically.
Use cross-channel template — Start with a pre-built dashboard and customize it to fit your needs.
Start with a blank grid — Full control over widgets, data sources, and layout from scratch.
All three options use the same underlying system and can be customized at any time.
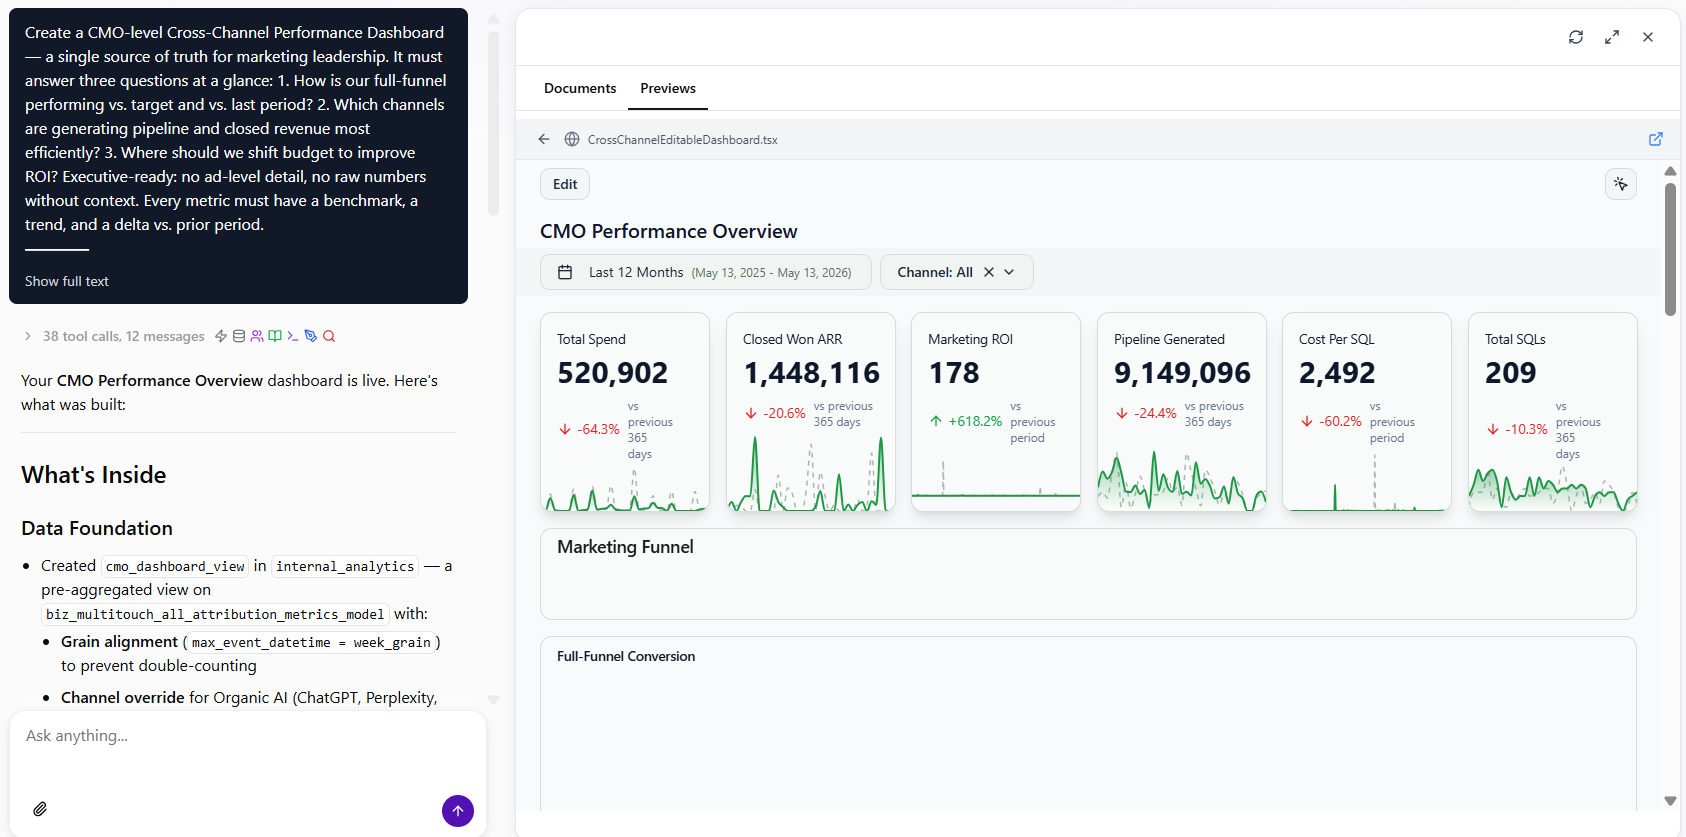
Create a Dashboard with AI Agent
Open the AI Agent from the sidebar.
Describe the dashboard you need in plain language — for example, "Build me a CMO dashboard with spend, ROAS, and CPA by channel for the last 90 days."
The Agent builds the layout, selects the right widgets, and connects your data automatically. Review the result and request adjustments directly in the chat.
You can also use a prepared prompt for common dashboard types. For ready-to-use prompts, see the Create Dashboards with Detailed Prompts guide.
Ask AI About a Specific Widget
Use the Pin button (cursor icon) in the dashboard header to ask the AI Agent about a specific widget. Click the button, then click the widget you want to pin — a small composer appears anchored to it.
Where the prompt goes depends on context:
- Inside the AI Agent chat — the message is appended to the active composer, so the conversation continues with the widget's context (id, type, config, dashboard title) attached.
- Outside the chat (direct dashboard URL, repo viewer, shared link, public link) — a new chat opens in the AI Agent with the prefilled prompt.
Pin works on every widget type, including custom components. Press Esc at any time to cancel pin mode.
Create a Dashboard Manually
To create a dashboard:
- Click Dashboards
- Click + New Dashboard
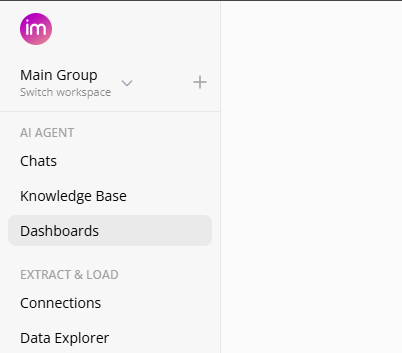
- Choose how you want to start:
- Start with a blank grid
- Use cross-channel template
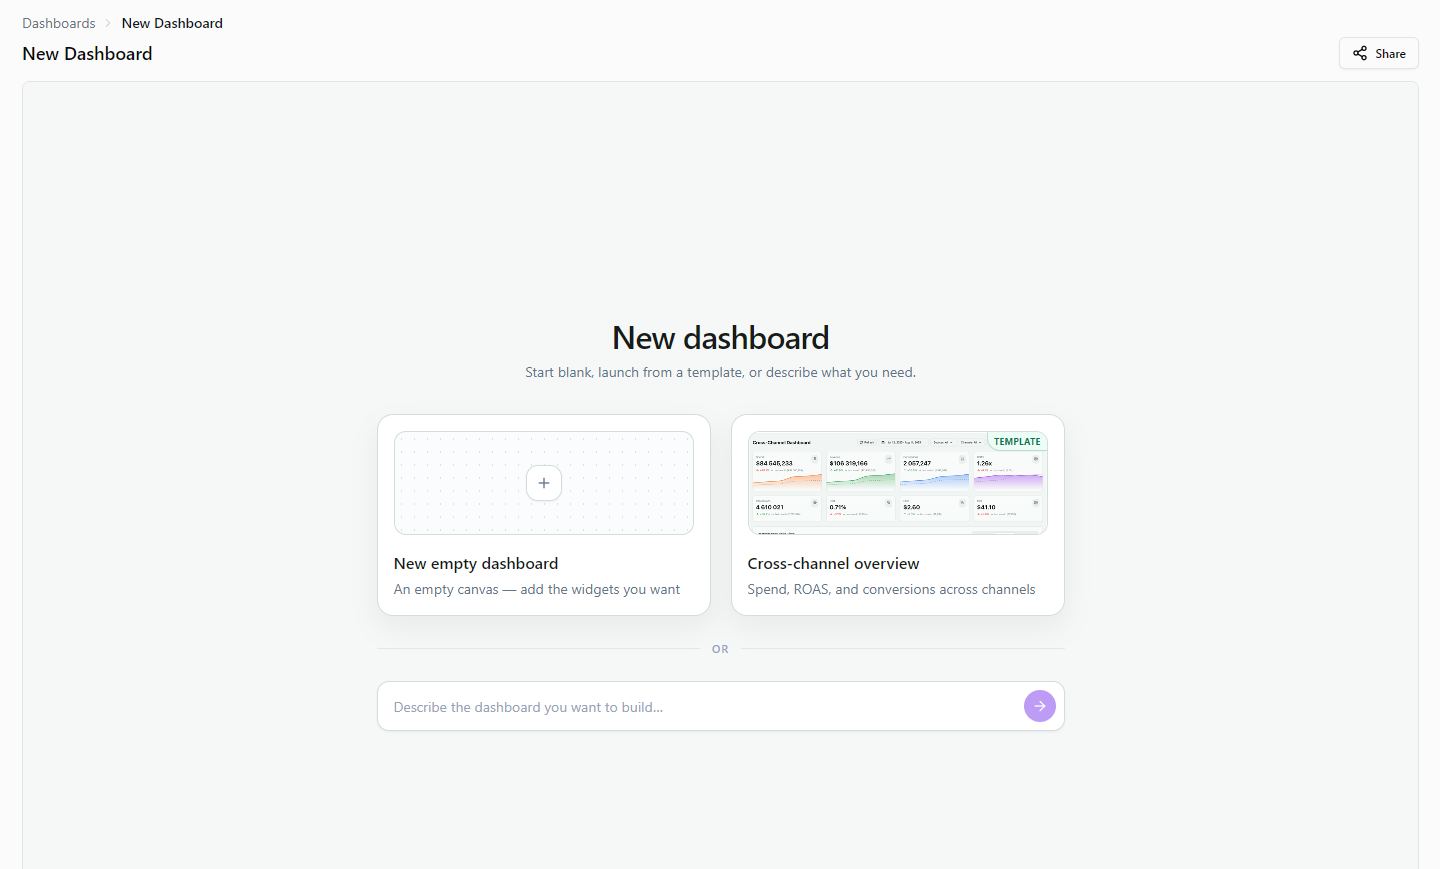
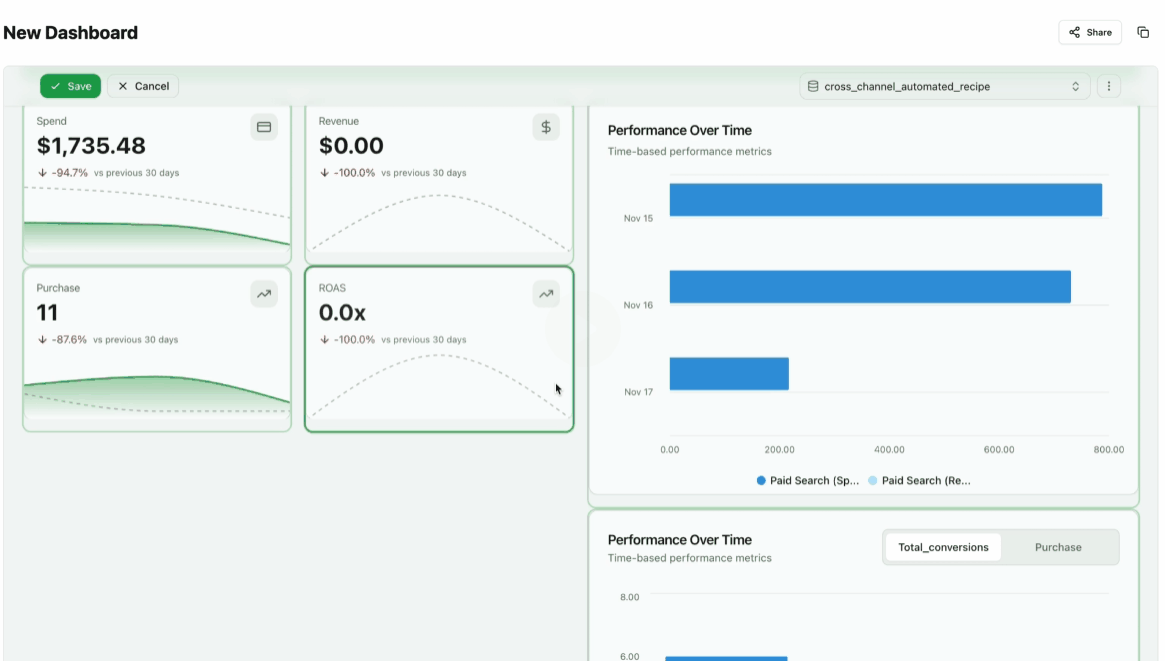
Blank Grid
Use a blank grid when you want full control from the start. This option creates an empty dashboard where you can add and configure widgets manually.
.png)
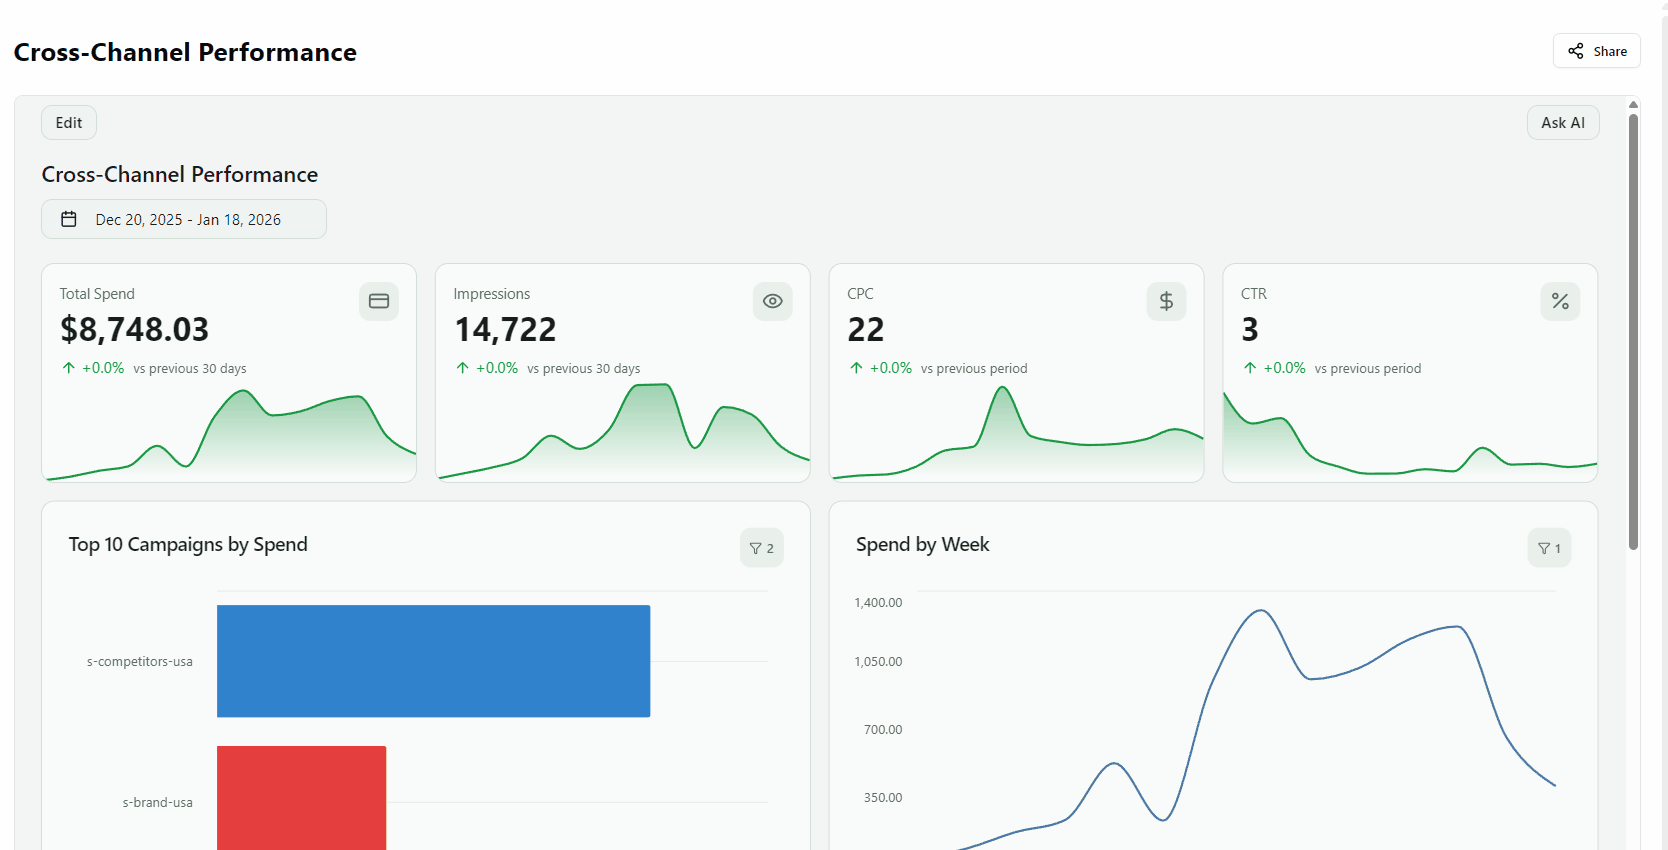
Cross-Channel Template
Templates provide a ready-to-use structure with common KPIs and charts already configured. They are ideal for quick analysis and follow Improvado best practices.
.webp)
Dashboard Components
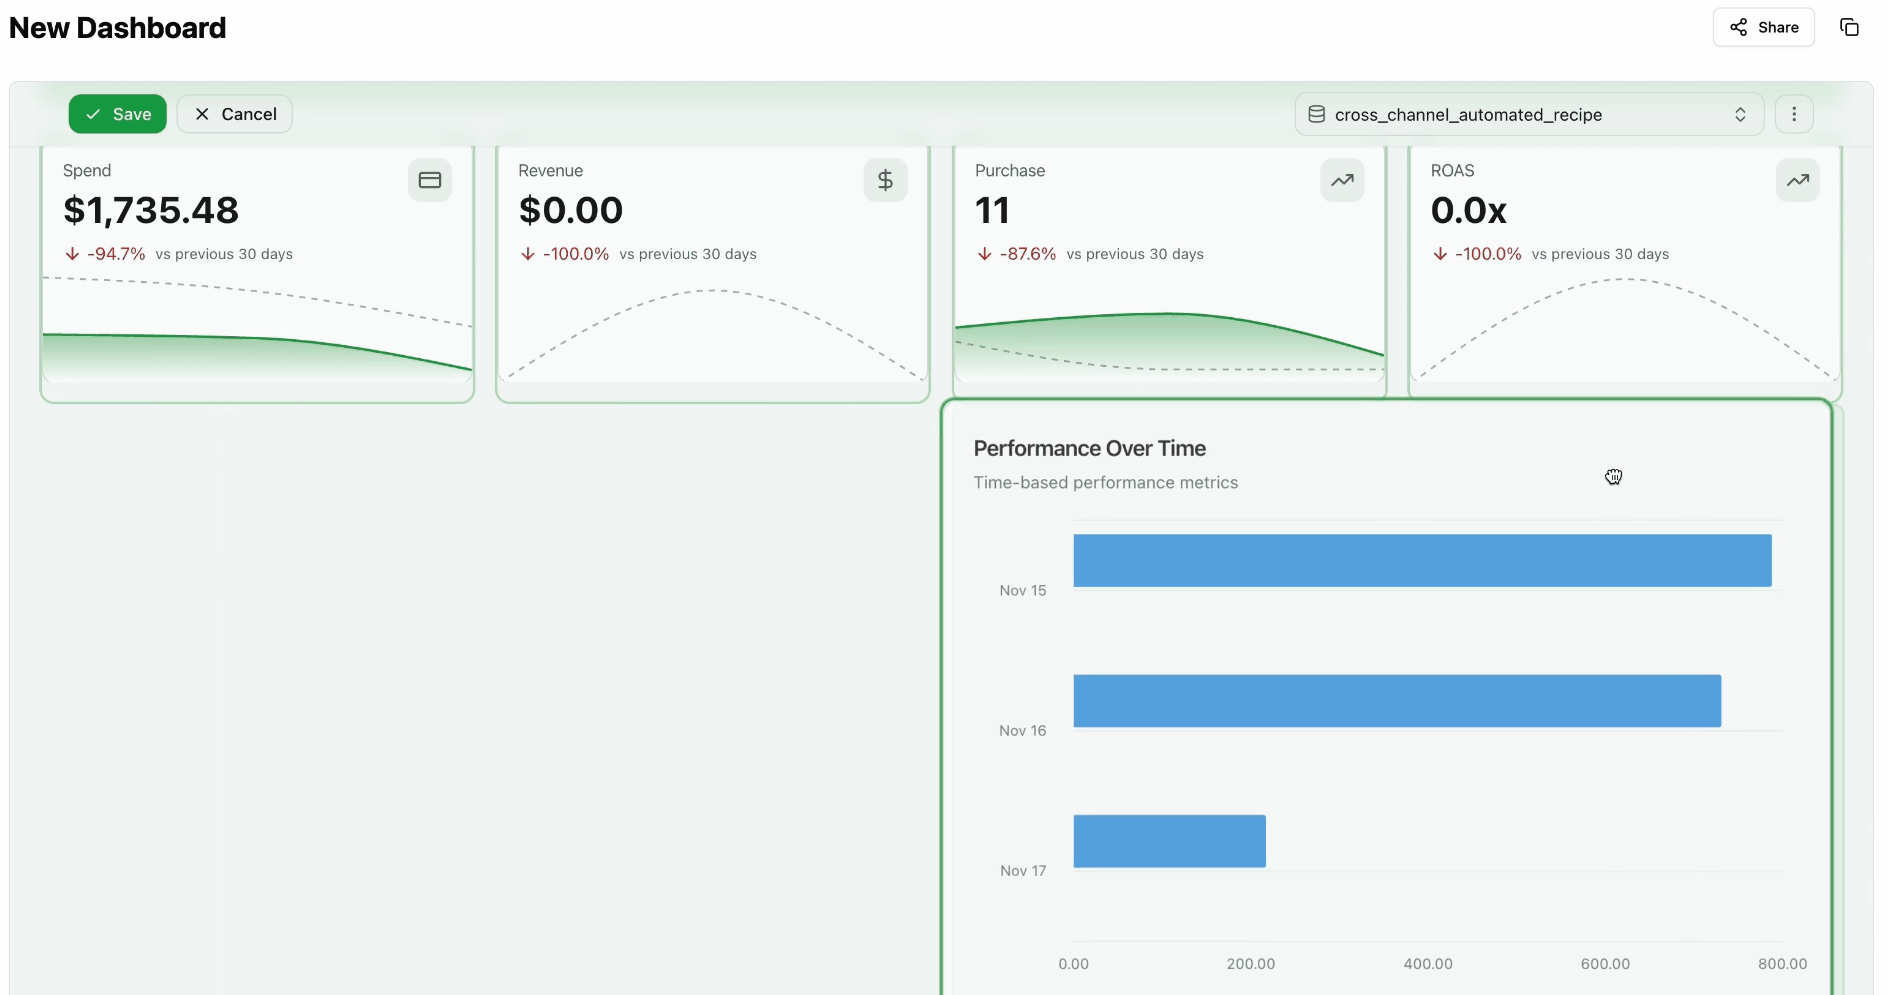
Once a dashboard is created, you enter Edit Mode, where you can configure data, widgets, and layout.
Key elements of the dashboard:
- Date range selector
- Global filters
- Default data table
- Widget toolbar
- Drag-and-drop canvas
Default (Dashboard-Level) Data Table
Each dashboard can use a default data table, which acts as the default data source for all widgets.
.png)
- The default table is selected at the top of the dashboard
- All widgets use it by default
- Individual widgets can override it with their own table if needed
This allows you to:
- Keep dashboards consistent
- Reduce repetitive configuration
- Still support advanced, widget-specific use cases
Adding Widgets
You can add the following widget types:
- KPI Scorecard
- Table
- Chart (Bar, Line, Area, Composed)
- Pie
- Funnel
- Text
- Heatmap
- Creatives Gallery
- Custom Component
Widgets can be added from the toolbar and placed anywhere on the canvas. For a complete reference on each widget type and its configuration options, see Widget Types Reference.
Widget Configuration
Each widget has a Properties panel that controls its behavior and appearance.
.png)
This structure is consistent across all widget types.
Basics
- Title
- Description
- Basic display settings
Layout
- Widget size
- Position on the grid
- Visual styling
Filters
- Widget-level filters.
- Filters can be shared across different widgets.
- Note: Widget-level filters have higher priority than dashboard-level ones. You can combine both, but the widget-level filters will take precedence when applied together.
- Filters can be shared across different widgets.
- Comparison with previous periods
- Row/Series Limits
- Sorting
- Independent filtering from the dashboard if needed
Data
- Data table selection (shared or custom)
- Metrics selection
- You can also create custom metrics with custom SQL query.
- Custom metrics can be shared across different widgets.
- Dimensions
- Date range dimension
Query (Custom SQL)
For advanced use cases, any widget supports a Custom SQL Editor that lets you override the auto-generated query with your own ClickHouse SQL. Use dynamic placeholders to make queries respond to active filters and date ranges.
This enables:
- Cross-table joins across multiple data sources
- Window functions for running totals, rankings, and period-over-period calculations
- Complex aggregations not available through standard widget configuration
The built-in Query Viewer lets you inspect the exact SQL being executed at any time — full transparency into what's powering your data.
See Custom SQL Editor for details.
Custom Widgets
For teams with specific visualization needs, dashboards now support fully custom HTML widgets. Drop in any visualization built with D3, Chart.js, or any other library and wire it directly to your connected data and active dashboard filters.
Custom widgets behave like native widgets — they respond to global filters, respect the dashboard date range, and can be placed anywhere on the canvas.
Drag & Drop Layout
Dashboards are fully flexible:
- Drag widgets to reorder them
- Resize widgets freely
- Adjust layout without breaking data configuration
The experience is intentionally lightweight and feels intuitive, similar to traditional BI tools like Looker Studio or Tableau.
Multi-Page Dashboards
Dashboards can now be organized across multiple pages within a single view. Each page has its own widget layout while sharing a common header, filters, and appearance settings.
- Pages — Add, rename, reorder, and delete pages
- Display modes — Tabs (horizontal), Sidebar (vertical), or Hidden
- Shared header — Persistent header with logo and branding across all pages
- Inheritance — Child pages inherit parent filters, date range, and appearance
Multi-page dashboards are ideal for executive vs. detailed views, multi-channel reports, campaign drill-downs, and regional breakdowns. See Multi-Page Dashboards for the full guide.
Global Dashboard Filters
Dashboards support global filters that apply to all widgets.
You can:
- Add default filters
- Configure custom filters
- Control which filters are active
The Filters panel shows:
- Active Filters — currently applied
- Available Filters — all filterable fields
Filters support autocomplete search, an "Only" button for quick single-value selection, and smart filter skip that automatically ignores filters for widgets whose data table doesn't have the filtered column. See Filters & Date Range for details.
Widget Interactions
Widgets can interact with each other — clicking an element in one widget (e.g., a heatmap cell, chart bar, or table row) automatically filters data in other widgets on the same dashboard. This enables drill-down analysis without manually setting filters. See Widget Interactions & Data Export for details.
Appearance & Branding
Customize the look and feel of your dashboard with light/dark/system color modes, whitelabel logos, global color palettes for charts and tables, and per-widget styling. Especially useful for shared and public dashboards. See Appearance & Branding for the full guide.
Saving the Dashboard
To finalize your dashboard, click Save.
After saving:
- The dashboard exits edit mode
- The final layout is displayed in view mode
- A confirmation message appears
Sharing Dashboards
Sharing modes
Dashboards support three sharing modes accessible via the Share button in the top-right corner:
Workspace Access (default)
By default, dashboards are accessible to all users in your Workspace.
Restricted Access
You can restrict dashboard access to specific users:
- Add users manually to the dashboard
- Only added users can view it
- Invite external users by email with the Dashboard Guest Reviewer role
- Guest reviewers gain dashboard access without full Workspace permissions
Only dashboard owners (users who created a dashboard) can change sharing modes.
Public Link
Generate a public link that allows anyone to view the dashboard:
- No Improvado account required
- View-only access
- Ideal for executives, clients, or external stakeholders
Notes:
- Disabling a Public Link: If a public link is enabled, you can disable it at any time. Disabling the link will invalidate it immediately, preventing anyone from accessing the dashboard through that URL. This serves as a security feature, allowing you to revoke access when needed.
- Regenerating a Public Link: If you disable a public link and later enable it again, a new link will be generated. The previous link will not be restored and will remain invalid. This ensures that access is controlled and previous links cannot be reused.
User Roles and Permissions
When adding users to a dashboard, you can assign one of the following roles:
- View - Users can only view the dashboard
- Edit - Users can view and edit the dashboard
- Edit & Share - Users can view, edit, invite others, and manage sharing settings
| User Type | View | Edit | Invite Others | Change Roles | Enable/Disable Public link | Change Visibility (Workspace/Restricted mode) | Remove Owner |
|---|---|---|---|---|---|---|---|
| Owner | ✅ | ✅ | ✅ | ✅ | ✅ | ✅ | ❌ |
| Edit & Share | ✅ | ✅ | ✅ | ✅ | ✅ | ❌ | ❌ |
| Edit | ✅ | ✅ | ❌ | ❌ | ❌ | ❌ | ❌ |
| View | ✅ | ❌ | ❌ | ❌ | ❌ | ❌ | ❌ |
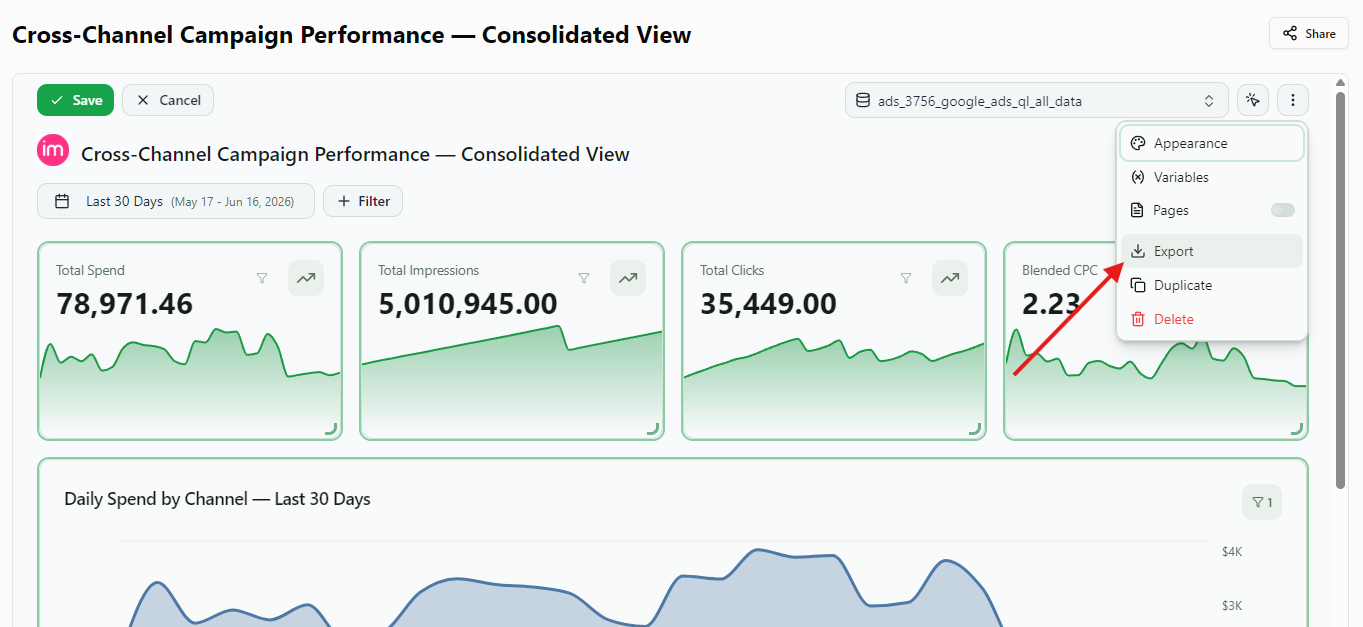
Export to PDF
You can export any dashboard as a branded PDF — ideal for client reports, QBRs, and offline sharing. The PDF captures the dashboard exactly as you see it: the active filters and date range are applied, and your white-label branding is preserved.
To export:
- Open the dashboard in view mode.
- Click Export in the dashboard header (download icon, top-right corner).
- In the export panel, keep File Format: PDF Document, then choose your Paper Size (A4 or Letter) and Orientation (Portrait or Landscape).
- Click Export — Improvado renders the dashboard server-side and downloads a clean, multi-page PDF.
KPI cards, charts, and tables are laid out to fit the page. For multi-page dashboards, the page you're currently viewing is exported.
Note: The export reflects the dashboard's current state — set the filters and date range you want before exporting.
Version History
Every change to a dashboard is saved automatically as a restore point — whether you made it in the editor or the AI Agent made it for you. If an edit doesn't look right, you can roll back to any previous version in a few clicks, without contacting support.
Open Version history from the dashboard header (next to Share) to see every change over time.
- Browse the timeline — each version shows when it was saved, who saved it, and whether it came from the Editor or the AI Agent. Versions made by the Agent link back to the chat that made the change.
- Preview any version — select an entry to see the dashboard exactly as it looked then, live and read-only, without affecting the current version.
- See what a restore changes — before you roll back, each version shows which widgets and settings would be added, removed, or changed.
- Restore in one click — restoring brings the dashboard back to that version. Your current state is saved first, so a restore can itself be undone.
Version history is available on editable dashboards and is on by default — there's nothing to set up. Restoring a version follows the same permissions as editing the dashboard.
Related articles
-
Appearance & Branding
Customize dashboard look and feel with light/dark mode, color palettes, whitelabel logos, and per-widget styling to match your organization's visual identity.
-
Create Dashboards with Detailed Prompts
Ready-to-use prompt examples that help the AI Agent generate accurate, actionable dashboards for executive reporting, daily campaign management, and creative performance analysis.
-
Custom SQL Editor
Override auto-generated queries with custom ClickHouse SQL for any widget — enabling cross-table joins, window functions, and complex calculations.
-
Filters & Date Range
Apply global filters across all widgets, configure autocomplete, multi-select with 'Only' button, smart filter skip, and use preset or custom date ranges.
-
Multi-Page Dashboards
Organize related visualizations across multiple pages within a single dashboard, with shared headers, inherited settings, and independent layouts.
-
Organizing Dashboards with Folders & Tags
Organize dashboards into a nested folder hierarchy: browse as a tree or list, create and move folders, file dashboards via drag-and-drop or the Move action, and share a link to a specific folder.
-
Widget Interactions & Data Export
Click elements in one widget to filter others. Export table data as CSV or copy to clipboard.
-
Widget Types Reference
Complete reference for all 9 widget types: KPI, Table, Chart, Pie, Funnel, Text, Heatmap, Creatives Gallery, and Custom Component.