Looker Studio is a powerful tool for data visualization and analysis, allowing brands to create insightful and shareable reports. With its intuitive interface, wide range of data connectors, and flexible customization options, it's a valuable platform for anyone looking to make data-driven decisions.
This guide will walk you through the steps of using Looker Studio, from setting up your first report to applying advanced data techniques like blending and filtering.
Getting Started with Looker Studio
Looker Studio is accessible to anyone with a Google account, making it a convenient choice for both small businesses and large organizations.
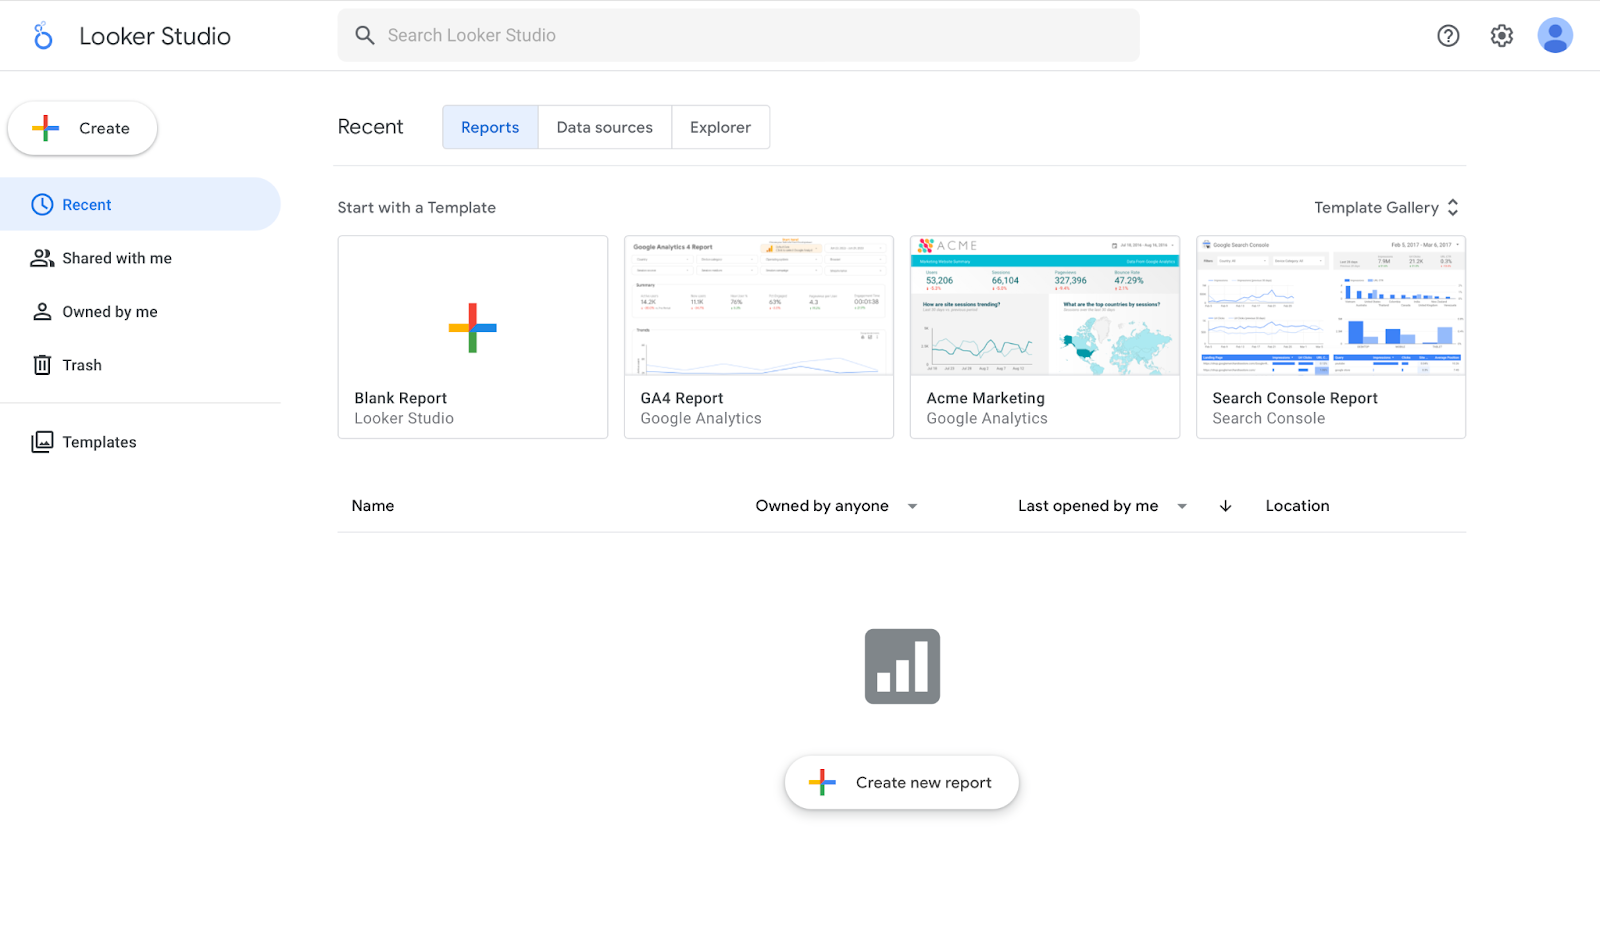
To begin using Looker Studio, sign in at datastudio.google.com with your Google credentials. The interface is user-friendly, offering an array of pre-built templates and data connectors to help you get started quickly.
Setting Up Your First Report
Creating your first report in Looker Studio involves connecting a data source and building visualizations.
Here’s how to get started:
- Create a New Report: From the home screen, click the "Create" button and select "Report." This will open a blank canvas where you can start building your dashboard.
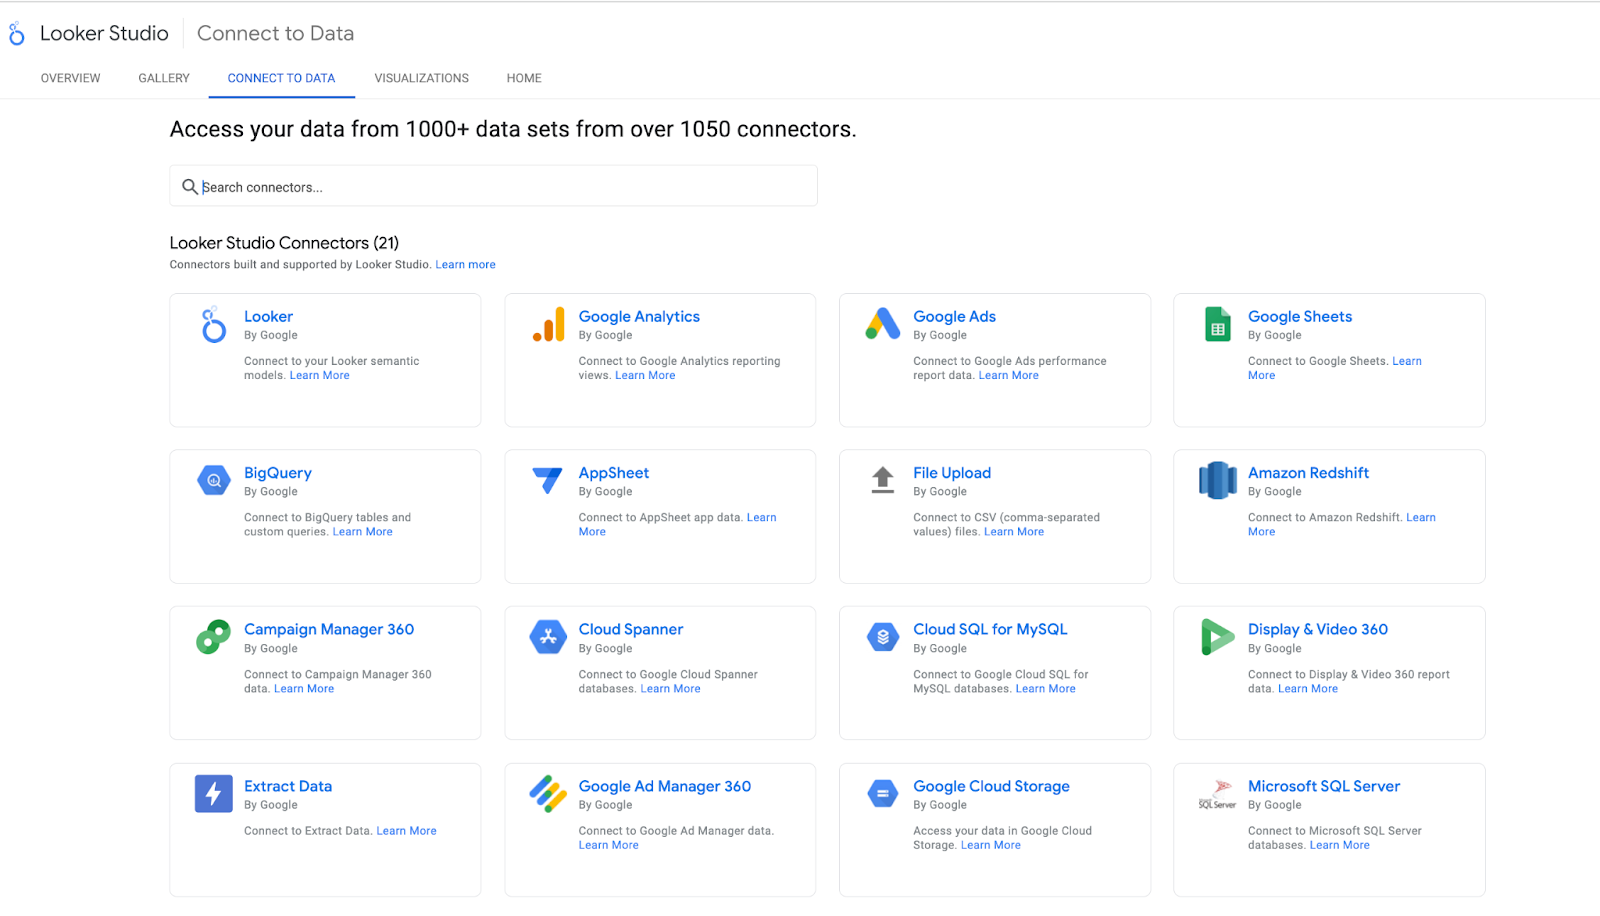
- Add a Data Source: Looker Studio supports over 1,050 data connectors, including Google Analytics, Google Sheets, BigQuery, and third-party services like Facebook Ads or HubSpot. For a simple setup, select Google Sheets as your data source by clicking "Add Data" and choosing the appropriate connector.
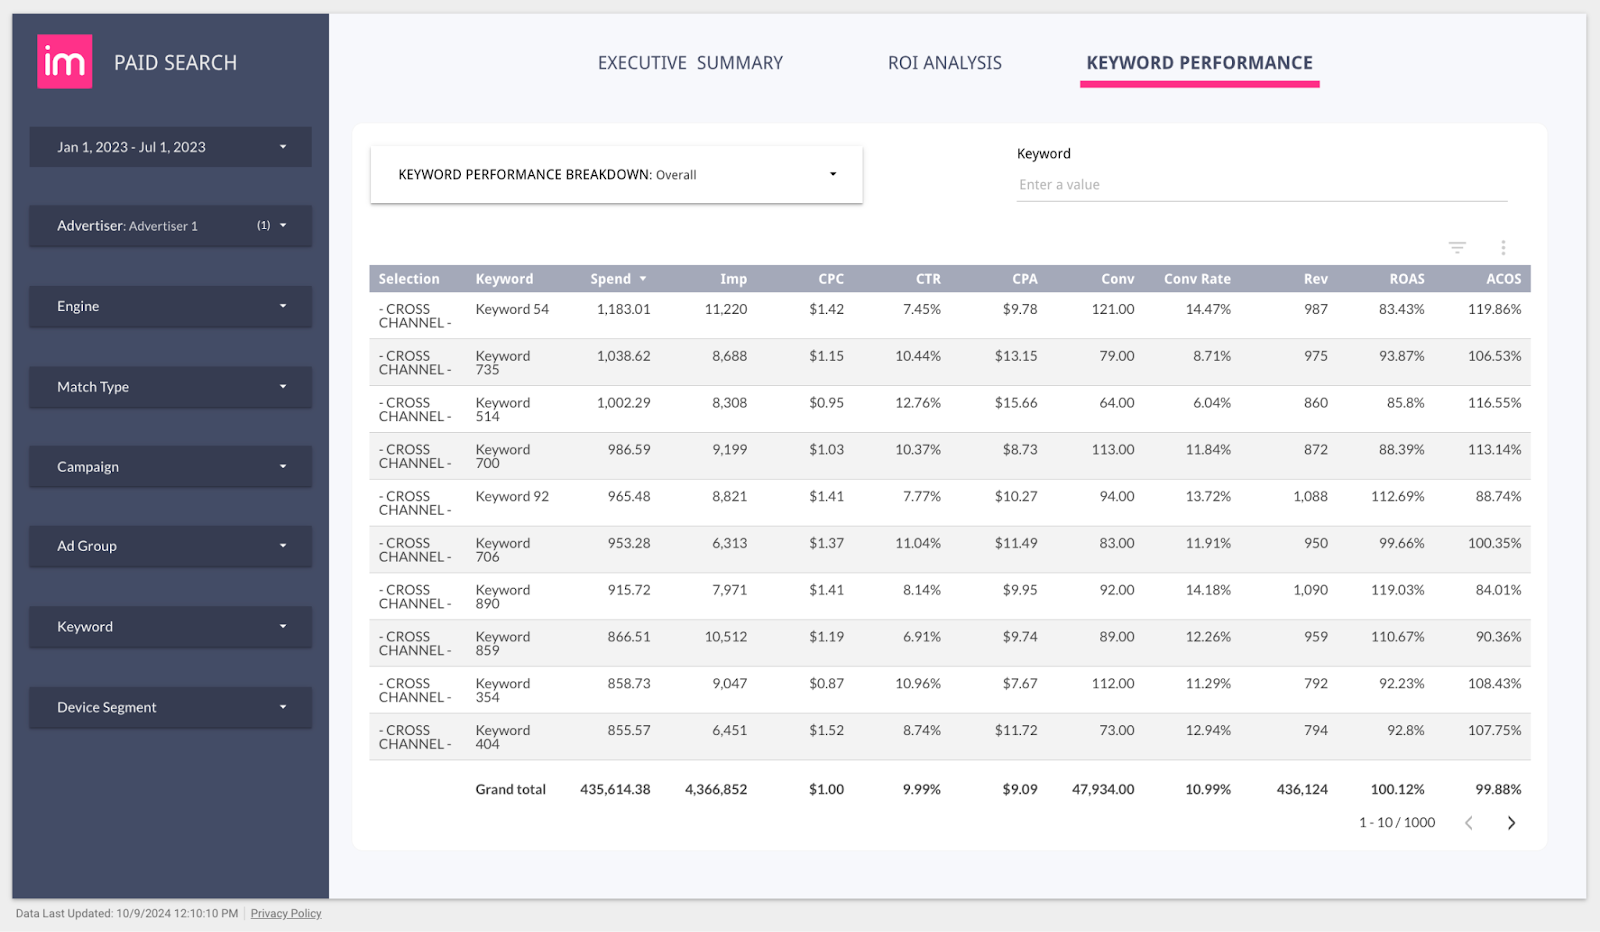
- Visualize Your Data: Once you've connected your data source, use the toolbar to add charts, tables, and graphs. Looker Studio offers various chart types such as scorecards, pie charts, bar charts, and line graphs. These visual elements allow you to display data in ways that provide clear insights.
Preparing and Visualizing Your Data
Before diving into visualization, it’s important to review your data to understand its structure. Clean data ensures that your reports are both accurate and meaningful.
- Choose the Right Visualization Types: Looker Studio offers various visualization options such as tables, charts, scorecards, and maps. Start by selecting the visualization type that best represents your data and supports your analysis goals. For example, use line charts for tracking trends over time or bar charts for comparing different categories.
- Customize Visual Elements: Use Looker Studio’s drag-and-drop interface to adjust fields, add filters, and refine visual components. Customize the appearance of your visuals by changing colors, labels, and data ranges to create clear, impactful visuals that match your reporting style.
- Organize Dashboards Efficiently: Structure your dashboard by grouping related metrics and visuals together for clarity. Utilize tabs to separate different sections or areas of analysis, making it easy to navigate and focus on specific data points.
- Experiment with Pre-Built Templates: For beginners, leveraging Looker Studio’s pre-built templates can be a great way to get started quickly. These templates offer a range of commonly used layouts and visualizations, which you can customize further to fit your data and objectives.
Data Blending and Filters in Looker Studio
As your reports become more advanced, you might want to combine multiple data sources or apply filters to focus on specific data points.
Blending Data from Multiple Sources
Looker Studio allows you to blend data from different sources, creating a unified view of your metrics. For instance, you can merge data from Google Analytics and Google Ads to see how paid traffic affects website behavior.
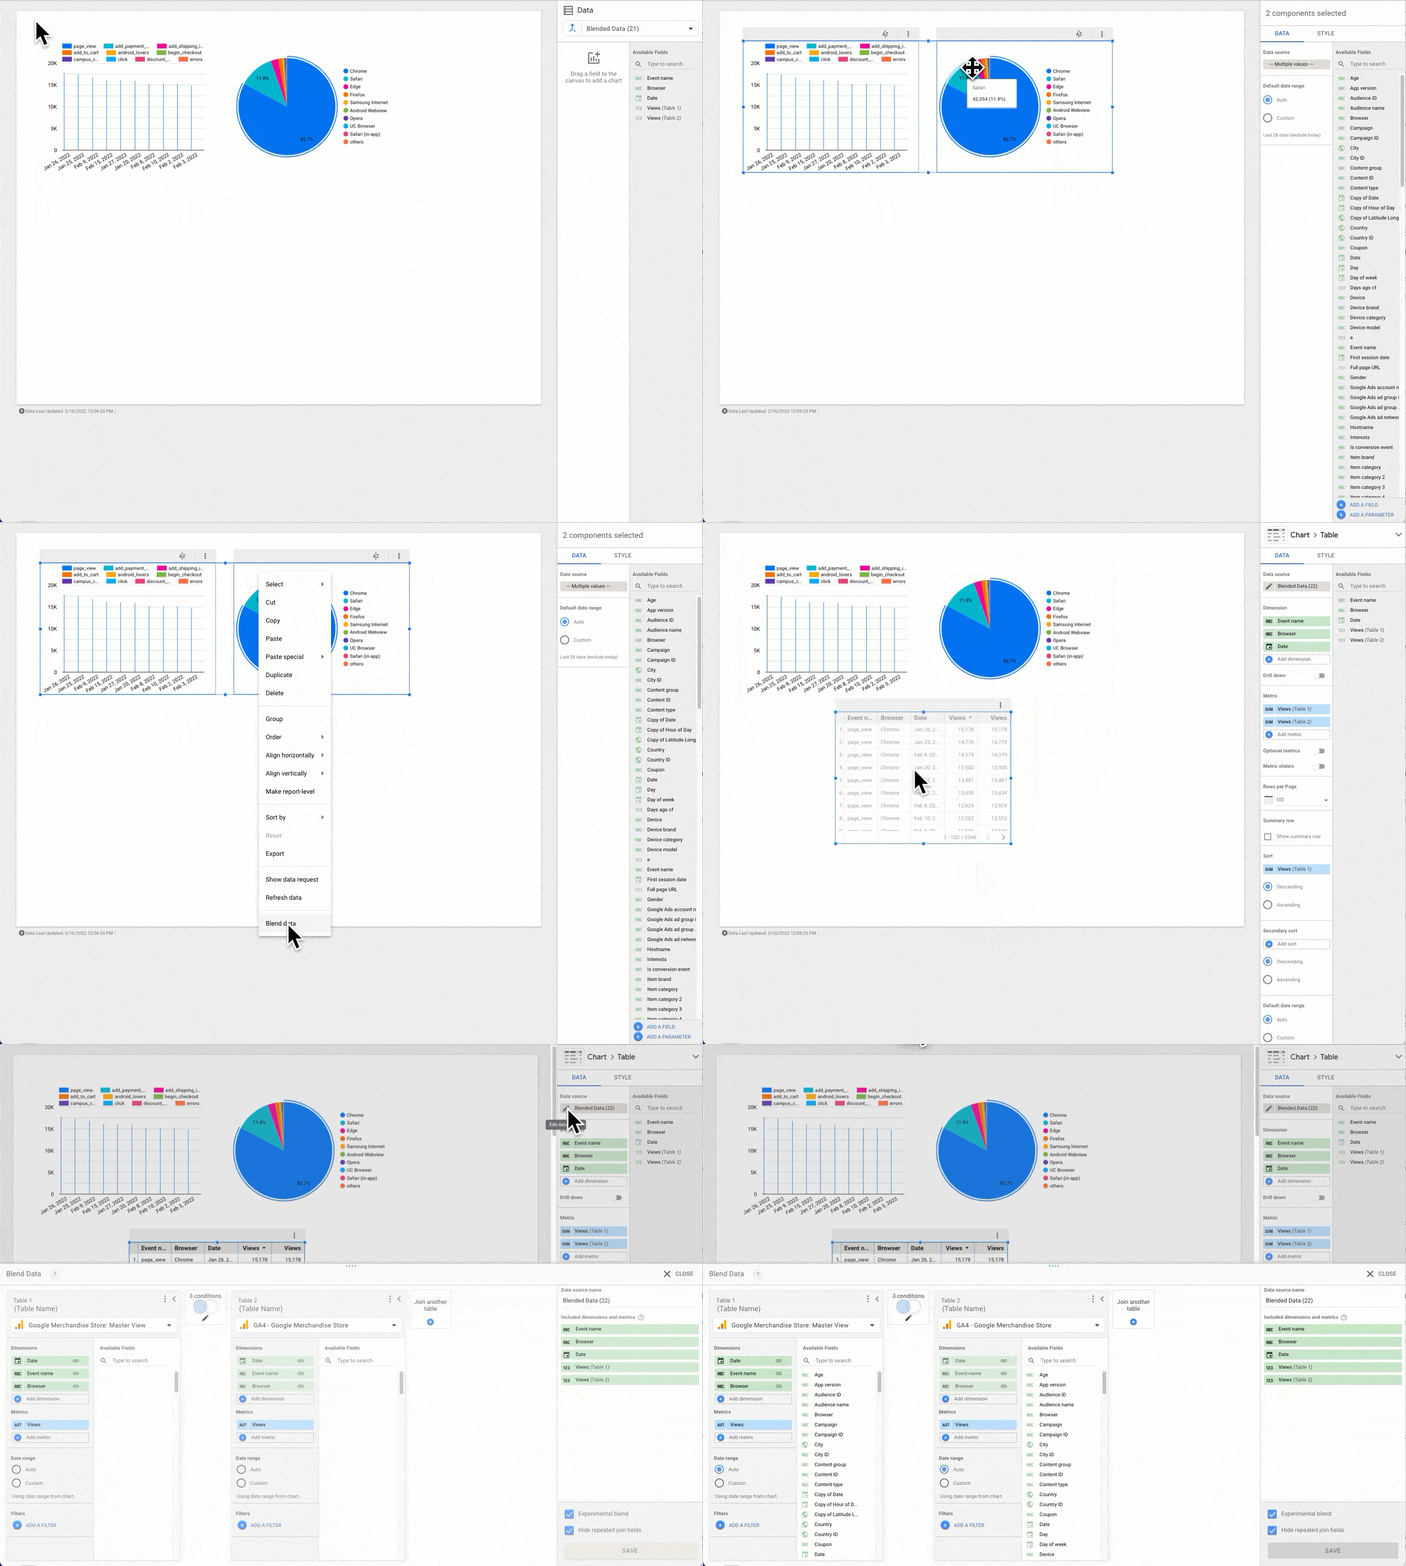
- Adjust and Refine the Blended Data: After blending, refine your data by adding calculated fields, filters, or custom metrics to make the dataset more relevant. You can create new calculated metrics that combine values from both sources, such as calculating the conversion rate using lead data from your CRM and traffic data from Google Analytics.
- Visualize Blended Data Effectively: Once your data is blended, use visualizations to bring the combined dataset to life. Blended data can be visualized through line charts, bar graphs, and scorecards to compare metrics like ROAS, CPA, or user engagement across platforms. The more aligned and relevant your datasets, the more insightful your visualizations will be.
- Monitor Data Updates and Consistency: Since blended data relies on multiple sources, ensure that each source updates consistently to avoid discrepancies in your reports.
Using Filters for Targeted Insights
Filters in Looker Studio help narrow down your data to specific segments, which is particularly useful when dealing with large data sets.
- Set Up Simple Filters for Quick Analysis: To get started, use basic filters to narrow down data based on dimensions like date range, location, campaign type, or specific audience segments. For example, you can set a filter to view performance metrics only for a specific region or for a particular ad campaign.
- Apply Advanced Filters for Deeper Insights: Looker Studio also supports advanced filtering options that allow you to combine multiple conditions. By using AND/OR logic, you can create complex filters that isolate highly specific datasets. For instance, you could filter data to show users who visited your site from mobile devices and converted within the last 30 days.
- Use Filter Controls for Interactivity: To make your reports more dynamic, add filter controls such as date pickers, drop-down menus, or sliders. This enables viewers to interact with the report and adjust filters based on their needs, such as viewing performance for different time periods or campaign types.
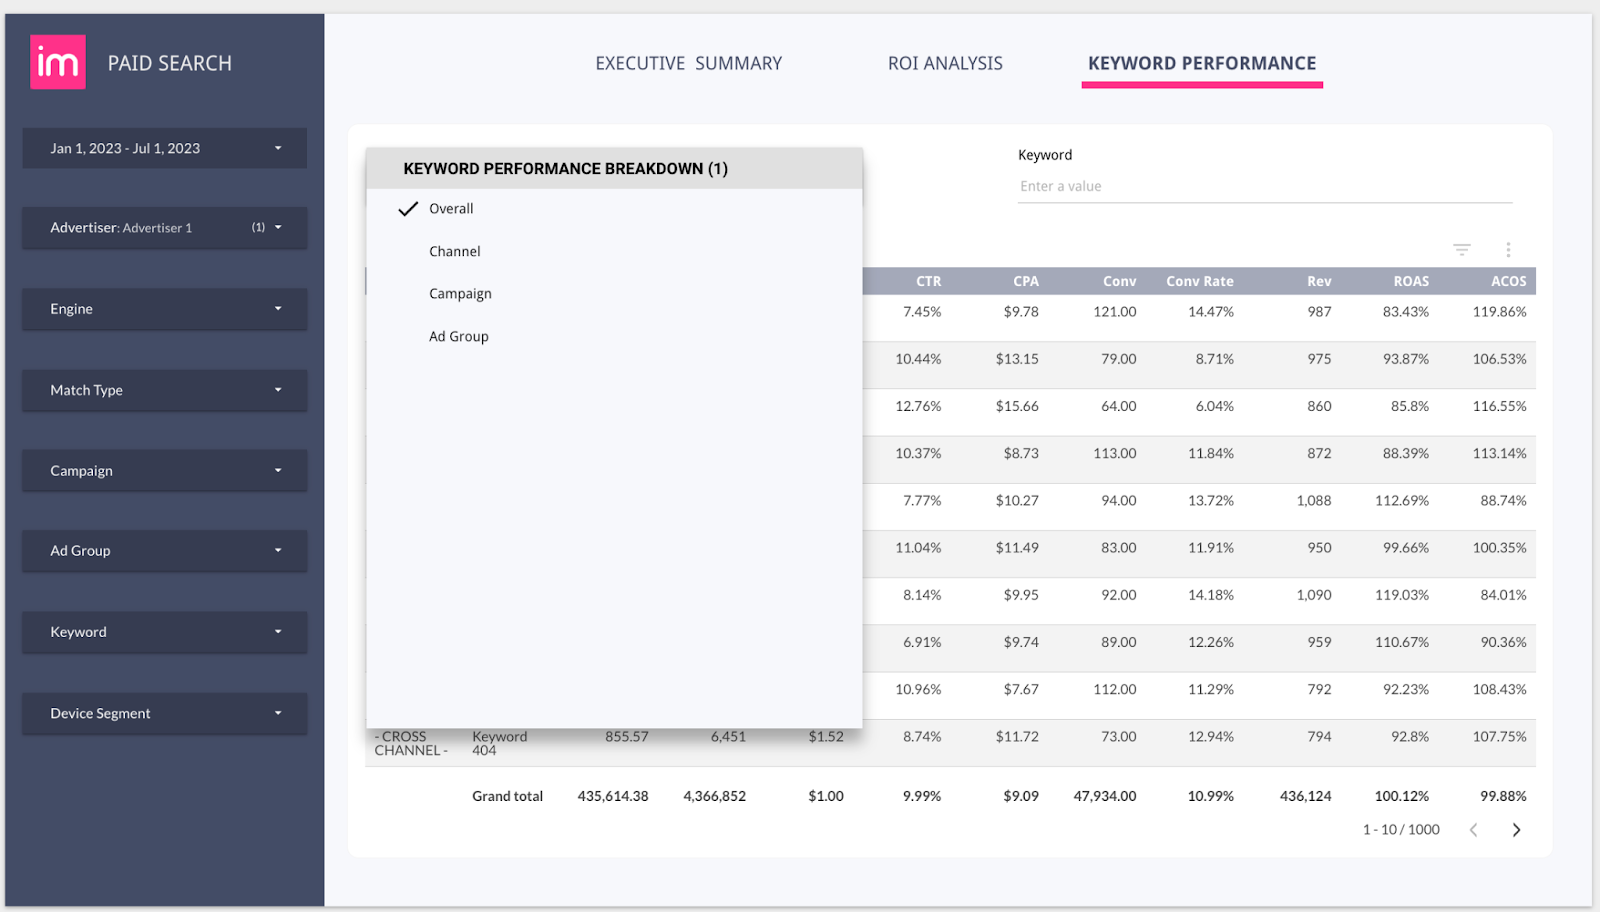
- Leverage Data Source Filters for Efficiency: Applying filters directly at the data source level is a best practice for managing large datasets efficiently. By setting up data source filters, you limit the amount of data processed before it reaches the report, reducing load times and improving performance. This is especially useful when working with complex or large data sources like BigQuery or Google Analytics.
- Combine Filters with Segments: Filters work well when combined with segments to create even more granular insights. Segments allow you to focus on specific user groups, such as new versus returning users or high-value customers. By applying filters within these segments, you can see how different audience types interact with your marketing campaigns.
Creating Calculated Fields in Looker Studio
Calculated fields in Looker Studio allow you to create new metrics and dimensions from your existing data. By using calculated fields, you can perform custom calculations directly within your reports, eliminating the need for pre-processed data and enabling more dynamic and real-time reporting.
Here's how to create and use calculated fields in Looker Studio:
- Use the Formula Editor for Easy Setup: Looker Studio provides a user-friendly formula editor where you can create your calculated field. Access the editor by clicking on “Add a Field” in the data panel of your report. Enter a name for your field, and then write your formula using available functions, such as arithmetic operations (+, -, *, /), conditional logic (IF statements), and text manipulation functions.
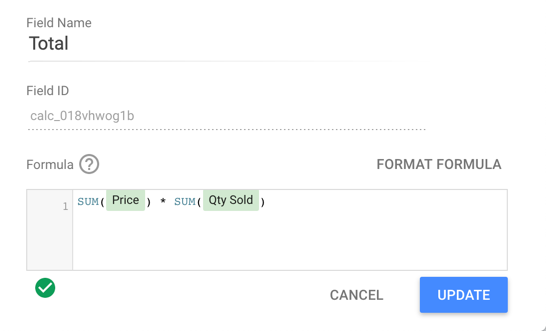
- Leverage Built-In Functions for Advanced Calculations: Looker Studio offers a wide range of built-in functions that can help you create more complex calculations, including mathematical, date, text, and aggregation functions. For instance, you can use CASE statements for conditional logic, CONCAT for combining text fields, or AVG to calculate the average of a metric over a specified period. These functions provide flexibility for creating fields tailored to your specific analysis needs.
- Integrate Calculated Fields into Visualizations: After validating your calculated field, integrate it into your visualizations. Calculated fields can be used like any other data metric in Looker Studio—add them to charts, tables, and scorecards to provide customized insights
Sharing and Collaborating on Looker Studio Reports
Once your report is ready, Looker Studio makes it easy to share and collaborate.
- Share Your Report: Click "Share" in the top-right corner of the report and invite others by email. You can choose whether they have viewing or editing access.
- Embed Reports: If you want to embed the report on a website or internal dashboard, Looker Studio offers an easy-to-use embed function. Simply generate the embed code and insert it into your site’s HTML.
- Schedule Report Delivery: For periodic updates, Looker Studio allows you to schedule reports to be sent automatically via email. This is useful for sending weekly or monthly updates to stakeholders.
Advanced Tips for Maximizing Looker Studio Efficiency
Looker Studio is packed with features that can make data visualization more efficient, knowing a few lifehacks can take your productivity to the next level.
These tips will help you speed up your workflow, enhance collaboration, and maximize the insights you can generate from your data.
1. Use Explorer Mode for Quick Data Exploration
Instead of building a full report, use Explorer Mode for quick data exploration.
Explorer allows you to experiment with charts and tables without affecting your main report. It’s perfect for quickly testing data connections or trying out new visualizations without the commitment of embedding them into a report.
- How to Access: From the Looker Studio home page, click "Create" > "Explorer." You can also access this feature by selecting a report or data source and choosing the "Explorer" option.
- When to Use: Use this feature when you need quick, ad-hoc analysis or to verify data integrity before finalizing your reports.
2. Leverage Reusable Templates for Consistency
If you’re creating multiple reports for similar use cases, save time by creating and using custom templates. Templates help maintain consistency across reports and eliminate the need to rebuild dashboards from scratch.
- Create Your Own Template: Once you’ve set up a report you like, click the three dots in the upper right corner of the report's thumbnail and select "Make a Copy." This will duplicate the report, allowing you to use it as a template for future projects.
- Why It Helps: This lifehack saves time by reducing redundant tasks and maintaining a consistent look across multiple reports, ensuring your data is always presented in a professional and standardized manner.
3. Use Community Visualizations for Advanced Customization
Community visualizations offer access to advanced and third-party visualizations that are not built into Looker Studio by default.
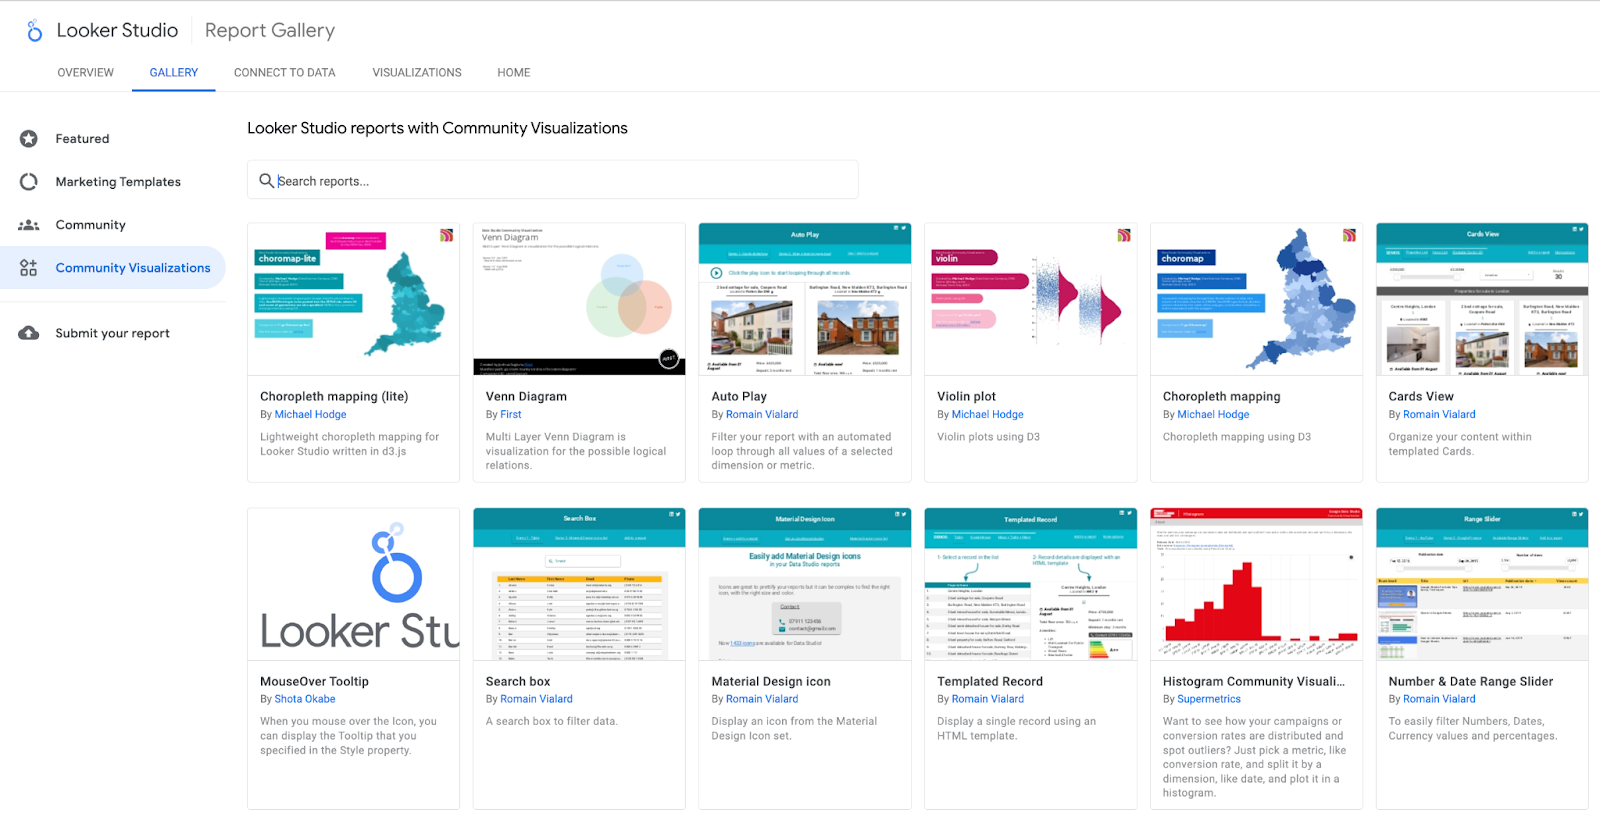
These visualizations can help you tailor your reports to specific needs, like advanced chart types or unique interactivity options.
- Where to Find Them: From the "Add a chart" menu, scroll down to "Community Visualizations" to see what’s available.
- Best Practices: Use community visualizations for special cases such as interactive maps, advanced funnel charts, or custom timelines, which can greatly enhance the depth of your report.
4. Shortcut to Applying Filters to Multiple Charts
Applying the same filter across multiple charts can be tedious. Looker Studio’s Filter Control feature allows you to quickly apply filters to multiple charts simultaneously.
- How to Use: Select the Filter Control option from the toolbar and drag it onto your dashboard. Once placed, you can set it to filter multiple charts that share the same data source.
- Best for: Use this lifehack to create dynamic reports where users can filter data across multiple charts, saving time and making your reports more interactive.
5. Embed Real-Time Data Widgets for Always-Up-To-Date Reports
One of Looker Studio’s strengths is its ability to display real-time data, making it ideal for live dashboards. By embedding real-time data widgets, you can keep stakeholders updated without needing to regenerate reports constantly.
- How to Add Real-Time Data: Connect Looker Studio to data sources like Google Analytics or Google Ads with real-time metrics enabled.
- Why It Works: This is perfect for creating real-time performance dashboards for campaigns or ongoing projects, reducing the need for manual updates and ensuring decision-makers always have the latest information.
6. Use Conditional Formatting for Better Insights
Conditional formatting allows you to highlight specific values in your reports, making it easier for viewers to identify trends, anomalies, or important KPIs at a glance.
- How to Apply: Select the chart or table you want to format, click on "Style," and scroll down to "Conditional Formatting." Set the rules based on the data values you want to highlight, such as using a red background for low performance or a green background for high performance.
- Best Practices: This is particularly effective during a Workday Implementation when visualizing financial data, sales performance, or marketing metrics, where deviations from targets need to be quickly identified.
7. Automate Data Harmonization with Improvado
Manually harmonizing data from various sources can be tedious and prone to error. Integrating Looker Studio with Improvado simplifies this process, automating the harmonization of data from multiple marketing channels.
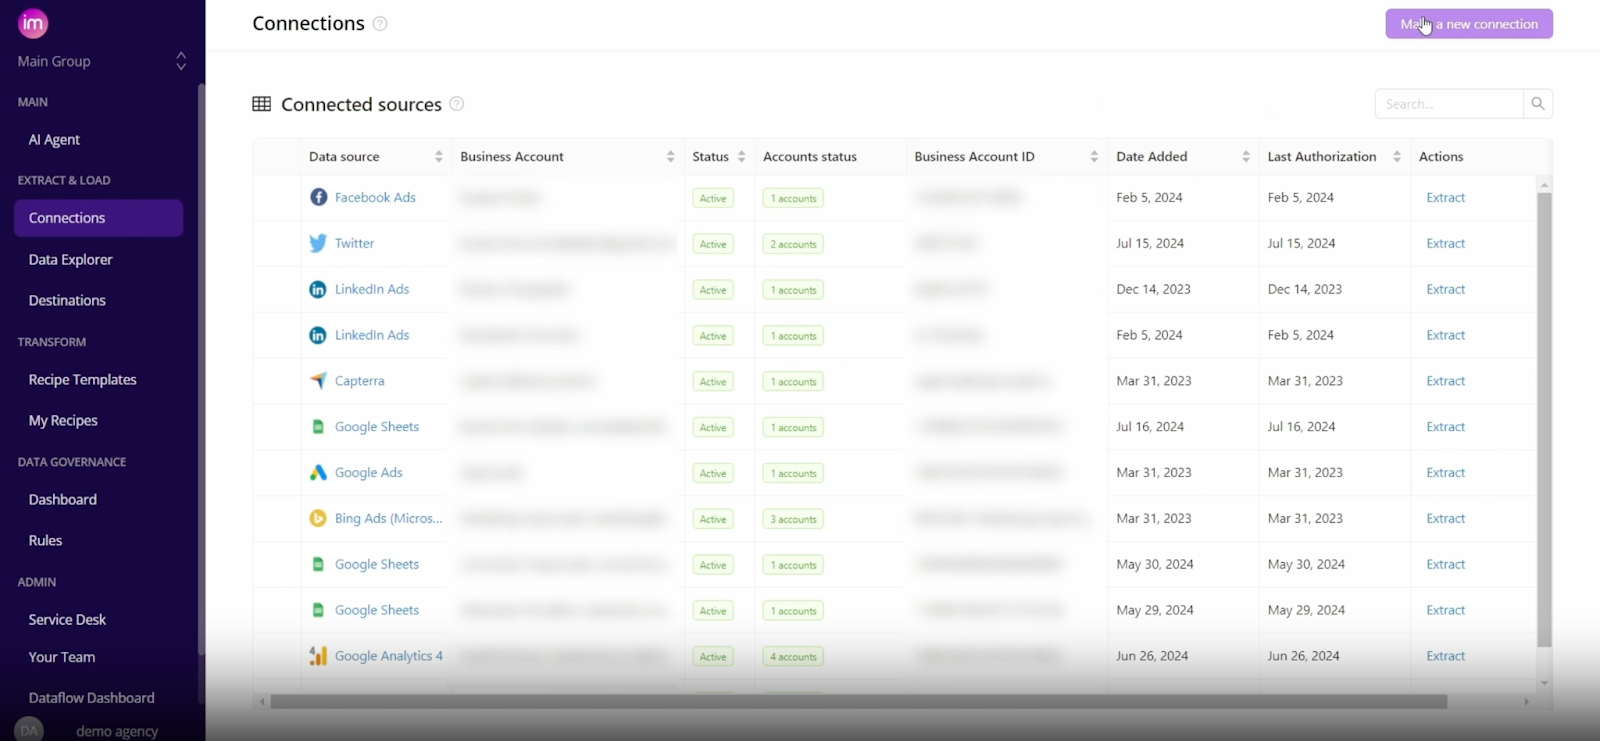
- How It Works: Improvado connects to over 500 marketing data sources, automatically normalizing and cleaning the data before sending it to Looker Studio for visualization and further analysis. This ensures that your data is consistent, accurate, and ready for analysis without manual adjustments.
- Advantages: By automating data harmonization and transformation, you eliminate manual errors and ensure that your reports are built on reliable, standardized data—saving you time and reducing the chances of misinterpretation.
Improvado also comes with pre-built dashboard templates tailored for marketing use cases, such as tracking paid ads, programmatic campaigns, or attributing revenue to marketing activities.
It significantly reduces the amount of manual work needed to start visualizing data and minimizes the likelihood of misleading visualization or errors with data harmonization and deduplication features.
By leveraging these tips, Looker Studio users can significantly improve their workflow, enhance report quality, and deliver more actionable insights to stakeholders. Combining these best practices with Improvado’s automation capabilities ensures that your data visualization process is not only streamlined but also maximized for impact.
.png)


.png)
