




Five findings
A national campaign does not create a national conversion
Media can scale centrally. Value is created locally, where capacity, qualification, service fit, attendance, and continued care determine whether a response becomes revenue.
Urgent-care demand expires with capacity
Near-me demand is valuable only while a specific clinic is open, has a credible wait time, and can take the next patient.
Urgent care category foundation → Choose with trust 6 of 8Dental booking handoffs dropped campaign context
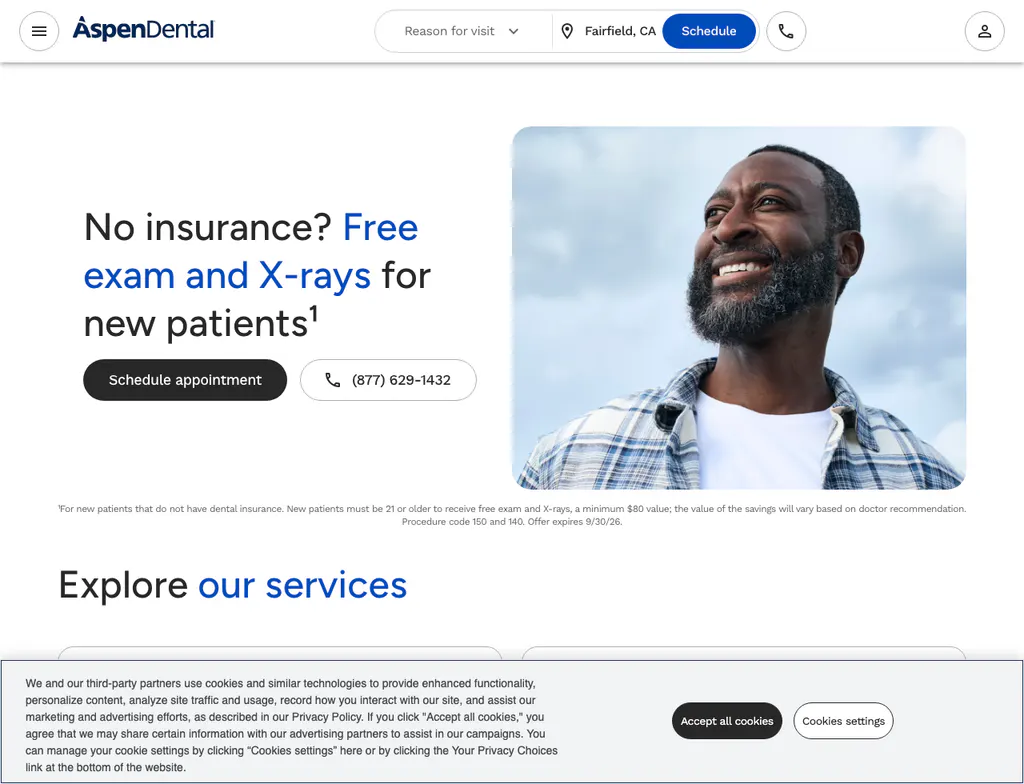
The inspected public flows kept the clinic visible while losing campaign identity. A complete location report can still contain an attribution gap.
Eight public booking handoffs inspected → Create desire Consultation ≠ revenueMed-spa economics begin after the lead
Attendance, treatment mix, financing, provider capacity, collected revenue, and repeat care sit between a response and margin.
Deep category study · 2 company audits → Qualify first Lead ≠ admissionBehavioral-health media needs an appropriate-care signal
Level of care, clinical fit, payer, geography, and available beds determine whether an inquiry can become an appropriate admission.
Category foundation · no company-audit rate →A national winner can be a local failure
Creative, bidding, and brand can scale centrally. Capacity, hours, provider mix, payer fit, inventory, and follow-up speed do not. Marketing performance is partly an operating-state problem.
A lead is a promise of care—not proof of revenue
A call, form, quiz, screening, consultation, exam, or booking is a promise of future care—not proof that it happened or created value.
Location tags alone hide service-line economics
The same clinic can contain medical and cosmetic care, retail and clinical journeys, referral and consumer demand, or several levels of care with different economics.
Creative changes the patient mix
The promise in an ad changes who responds, which service they expect, what offer they cite, and whether a local team can deliver the experience.
Ad platforms automate faster than kept-care feedback
Across 13 qualitative category studies, paid-media automation is the most mature workflow. Attribution QA and compliance are mostly labeled Rare. These are editorial maturity labels, not adoption rates.
Demand motions
Four demand motions marketers should stop blending
Search, social, and local media behave differently when the scarce input is today’s capacity, clinician trust, treatment desire, or eligibility.
 CityMD · first-party example ↗
 Availability is part of the ad
Near-me demand converts against what is true at a specific place and moment: open hours, wait time, emergency access, walk-in rules, and the ability to take the next patient.
- Where marketing loses
- A nationally efficient campaign can send demand to a location that is closed, full, or wrong for the need.
- Decision to make
- Where can we responsibly accept more demand right now?
- Urgent care
- Veterinary
- Chiropractic
 Aspen Dental · first-party example ↗
 Local proof has to survive the handoff
Patients compare a practice, clinician, referral path, benefit, or long-term relationship. The practice and service context that earned trust must still be present when the person calls or books.
- Where marketing loses
- The campaign creates an inquiry, but the handoff loses the practice, referral, payer, or service context that made the patient act.
- Decision to make
- What evidence makes this person choose this clinician or location?
- Dental DSO
- Physical therapy
- Fertility & IVF
- Hearing care
 Milan Laser Hair Removal · first-party example ↗
 Creative, financing, and offers create demand
The patient may not begin with urgent intent. Visual proof, treatment education, transparent financing, and a concrete offer move passive interest toward an attended consultation.
- Where marketing loses
- A winning asset is scaled into markets where provider capacity, treatment mix, inventory, or margin cannot support the promise.
- Decision to make
- Which concept creates profitable treatment—not just response?
- Med spa
- Dermatology
- Eye care & optical
 Pinnacle Treatment Centers · first-party example ↗
 The lead is upstream of the real decision
Eligibility, clinical fit, insurance, treatment route, program level, medication supply, or safety determines whether an inquiry can become appropriate care.
- Where marketing loses
- Media learns from calls or forms that never become a qualified consultation, admission, procedure, or treatment start.
- Decision to make
- Which downstream signal is useful and permissible to return to media?
- Vein & vascular
- Behavioral health
- Medical weight loss
AI reality
Platforms automate buying. Kept-care feedback still lags.
Paid-media automation is the most mature workflow in our qualitative studies. Attribution QA and compliance are mostly labeled Rare. Bids can move before the operator knows which calls booked, which patients arrived, or which care created value.
Paid-media optimization is labeled widespread in 6 of 13 studies. Attribution and data QA is labeled rare in 8; compliance and privacy is rare in 12.
Study labels, not market adoption: paid-media maturity is based on 9 cross-industry proxies and 4 operator examplesAcross all 117 workflow labels: 32 verified industry evidence, 23 cross-industry proxies, 37 operator examples, and 25 Improvado hypotheses. These are different evidence classes, not comparable adoption denominators.
0 W 4 E 9 R
0 W 7 E 6 R
6 W 4 E 3 R
0 W 7 E 6 R
0 W 5 E 8 R
0 W 9 E 4 R
0 W 8 E 5 R
1 W 9 E 3 R
0 W 1 E 12 R
Local facts are the bottleneck
Creative production is Rare in 9 of 13 studies. Scale only approved claims, local imagery, service availability, and assets that retain concept and offer IDs through the outcome.
Classify the call, then verify it booked
Call analysis is Emerging in 9 studies. Compare the AI disposition with booking, attendance, and qualified-care records—not the transcript alone.
Act only on validated inventory
Scheduling and engagement is Emerging or Widespread in 10 studies. Let agents use only validated services, slots, escalation rules, and source IDs.
Category studies
Start with the category that matches your conversion model
Each study names the real outcome, local constraint, creative evidence, nine AI workflows, and evidence depth for that category.
Aspen Dental · attributed example Dental support organizations
Local practices scale under national operating platforms.
- Marketing tension
- Location survives more often than campaign
- Real outcome
- kept care and collected revenue
 Banfield Pet Hospital · attributed example
 Multi-location veterinary groups
A mature consolidation market built on local trust.
- Marketing tension
- Acquired brands preserve separate histories
- Real outcome
- completed care and retained pet/household value
CityMD · attributed example Urgent care center networks
Same-day demand makes local pacing operational.
- Marketing tension
- Advertiser ownership may split by franchise
- Real outcome
- completed visit matched to capacity and payer context
 QualDerm Partners · attributed example
 Dermatology practice groups
Medical and cosmetic funnels share the same locations.
- Marketing tension
- Service line disappears inside blended CAC
- Real outcome
- kept visit or completed procedure with service-line economics
 ATI Physical Therapy · attributed example
 Outpatient physical therapy clinic networks
The largest footprints mix referral and consumer demand.
- Marketing tension
- Large estates magnify naming drift
- Real outcome
- completed plan-of-care value, not a booked evaluation
Milan Laser Hair Removal · attributed example Med spa and aesthetics
Cash-pay acquisition only becomes useful when consultation, capacity, and treatment revenue stay joined.
- Marketing tension
- National ads meet local schedules
- Real outcome
- attended, profitable treatment and repeat value
 America's Best · attributed example
 Eye care and optical retail groups
Retail, exams, insurance, and e-commerce converge.
- Marketing tension
- Product context is lost in clinic reporting
- Real outcome
- exam and retained product margin, measured separately
 Shady Grove Fertility · attributed example
 Fertility and IVF clinic networks
Long consideration cycles meet sensitive patient journeys.
- Marketing tension
- Sensitive journeys resist simple retargeting
- Real outcome
- appropriate treatment start and protected longitudinal value
 USA Vein Clinics · attributed example
 Vein and vascular clinics
Procedure-led demand runs through calls and eligibility.
- Marketing tension
- The phone creates a new identity namespace
- Real outcome
- completed treatment matched to qualified demand
 Miracle-Ear · attributed example
 Hearing care and audiology networks
Local testing, fitting, and service compete with self-directed OTC care.
- Marketing tension
- Franchise and clinical records diverge
- Real outcome
- retained fitting and follow-up value
 The Joint Chiropractic · attributed example
 Chiropractic clinic networks
Walk-in, membership, insurance, and care-plan models do not share one funnel.
- Marketing tension
- Corporate and franchise spend split
- Real outcome
- retained care-plan or membership value
Pinnacle Treatment Centers · attributed example Behavioral health and addiction treatment networks
Level of care, safety, eligibility, and capacity determine whether an inquiry can become admission.
- Marketing tension
- One network contains different care settings
- Real outcome
- appropriate, completed treatment start with protected outcomes
 Medi-Weightloss · attributed example
 Medical weight loss and GLP-1 clinics
Eligibility, prescription, fill, adherence, and regulation sit between a quiz and durable care.
- Marketing tension
- Product route changes the economics
- Real outcome
- clinically appropriate treatment start and retained care
Conversion contracts
Decide what counts before you compare performance
Each row names the first economic event worth optimizing toward and the context that makes a location-level comparison fair.
Method
What this study can say—and what it cannot
We asked the same questions across 13 studies but kept category evidence separate. Percentages appear only with a source, date, and denominator. The AI chart counts our own qualitative labels; it is not a market-adoption survey.
Methodology
This edition reviewed 100 multi-location healthcare and wellness operators across 13 clinic categories, each evaluated from location directories, sitemaps, booking paths, public web tags, ad transparency libraries, ownership announcements, and public operating-model evidence - the same method every category study on this site inherits from this edition. 29 candidate operators were excluded after triage. Of the reviewed operators, 33 received a full company audit, backed by 462 dated public source records. Published 2026-07-26, last updated 2026-08-05. Company and location totals describe this selected research registry, not the full U.S. market.
Each study defines its own demand model, conversion, local constraint, and measurement contract.
A selected research cohort, not a market census. Parent and child brands remain distinct.
Evidence depth varies by category. Pages without company audits are explicitly labeled as foundation studies.
Directories, filings, policies, booking paths, public tags, and attributed campaigns are dated and linked.
Read the synthesis with these limits
- The demand motions are dominant operating patterns, not mutually exclusive market segments.
- AI maturity counts summarize 13 qualitative category studies. They are not a survey, penetration estimate, or vendor market-share claim.
- A vendor capability and a named operator example are kept separate from the evidence used to classify maturity.
- Company and location totals describe the selected research registry, not the full US market.
Evidence anchors for the meta-study
- Dental DSO category study The deepest identity-handoff study: practice brands, schedulers, calls, kept care, and AI. ↗
- Med Spa & Aesthetics category study Creative-led demand, offer journey, provider capacity, treatment economics, privacy, and AI. ↗
- Urgent care category study The clearest location-hour case: near-me demand, wait time, booking, walk-ins, and visits. ↗
- Behavioral health category study Qualification, level of care, admissions routing, capacity, and the narrow privacy boundary. ↗
- Named operator evidence rows The public operator-level registry behind the category cohort and audit-status counts. ↗
Every category page carries its own external source ledger and separates verified industry evidence, cross-industry proxy, operator example, and Improvado hypothesis. Public inspection cannot see CRM, practice-management, EHR/EMR, billing, warehouse, or agency-reconciliation layers unless a named source documents them.
Download the named operator evidence rows (CSV) ↗