

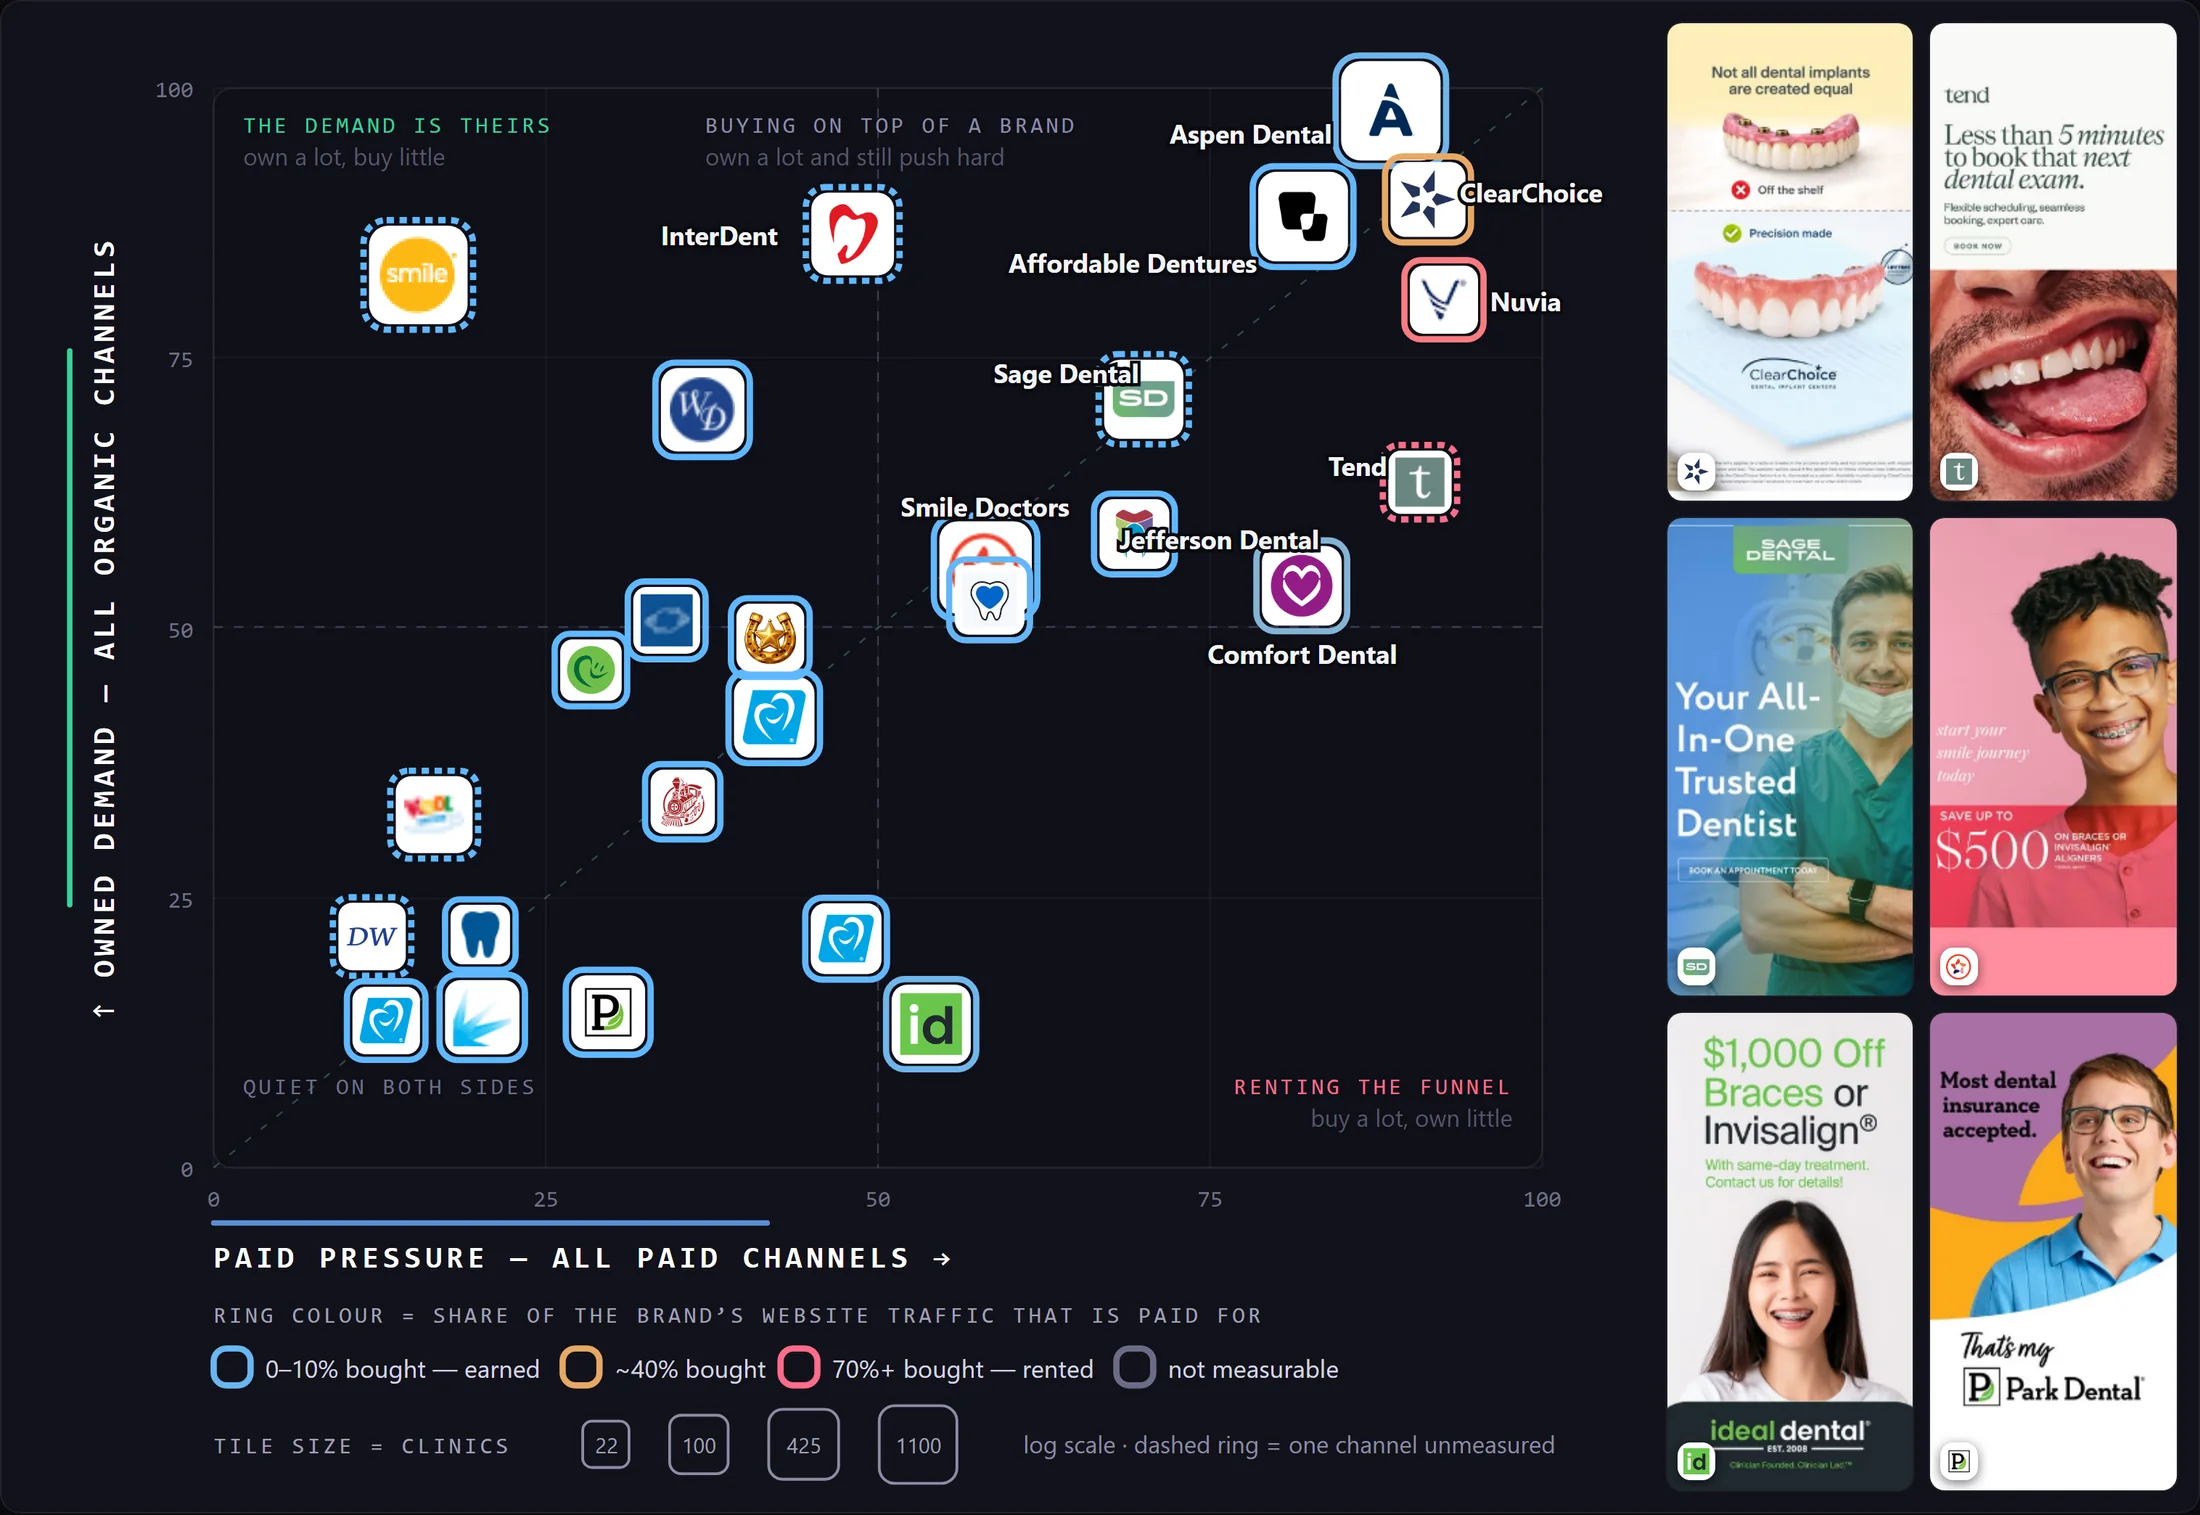
Executive read
One DSO can support hundreds of practice identities at once
The visible operating tension is not simply local versus national: the same group can also run shared paid-media buying, multiple booking paths, and inherited call-tracking or analytics accounts at the same time. Four lenses translate the public evidence into the questions a category marketer needs to answer: how demand is created, where conversion happens, where measurement breaks, and what to change.
The patient sees a practice, not the holdco
Corporate domains often recruit dentists and sellers while consumer brands, local pages, calls, and offers do the acquisition work.
The chair is booked after several identity handoffs
A click can move through a brand site, location parameter, scheduler, call vendor, and practice record before revenue exists.
Location survives more often than campaign
The clinic identifier is usually preserved for operations, while UTMs and click identifiers disappear at the booking boundary.
Build the clinic crosswalk before the dashboard
Normalize brand, facility, scheduler, legal-entity, and call-tracking IDs so paid media can be joined to booked care.
Attribution problem
The clinic survives every handoff. The campaign usually does not.
In six of eight inspected booking handoffs the campaign identifier was dropped while the clinic identifier survived, and none of six inspected forms carried a UTM field or gclid into submission. On the public path, an operator can see which office got booked but not which campaign booked it.
How much of each identifier survives, hop by hop
| Step | Clinic identity present | Campaign identity present | What was observed |
|---|---|---|---|
| Ad click | 100% | 100% | both present |
| Landing page | 100% | 100% | location becomes a bespoke key |
| Booking handoff | 100% | 25% | 6 of 8 drop the campaign |
| Form or call | 100% | 0% | 0 of 6 carry either |
| Chair / CRM | 100% | 0% | source is inferred |
This describes the inspected public web layer. It does not show internal CRM, warehouse, call-centre, or agency reconciliation, and is not a claim that an operator cannot measure a campaign inside its own systems.
Six findings
The gap is a join, not a dashboard
Media is often bought at national or brand level while the operating result is created per chair. Media, location, scheduler, and patient record each sit in a different identifier namespace, and nothing in the public funnel joins them.
One dot per operator or flow actually inspected. Denominators differ by row on purpose: some findings were checked across all eighteen operators, others across the eight booking handoffs or six forms that could be inspected end to end.
Clinic identity survives the funnel; campaign identity does not
Six of eight inspected booking handoffs dropped campaign context while keeping the clinic, and none of six inspected forms carried a UTM field or gclid into submission. From the public layer alone, an operator can see which office got booked, but not which campaign booked it.
The gap is a join, not a dashboard
Media, location, scheduler, and patient record each live in a different identifier namespace. Nothing in the public funnel joins them, so location-level return has to be built as a deliberate identity crosswalk before another reporting tool can help.
Every local key is proprietary
All nine operators with a per-location paid destination used a bespoke facility parameter rather than a governed UTM field, creating a crosswalk problem at every redirect.
“Blog” usually does not mean patient marketing
Nine of eighteen corporate domains publish no patient content at all. What sits at /blog or /news is frequently a labour-supply and deal-flow channel (doctor recruitment, affiliation announcements, practice-sale material), while patient content, where it exists, lives on a separate consumer domain.
The corporate domain is often the wrong marketing surface
Nine corporate domains had no patient booking path and nine returned no Google Ads Transparency creatives. Demand usually runs one layer down on consumer brands and practice sites.
Stack posture does not track size
Privacy-safe collection appeared on 4 of 18 operators and footprint does not predict it: the largest operator in the set showed no consent platform on the reviewed surface, while the earliest deployment belongs to a 100-centre operator with high revenue per patient. Patient economics and direct exposure explain more than location count.
Three operating models, and why a category average misleads across them
- 01 One national domain
A single consumer brand carries booking, offers, and measurement on its own domain. Campaign-to-clinic joins are tractable because one team owns the whole path.
On-domain scheduler, facility code in the URL, a single tag container. - 02 A federated house of brands
The holdco is invisible to patients and each consumer brand runs its own site, offers, and ad accounts. Category-level reporting requires reconciling brands before markets.
Corporate domain with no booking path; separate brand domains with separate stacks. - 03 An invisible supporter
No consumer surface at all: the group supports independently branded practices. Marketing accountability sits with the practice or an agency, not the centre.
Corporate domain publishes recruitment and affiliation content only.
The offer grammar repeats across the category
Door opener
A free or low-price exam and X-rays, usually anchored against a stated retail value.
No-insurance answer
A membership plan that converts affordability into a recurring relationship.
Big-ticket financing
Implants, dentures, and orthodontics expressed as a monthly payment rather than total price.
Creative fieldbook
The category sells through offers, speed, local intent, and life outcomes
These examples are selected for strategic clarity, not aesthetics alone. Each makes a different acquisition mechanism visible, and each exposes a different measurement requirement behind the creative.
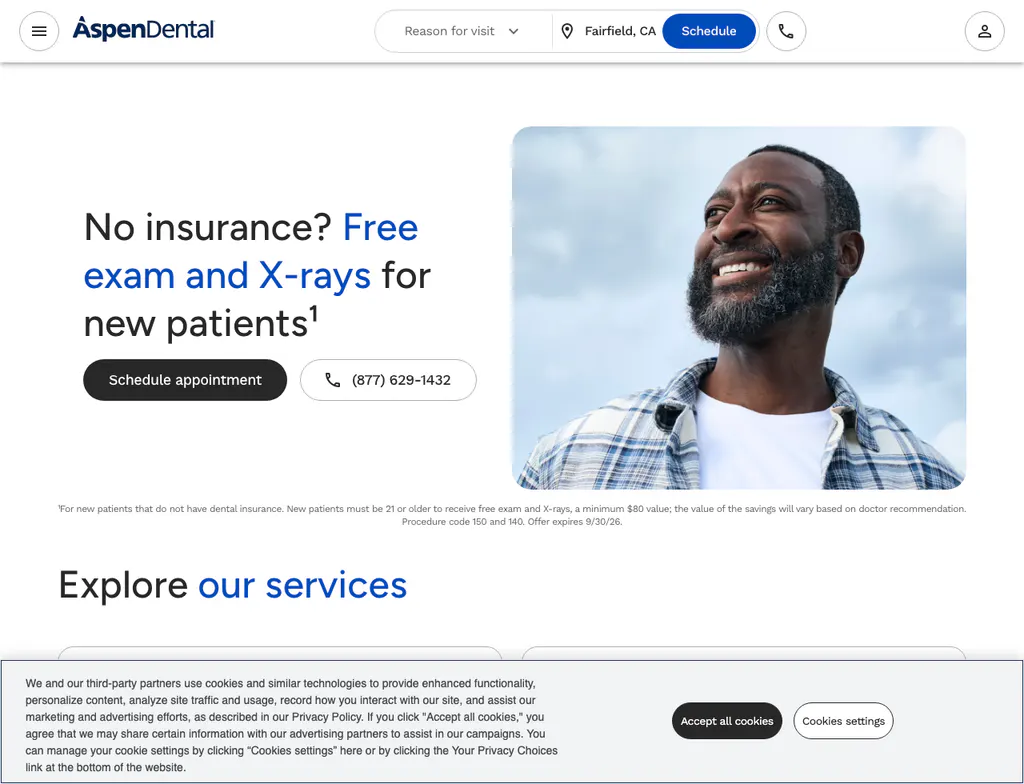
The free exam remains the category’s clearest door opener
The hero answers the insurance objection immediately, attaches a minimum value, and keeps appointment and phone conversion paths equally visible.
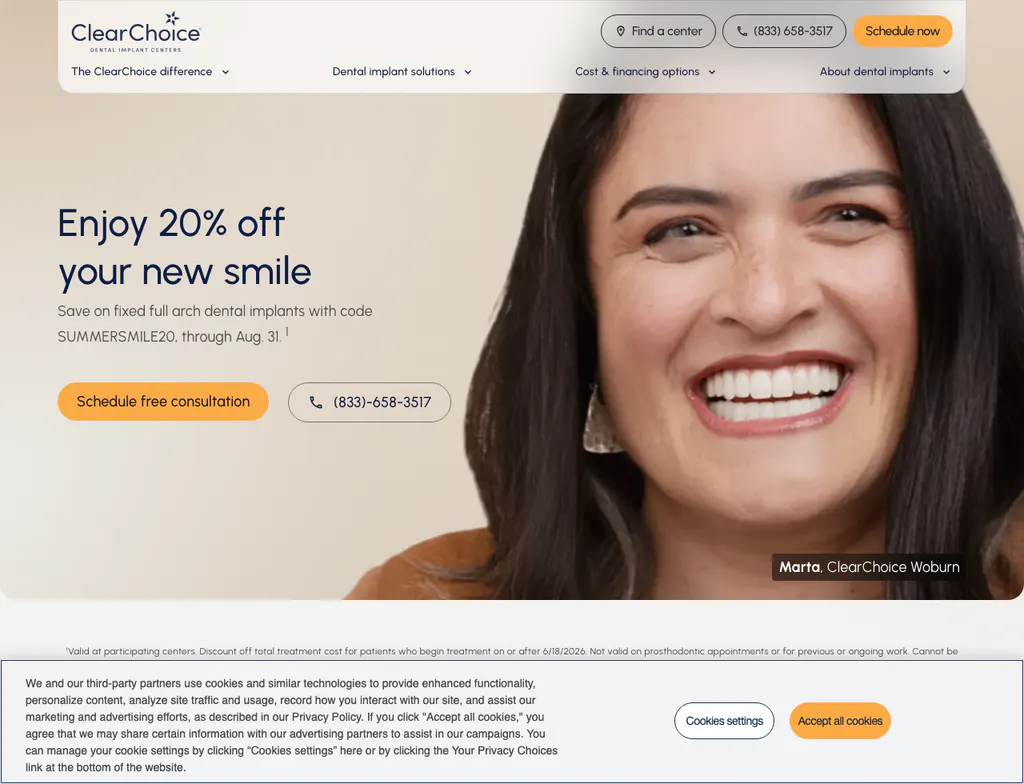
A hard deadline turns a major procedure into a retail offer
The 20% discount, promo code, expiry date, patient face, and free-consultation CTA compress a high-consideration treatment into one legible decision.
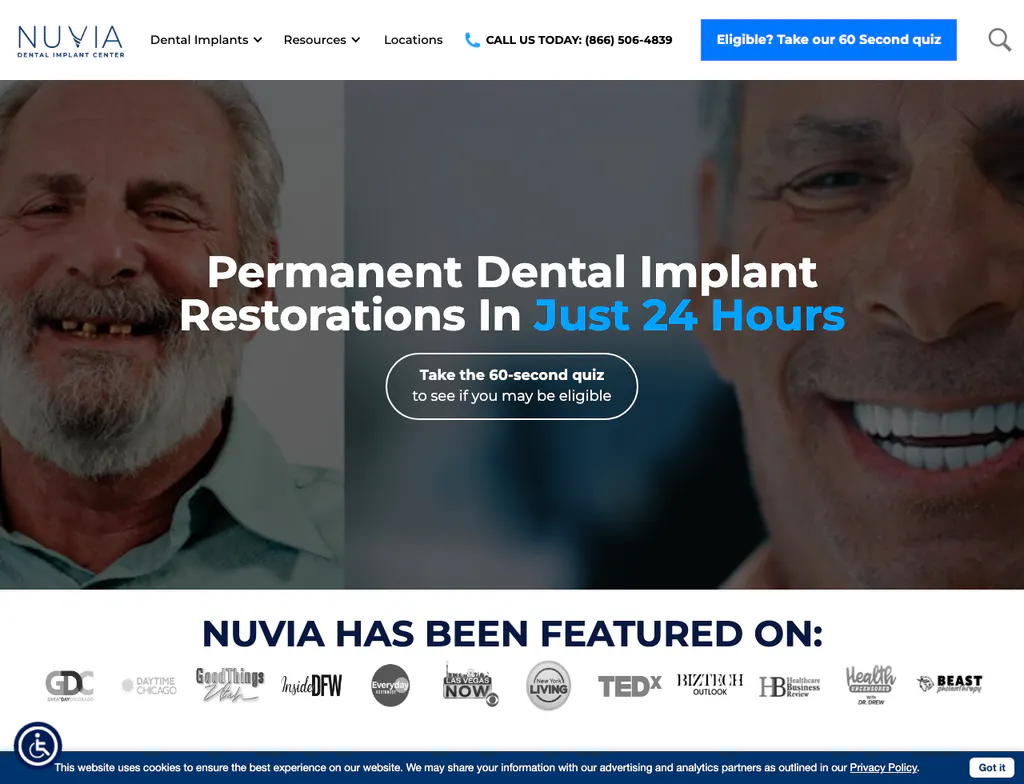
Speed plus a 60-second quiz creates a direct-response system
The promise is unusually concrete for implants: permanent restoration in 24 hours. Eligibility becomes the low-friction conversion event.
“Beyond dentistry” expands the category before selling care
Instead of leading with an appointment or discount, the brand reframes oral care as whole-body health and creates a broader editorial platform.
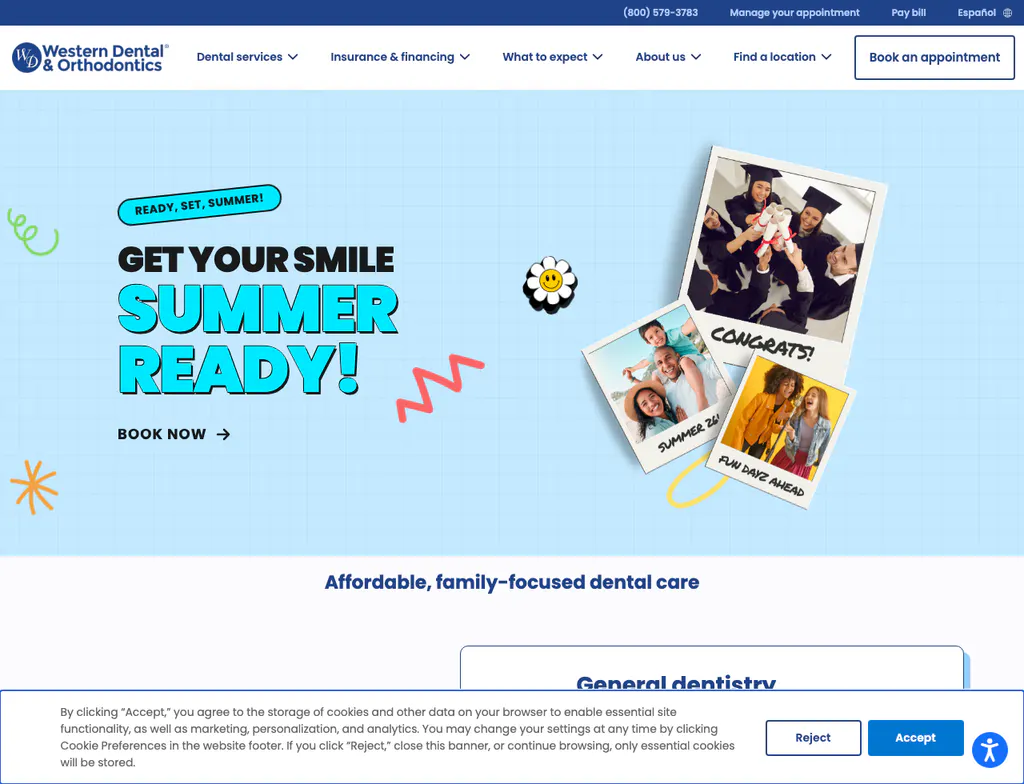
Seasonal culture gives routine care a campaign frame
A graduation-and-summer visual system makes an evergreen appointment feel timely without depending on a price promotion.
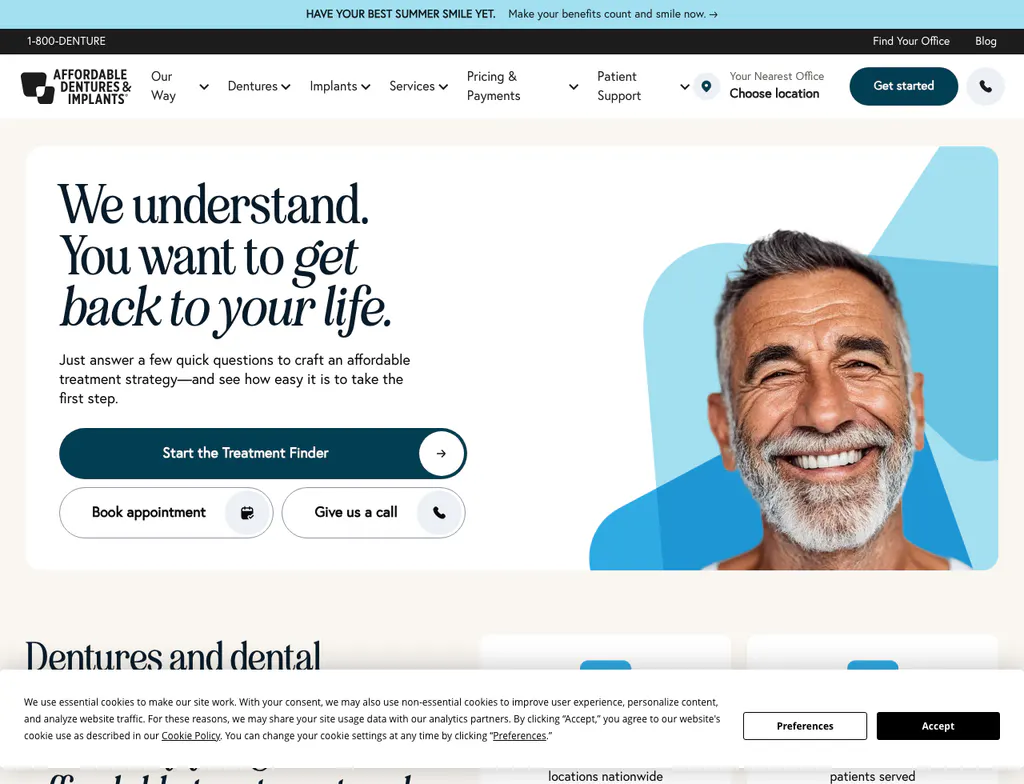
Life restoration is stronger than procedure language
The message starts with empathy and the patient’s desired life outcome, then routes the visitor through a treatment finder rather than a generic contact form.
Local intent is the hero, not an afterthought
The national brand immediately asks for a city, state, or ZIP. The creative and conversion architecture share the same local-market thesis.
Peace of mind replaces the usual smile-and-price grammar
The muted palette, research-backed-care claim, and calm emotional promise create a distinctive alternative to promotional category conventions.
8 of 8 examples shown
Three offer systems across three moments in time
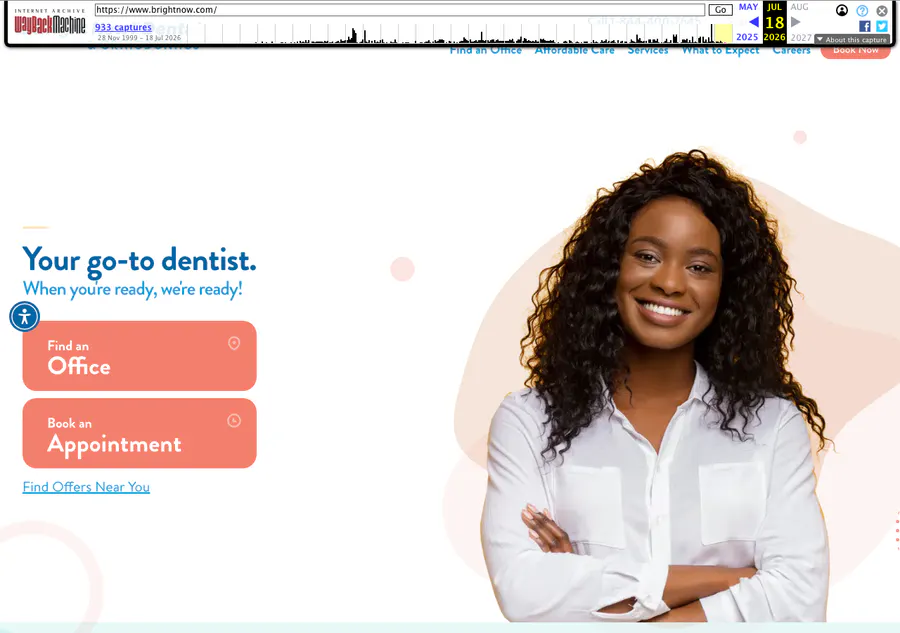
Aspen cycles between free, priced, and plan-led entry points. Bright Now holds a price for years. Great Expressions gradually removes visible plan pricing.
Free exam plus a 20%-off rider
The entry offer and treatment discount were stacked in the same acquisition frame.
The savings plan becomes the product
By 2023, the hero foregrounded a $39 annual plan while keeping the exam free.
The free door opener returns
After a six-month $29 test, the live hero returned to a free exam and X-rays.
$39 entry offer
The low-priced new-patient offer anchored the 2021 conversion surface.
$59 exam and digital X-rays
The price moved up, but the offer structure remained stable.
The $59 offer survives 32 months
The same price persisted into 2026, showing offer durability rather than constant testing.
$35 individual / $50 family membership
The membership plan was sold with transparent, consumer-style pricing.
$69 individual / $99 family
The same acquisition product was repriced while remaining fully visible.
The membership price disappears
By 2026, the plan remained but the price was removed from the acquisition surface.
9 of 9 examples shown
The number inside the door-opener moves, in public
The headline price in a new-patient offer sits on a public homepage, so its movement can be read from dated captures. Three brands, three different postures over the same five years: one cycling, one frozen, one that removed its price altogether.
- Aspen Dental 2021-06 free exam plus a 20%-off rider → 2023-11 plan-led; exam still free → 2026-04 $29 exam → 2026-07 back to free, anchored at $80
- Bright Now! Dental 2021-11 $39 → 2023-11 $59 → 2026-07 still $59, 32 months unchanged
- Great Expressions 2021-01 $35 individual / $50 family → 2023-01 $69 individual / $99 family → 2026-01 price removed from the page
Prices are read from dated public captures. Movement is observable; it is not evidence of a controlled test, and no performance data is available. The three series are not the same product: two are per-visit exam prices and one is an annual membership fee, as labelled.
Captures are shown for comparative research and commentary. Creative work, company names, and trademarks belong to the respective operators.
Content and org
The blog and the job board give the model away
Both are public, both are cheap to check on any competitor set, and both were more informative here than the tag stack.
The blog is usually not for patients
Nine of eighteen corporate domains publish no patient content at all. What
sits at /blog or /news is frequently doctor
recruitment, affiliation announcements, and practice-sale material: a
labour-supply and deal-flow channel rather than demand generation. Where
patient content exists it usually lives on a separate consumer domain, and
cadence is bimodal: a small number of brands publish at industrial volume
while most publish rarely or not at all.
Read as a competitive opening: in a category where most operators publish nothing to patients, organic patient content is close to uncontested.
Where the marketing function actually sits
On a single-day read of all eighteen job boards, twelve operators had no open marketing, growth, analytics, or martech role, including several carrying hundreds of open requisitions elsewhere. Nineteen marketing roles were open across the whole category and about half were field or community marketers doing referring-doctor visits and local events.
Where a category advertises few central marketing roles, the performance function is usually one level up (a sponsor-level centre of excellence, a shared-services group, or an agency), which is where a category conversation actually lands.
A hiring snapshot shows where roles were posted that day. It cannot prove that a company lacks marketers, tooling, agency support, or an accountable internal owner.
AI adoption
Nine workflows: what AI changes, and what it still cannot fix
Dental groups are already buying AI at the edges of the patient journey: media platforms, listings, calls, and front-office engagement. The clinic crosswalk and campaign identity still break before booked care and revenue.
Vendor capabilities and operator case studies prove that the workflows exist; they do not establish a DSO adoption rate. Maturity labels are explicitly qualitative and their evidence basis is shown on every row.
Creative production
Emerging Maturity basis · Cross-industry proxyGoogle and Meta can generate, resize, animate, and vary images or video inside campaign workflows.
Still manual / non-AIDSO teams still select the practice, service, offer, clinicians, consented imagery, and claim language, then approve local variants.
Meta documents AI image, text, video, and placement variation; no dental-specific utilization denominator is published.
Local-brand variation, clinical claims, patient-image consent, and no governed link from generated asset to practice outcome.
Message and copy generation
Emerging Maturity basis · Verified industry evidenceDental-focused marketing platforms generate review replies, social captions, content ideas, and assisted patient messages.
Still manual / non-AIClinical accuracy, tone, local offers, provider facts, and public responses involving patient context still require review.
Birdeye documents AI review responses, social captions, messaging, and chatbot workflows for dental practices.
Unstructured brand rules and patient-specific context make unrestricted generation unsafe across hundreds of practices.
Paid-media optimization
Widespread Maturity basis · Cross-industry proxyGoogle Smart Bidding and Meta Advantage+ automate bidding, audience expansion, placements, and creative delivery.
Still manual / non-AITeams still choose budget, objective, geography, service line, conversion definition, exclusions, and whether platform feedback is trustworthy.
Google documents auction-time AI optimization to conversions or conversion value; it does not publish dental usage rates.
If a scheduler drops campaign identity or sends only a lead, the algorithm optimizes to the wrong proxy.
SEO and GEO
Emerging Maturity basis · Improvado hypothesisDental-specific tools now monitor AI-search citations, suggest listing fixes, draft review responses, and surface local visibility gaps.
Still manual / non-AIProvider/service accuracy, local page differentiation, medical review, NAP governance, and remediation ownership remain operational work.
Birdeye documents dental-specific AI-search monitoring and listing optimization; Aspen Dental is named among enterprise brands using Birdeye, not as a product-level adoption proof.
Local facts are fragmented across practice sites, directories, schedulers, provider rosters, and reviews.
UTM, attribution, and data QA
Rare Maturity basis · Improvado hypothesisAI-enabled healthcare attribution tools can classify calls, reconcile touchpoints, and flag missing or inconsistent conversion paths.
Still manual / non-AIThe Dental audit still found campaign IDs dropped in six of eight inspected booking handoffs; clinic/brand/scheduler crosswalks and UTM governance remain manual foundations.
Liine documents session-level attribution across calls, forms, and online bookings; public capability is not proof of category penetration.
AI cannot reconstruct a campaign identifier that was never captured or safely joined to the booked-care record.
Call analysis
Emerging Maturity basis · Operator exampleCall intelligence summarizes conversations, identifies new-patient and unscheduled-appointment calls, and surfaces sentiment or coaching moments.
Still manual / non-AITeams still define qualification, audit errors, coach staff, resolve exceptions, and connect call outcomes to booked and attended care.
The operator case documents recurring use of AI summaries and sentiment analysis; one practice case is not an industry adoption rate.
Call classification without scheduler, practice, campaign, and revenue joins produces coaching insight but incomplete marketing truth.
Lead routing and CRM
Emerging Maturity basis · Verified industry evidenceDental front-office AI can answer common questions, continue missed calls by text, create tasks, and route exceptions to staff.
Still manual / non-AIComplex treatment fit, insurance, urgency, provider selection, duplicate patients, and ownership of stalled leads remain human workflows.
The dental early-access workflow supports Dentrix, Eaglesoft, and Open Dental and escalates with a conversation summary.
Practice-management integrations, patient identity, routing rules, and exception ownership vary by acquired practice.
Scheduling and patient engagement
Emerging Maturity basis · Verified industry evidenceAI receptionists can answer after-hours calls/texts, handle FAQs, book or reschedule supported appointments, and follow up missed calls.
Still manual / non-AIClinical triage, complex scheduling, insurance exceptions, treatment-plan decisions, and escalation remain with trained staff.
The 2026 ADA-member endorsement describes an AI receptionist and multi-location DSO workflows; it proves availability, not universal adoption.
Real-time chair/provider capacity and local PMS rules are inconsistent across practices.
Compliance and privacy
Rare Maturity basis · Improvado hypothesisPlatforms can assist with moderation, consent-state checks, transcript redaction, and policy review, but these are controls, not an autonomous compliance decision.
Still manual / non-AICovered-entity status, BAAs, minimum-necessary use, patient consent, sensitive-ad policy, legal review, and incident ownership remain accountable human decisions.
HHS defines the disclosure boundary for regulated online tracking; it does not endorse AI as a compliance substitute.
AI can apply a policy only after entity, surface, purpose, data class, vendor contract, and destination are accurately modeled.
Operator map
Where dental DSO operators sit
Highlighted companies have enough dated public evidence for both directional scores. The full cohort stays in the background for market context.
This is a different lens from the demand map at the top of the page. The opening exhibit shows where each group's demand comes from: owned channels against paid pressure. This map shows how the paid machine is governed: whether buying runs through one central operation or through many local hands.
The vertical axis reads governance: the higher a company sits, the more its marketing runs as one central function. The horizontal axis reads public paid intensity: how much visible, sustained paid demand the company generates across ad libraries and its web estate. Green points are dental groups with enough dated evidence to score on both axes. The dimmed points are the wider multi-location healthcare cohort, kept in view so the category can be compared against its neighbors.
Where public demand intensity meets marketing-operations centralization
Directional scores synthesize dated public ad-library, website, tag-layer, and operating-model evidence. They are not spend, revenue, or vendor-performance scores, and not published rubric composites; positions are directional synthesis.
- Aspen Dental: paid demand 70 out of 100; marketing operations centralization 88 out of 100.
- Heartland Dental: paid demand 45 out of 100; marketing operations centralization 22 out of 100.
- PDS Health: paid demand 72 out of 100; marketing operations centralization 92 out of 100.
- SALT Dental Partners: paid demand 22 out of 100; marketing operations centralization 15 out of 100.
- Smile Brands: paid demand 68 out of 100; marketing operations centralization 20 out of 100.
- Smile Doctors: paid demand 72 out of 100; marketing operations centralization 62 out of 100.
- Sonrava Health: paid demand 68 out of 100; marketing operations centralization 34 out of 100.
- Forefront Dermatology: paid demand 26 out of 100; marketing operations centralization 86 out of 100.
- QualDerm Partners: paid demand 30 out of 100; marketing operations centralization 58 out of 100.
- US Fertility: paid demand 55 out of 100; marketing operations centralization 16 out of 100.
- LaserAway: paid demand 78 out of 100; marketing operations centralization 70 out of 100.
- Milan Laser: paid demand 90 out of 100; marketing operations centralization 74 out of 100.
- SEV Laser: paid demand 82 out of 100; marketing operations centralization 72 out of 100.
- 4Ever Young: paid demand 76 out of 100; marketing operations centralization 55 out of 100.
- SkinSpirit: paid demand 68 out of 100; marketing operations centralization 84 out of 100.
- VIO Med Spa: paid demand 72 out of 100; marketing operations centralization 55 out of 100.
- OVME: paid demand 63 out of 100; marketing operations centralization 80 out of 100.
- Ever/Body: paid demand 55 out of 100; marketing operations centralization 78 out of 100.
- Beltone: paid demand 30 out of 100; marketing operations centralization 12 out of 100.
- HearingLife: paid demand 30 out of 100; marketing operations centralization 84 out of 100.
- Miracle-Ear: paid demand 40 out of 100; marketing operations centralization 45 out of 100.
- The Joint: paid demand 84 out of 100; marketing operations centralization 52 out of 100.
- ATI Physical Therapy: paid demand 30 out of 100; marketing operations centralization 70 out of 100.
- NovaCare: paid demand 10 out of 100; marketing operations centralization 74 out of 100.
- Select Physical Therapy: paid demand 12 out of 100; marketing operations centralization 66 out of 100.
- U.S. Physical Therapy: paid demand 10 out of 100; marketing operations centralization 12 out of 100.
- Upstream Rehabilitation: paid demand 14 out of 100; marketing operations centralization 38 out of 100.
- American Family Care: paid demand 62 out of 100; marketing operations centralization 15 out of 100.
- CityMD: paid demand 40 out of 100; marketing operations centralization 80 out of 100.
- Concentra: paid demand 6 out of 100; marketing operations centralization 72 out of 100.
- USA Vein Clinics: paid demand 64 out of 100; marketing operations centralization 84 out of 100.
- Banfield: paid demand 52 out of 100; marketing operations centralization 76 out of 100.
- Thrive Pet Healthcare: paid demand 58 out of 100; marketing operations centralization 30 out of 100.
- VCA Animal Hospitals: paid demand 50 out of 100; marketing operations centralization 72 out of 100.
- VetCor: paid demand 18 out of 100; marketing operations centralization 38 out of 100.
- MyEyeDr: paid demand 85 out of 100; marketing operations centralization 85 out of 100.
- National Vision: paid demand 45 out of 100; marketing operations centralization 68 out of 100.
Right now the dental read is a governance story, not an intensity story. Five of the seven scored DSOs sit in almost the same paid-intensity band, yet they land at opposite ends of the centralization axis.
Aspen Dental, PDS Health, and Smile Doctors run that pressure as command centers: centralized operations behind a national brand system. Sonrava Health and Smile Brands push comparable paid pressure through separate consumer brands, so the same intensity is governed practice by practice. Scale predicts neither: Heartland Dental, the largest footprint in this registry at 1,900 supported practices, sits in the quiet lower-left with SALT Dental Partners, where practices keep local identity and central paid presence stays modest.
Against the wider cohort the contrast is sharp: every scored med spa operator clusters in the command-center quadrant, while dental spreads across three of the four. That spread is why a category-average benchmark misleads here: the operating model, not the category, sets what a marketing team can centralize.
Footprints
Largest known operator footprints
Location counts come from the dated research registry and first-party public directories. They are shown to explain operating scale, not to rank quality or performance.
Implications
The measurement design follows the operating model
Model location explicitly
Media, calls, forms, appointments, and revenue need one durable facility identifier.
Separate collection from activation
Privacy-safe collection does not by itself create a governed reporting or activation layer.
Preserve local context
National rollups stay useful only when teams can drill into brand, market, service, and location.
This section describes data-design implications from the research. It is not a claim that every operator has the same stack, privacy obligations, or level of centralization.
Method
A dated public-source edition
The segment inherits the parent report method: location directories, sitemaps, booking paths, public web tags, ad transparency libraries, ownership announcements, and public operating-model evidence.
Private CRM history, sales calls, contacts, customer data, internal scoring, and recommendations are excluded. Technology detection means a signal was visible on a reviewed surface; it does not prove enterprise-wide deployment.
- Every attribution finding describes the inspected public web layer only. It cannot see internal CRM, warehouse, call-centre, or agency reconciliation, so it does not establish that an operator is unable to measure a campaign internally.
- No spend, impressions, CTR, CPA, or patient-revenue data were available. Presence does not equal performance, and an observed price change is not evidence of a controlled test.
- Technology observations describe what was visible on a reviewed surface on a stated date. They are not statements about any operator's privacy compliance, and no legal conclusion should be drawn from them.
- Hiring figures are a single-day read of public job boards. They show where roles were posted, not the size or capability of a marketing organisation.
- Offers marked as varying by location were observed only at the national default, not across every market. Google Business Profiles and per-location offer distributions were outside this audit.