



Direct answer
How should multi-location veterinary groups approach marketing?
Treat it as a multi-brand reporting problem built on local trust. Veterinary consolidators face the same multi-brand reporting mathematics as human healthcare, without HIPAA as the default explanation for integration gaps. Acquisition is shaped by hospital brands, reviews, local search, wellness plans, and emergency care - and the marketing job is national operating visibility that does not erase the neighborhood identity that creates trust.
Definitions
- Consolidator
- A group acquiring local veterinary hospitals while keeping the acquired brands live in their markets.
- Wellness plan
- A recurring preventive-care subscription that shapes acquisition and retention alongside emergency and specialty visits.
- Governed location dimension
- A reporting layer where every metric can be cut per hospital, because per-hospital economics beat a national blended average.
Findings
- Local reputation and map visibility remain primary demand assets. This edition's dated public-source review, 2026
- Acquired hospital brands persist inside increasingly centralized groups. This edition's dated public-source review, 2026
- Per-hospital economics make a governed location dimension more useful than a national blended average. This edition's dated public-source review, 2026
- 10 operators reviewed in this category, 4 company audits complete, 8 known PE-backed. Section census, live counters
Why do veterinary groups keep acquired hospital brands instead of renaming them?
Because the neighborhood identity is the demand asset: local reputation and map visibility drive acquisition, so consolidators centralize operations while the acquired brands persist in their markets.
What should a veterinary consolidator measure marketing against?
Per-hospital economics through a governed location dimension. A national blended average hides which hospitals earn their demand from reviews, local search, wellness plans, or emergency care.
Is veterinary marketing measurement easier than human healthcare?
The reporting mathematics are the same multi-brand, multi-location problem - veterinary just cannot use HIPAA as the default explanation when integrations are missing.
Executive read
Hospital brands, reviews, local search, wellness plans, and emergency care all shape acquisition. Consolidators need national operating visibility without erasing the neighborhood identity that creates trust.
Four lenses translate the public evidence into the questions a category marketer needs to answer: how demand is created, where conversion happens, where measurement breaks, and what to change.
Trust is earned locally
Reviews, maps, emergency access, and the hospital name influence choice even when media and operating systems are centralized.
Need-state changes the funnel
Wellness, routine care, urgent care, and emergency visits create different intent and response windows against the same hospital estate.
Acquired brands preserve separate histories
Hospital names, websites, phone systems, and review profiles can remain distinct long after financial reporting has consolidated.
Benchmark hospitals without erasing their context
Compare demand, capacity, reviews, and booked care at hospital level, then roll up through one governed network taxonomy.
Category evidence
Four findings worth carrying into the operating model
Banfield, VCA, VetCor, and Thrive show two operating systems: national consumer brands and federated local-hospital estates. Counts below keep their original unit and date; no parent/child brands, stores, clinics, laboratories, beds, or partner sites are silently added together.
Hospital claims and page counts are different denominators
Banfield and VCA each report 1,000+ hospitals. VetCor now reports 900+ practices and Thrive 360+ hospitals; directory pages are useful discoverability checks, not substitute facility counts.
Scale does not imply one consumer brand
Banfield and VCA lead with national identities, while VetCor explicitly preserves acquired practice brands. Reporting has to retain both network and hospital identity.
Membership changes the value of a first visit
Banfield, VCA, and Thrive all expose centralized wellness or membership paths. Attach and retention belong beside acquisition cost.
The patient and the payer are not the same entity
The care record belongs to the pet while consent, payment, membership, and repeat behavior belong to an owner or household that may have several pets.
Measurement path
The useful outcome sits beyond the lead
Unlike Dental and Med Spa, human HIPAA is not the default data boundary. Emergency need, multiple pets per household, pharmacy, and membership economics create the distinctive model.
- 01 local search, maps, reviews, referral
- 02 hospital and service page
- 03 call, booking, or triage
- 04 kept visit
- 05 diagnostic or procedure
- 06 membership, pharmacy, or refill
- 07 pet and household lifetime value
hospital × service line × need state × day
completed care and retained pet/household value
- new-client CAC
- scheduled-to-kept rate
- membership attach and retention
- hospital capacity
- pet and household LTV
Creative evidence
The category becomes legible when the real work is visible
These attributed first-party examples show how operators frame need, trust, access, and outcomes. They are editorial evidence, not a performance ranking.
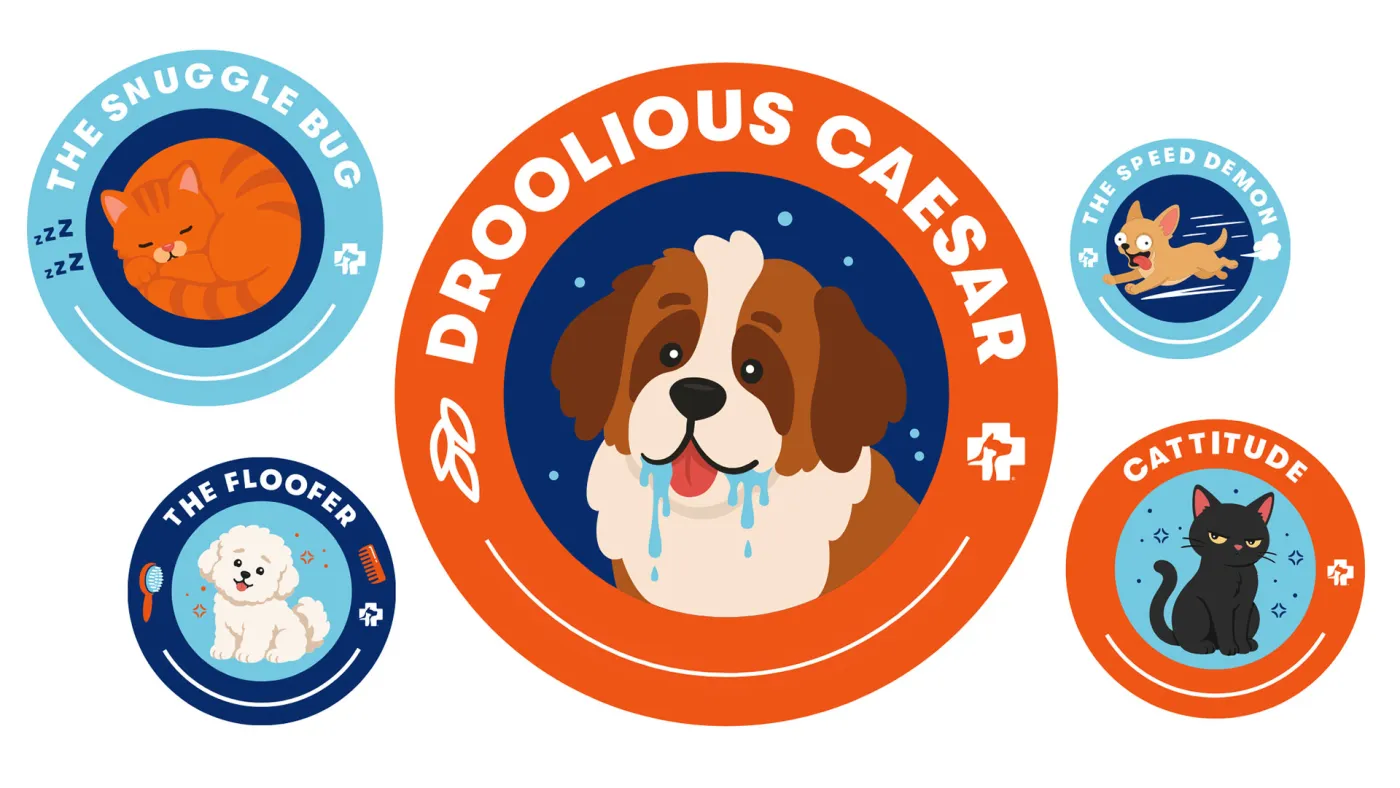
A branded character system makes preventive pet care feel approachable
The illustrated campaign turns routine care into a recognizable consumer world instead of leading with a clinical service list.
A distinctive pet portrait keeps the brand warmer than the care category
The visual system builds memory before it asks for an appointment, useful in a category where local trust matters as much as network scale.
The care routine is shown in the pet owner's world
A lived-in care moment translates a clinical recommendation into an action the owner can picture, reducing the distance between education and booking.
3 of 3 examples shown
AI adoption
Nine workflows: what AI changes, and what it still cannot fix
Veterinary groups are adopting AI in communication and practice operations, but marketing measurement still breaks across local brands, hospital systems, calls, bookings, memberships, and kept care.
A Feb. 2024 Digitail/AAHA survey found 39.2% of 3,968 veterinary professionals used AI tools in a veterinary setting. That is not a marketing-adoption rate and cannot be projected onto multi-location groups. Vendor capability is not operator adoption; every row is qualitative and source-bounded.
Creative production
Emerging Maturity basis · Verified industry evidenceVeterinary marketing platforms now offer AI-assisted content suggestions and performance analysis inside social publishing workflows.
Still manual / non-AIClinic teams still capture local photos and video, verify care claims, secure consent, protect brand voice, and manage community replies.
PetDesk documents AI-assisted suggestions alongside a human-managed veterinary marketing service; accessed Aug. 4, 2026.
Pet imagery, medical accuracy, local authenticity, and rights make unsupervised asset generation unsafe.
Message and copy generation
Emerging Maturity basis · Verified industry evidenceVeterinary guidance documents active use of language models for summaries, client education, and administrative communication.
Still manual / non-AIMedical advice, emergency language, local offers, review responses, and final publication remain human-reviewed.
AAHA describes practical veterinary uses while requiring verification and warning about privacy and fabricated answers; Apr. 2024.
A fluent draft can still contain unsafe advice, stale clinic facts, or language outside a veterinarian's approved scope.
Paid-media optimization
Widespread Maturity basis · Cross-industry proxyGoogle and Meta can automate bidding, audience expansion, placements, and creative delivery for veterinary advertisers.
Still manual / non-AINetworks still set hospital budgets, service priorities, exclusions, capacity rules, conversion definitions, and offline value feedback.
Google documents AI across bids, budgets, audiences, creative, and attribution; veterinary operator enablement is not disclosed. Accessed Aug. 4, 2026.
Platform automation cannot optimize to care value when calls, bookings, kept visits, and memberships do not share a hospital identity.
SEO and GEO
Emerging Maturity basis · Verified industry evidenceVeterinary guidance recognizes AI as a new discovery surface, while search platforms use AI to assemble answers from indexed sources.
Still manual / non-AIProvider, service, hours, emergency coverage, location pages, schema, reviews, and medical review remain operational work.
AAHA advises practices to publish distinctive, team-owned expertise as pet owners turn to AI for answers; Apr. 2024.
Acquired brands and local systems expose conflicting clinic, service, and provider facts across the web.
UTM, attribution, and data QA
Rare Maturity basis · Improvado hypothesisAI analytics can inspect naming, reconcile known identifiers, and surface anomalies, but no veterinary-network deployment was verified.
Still manual / non-AITeams still map ad accounts, local domains, phone numbers, booking tools, PIMS records, memberships, and hospital outcomes.
Improvado documents governed marketing-data analysis and anomaly detection; this is a proposed veterinary application, not observed adoption. Accessed Aug. 4, 2026.
AI cannot recover a campaign or hospital key that was never captured through the booking and care journey.
Call analysis
Emerging Maturity basis · Verified industry evidenceVeterinary phone platforms can transcribe calls and produce AI summaries inside the client communication record.
Still manual / non-AITeams still validate intent, handle emergencies, audit summaries, coach staff, call clients back, and confirm appointment outcomes.
PetDesk documents centralized calls, transcripts, and AI-powered summaries for veterinary practices; Feb. 9, 2026.
Recording consent, emergency language, local PIMS identity, and the missing join to kept care constrain autonomous analysis.
Lead routing and CRM
Emerging Maturity basis · Verified industry evidenceVeterinary AI reception tools can interpret routine intent and support client communication, scheduling, and message routing.
Still manual / non-AISpecies, service, urgency, specialty fit, hospital availability, duplicate clients, and clinical triage remain governed workflows.
VetPartners identifies AI reception, scheduling, messaging, and client management as current veterinary efficiency uses; accessed Aug. 4, 2026.
Local autonomy and heterogeneous PIMS rules make a single probabilistic routing policy unsafe.
Scheduling and patient engagement
Emerging Maturity basis · Operator exampleVeterinary networks are deploying direct booking, reminders, two-way messaging, and AI-assisted communication in the same client-engagement stack.
Still manual / non-AIHospitals still configure appointment types, surgery and specialty constraints, emergency escalation, callbacks, and schedule exceptions.
PetDesk provides a VetCor-specific onboarding surface for direct booking, communications, phones, and AI Scribe; accessed Aug. 4, 2026. Feature availability is not fleet-wide use proof.
Booking rules vary by hospital, provider, species, service, duration, and clinical urgency.
Compliance and privacy
Rare Maturity basis · Verified industry evidenceAI can assist with redaction and policy checks, but no autonomous veterinary marketing-compliance deployment was verified.
Still manual / non-AIPractices still own consent, state confidentiality duties, vendor terms, financial-data security, retention, and incident response.
The guidance says veterinary practices are generally outside HIPAA but still owe client confidentiality and data-security duties; accessed Aug. 4, 2026.
State rules, consent, model training terms, and client financial data create a fragmented governance boundary.
Operator map
Where veterinary operators sit
Highlighted companies have enough dated public evidence for both directional scores. The full cohort stays in the background for market context.
Where public demand intensity meets marketing-operations centralization
Directional scores synthesize dated public ad-library, website, tag-layer, and operating-model evidence. They are not spend, revenue, or vendor-performance scores, and not published rubric composites; positions are directional synthesis.
- Aspen Dental: paid demand 70 out of 100; marketing operations centralization 88 out of 100.
- Heartland Dental: paid demand 45 out of 100; marketing operations centralization 22 out of 100.
- PDS Health: paid demand 72 out of 100; marketing operations centralization 92 out of 100.
- SALT Dental Partners: paid demand 22 out of 100; marketing operations centralization 15 out of 100.
- Smile Brands: paid demand 68 out of 100; marketing operations centralization 20 out of 100.
- Smile Doctors: paid demand 72 out of 100; marketing operations centralization 62 out of 100.
- Sonrava Health: paid demand 68 out of 100; marketing operations centralization 34 out of 100.
- Forefront Dermatology: paid demand 26 out of 100; marketing operations centralization 86 out of 100.
- QualDerm Partners: paid demand 30 out of 100; marketing operations centralization 58 out of 100.
- US Fertility: paid demand 55 out of 100; marketing operations centralization 16 out of 100.
- LaserAway: paid demand 78 out of 100; marketing operations centralization 70 out of 100.
- Milan Laser: paid demand 90 out of 100; marketing operations centralization 74 out of 100.
- SEV Laser: paid demand 82 out of 100; marketing operations centralization 72 out of 100.
- 4Ever Young: paid demand 76 out of 100; marketing operations centralization 55 out of 100.
- SkinSpirit: paid demand 68 out of 100; marketing operations centralization 84 out of 100.
- VIO Med Spa: paid demand 72 out of 100; marketing operations centralization 55 out of 100.
- OVME: paid demand 63 out of 100; marketing operations centralization 80 out of 100.
- Ever/Body: paid demand 55 out of 100; marketing operations centralization 78 out of 100.
- Beltone: paid demand 30 out of 100; marketing operations centralization 12 out of 100.
- HearingLife: paid demand 30 out of 100; marketing operations centralization 84 out of 100.
- Miracle-Ear: paid demand 40 out of 100; marketing operations centralization 45 out of 100.
- The Joint: paid demand 84 out of 100; marketing operations centralization 52 out of 100.
- ATI Physical Therapy: paid demand 30 out of 100; marketing operations centralization 70 out of 100.
- NovaCare: paid demand 10 out of 100; marketing operations centralization 74 out of 100.
- Select Physical Therapy: paid demand 12 out of 100; marketing operations centralization 66 out of 100.
- U.S. Physical Therapy: paid demand 10 out of 100; marketing operations centralization 12 out of 100.
- Upstream Rehabilitation: paid demand 14 out of 100; marketing operations centralization 38 out of 100.
- American Family Care: paid demand 62 out of 100; marketing operations centralization 15 out of 100.
- CityMD: paid demand 40 out of 100; marketing operations centralization 80 out of 100.
- Concentra: paid demand 6 out of 100; marketing operations centralization 72 out of 100.
- USA Vein Clinics: paid demand 64 out of 100; marketing operations centralization 84 out of 100.
- Banfield: paid demand 52 out of 100; marketing operations centralization 76 out of 100.
- Thrive Pet Healthcare: paid demand 58 out of 100; marketing operations centralization 30 out of 100.
- VCA Animal Hospitals: paid demand 50 out of 100; marketing operations centralization 72 out of 100.
- VetCor: paid demand 18 out of 100; marketing operations centralization 38 out of 100.
- MyEyeDr: paid demand 85 out of 100; marketing operations centralization 85 out of 100.
- National Vision: paid demand 45 out of 100; marketing operations centralization 68 out of 100.
Footprints
Largest known operator footprints
Location counts come from the dated research registry and first-party public directories. They are shown to explain operating scale, not to rank quality or performance.
Implications
The measurement design follows the operating model
Model location explicitly
Media, calls, forms, appointments, and revenue need one durable facility identifier.
Separate collection from activation
Privacy-safe collection does not by itself create a governed reporting or activation layer.
Preserve local context
National rollups stay useful only when teams can drill into brand, market, service, and location.
This section describes data-design implications from the research. It is not a claim that every operator has the same stack, privacy obligations, or level of centralization.
Method
A dated public-source edition
The segment inherits the parent report method: location directories, sitemaps, booking paths, public web tags, ad transparency libraries, ownership announcements, and public operating-model evidence.
Private CRM history, sales calls, contacts, customer data, internal scoring, and recommendations are excluded. Technology detection means a signal was visible on a reviewed surface; it does not prove enterprise-wide deployment.
- The four audited groups are a selected operating-model sample, not the veterinary market.
- A location-directory page is not automatically an open hospital.
- Public pages cannot reveal practice-management, pharmacy, call-center, or financial reconciliation.
4 primary sources in this category synthesis
- Banfield — About First-party hospital, veterinarian, and wellness-plan context; accessed August 4, 2026. ↗
- VCA — CareClub First-party membership journey and local-hospital routing; accessed August 4, 2026. ↗
- VetCor — Join us First-party local-brand preservation and 900+ practice claim; accessed August 4, 2026. ↗
- Thrive — Membership First-party 360+ hospital and membership evidence; accessed August 4, 2026. ↗