Data tables
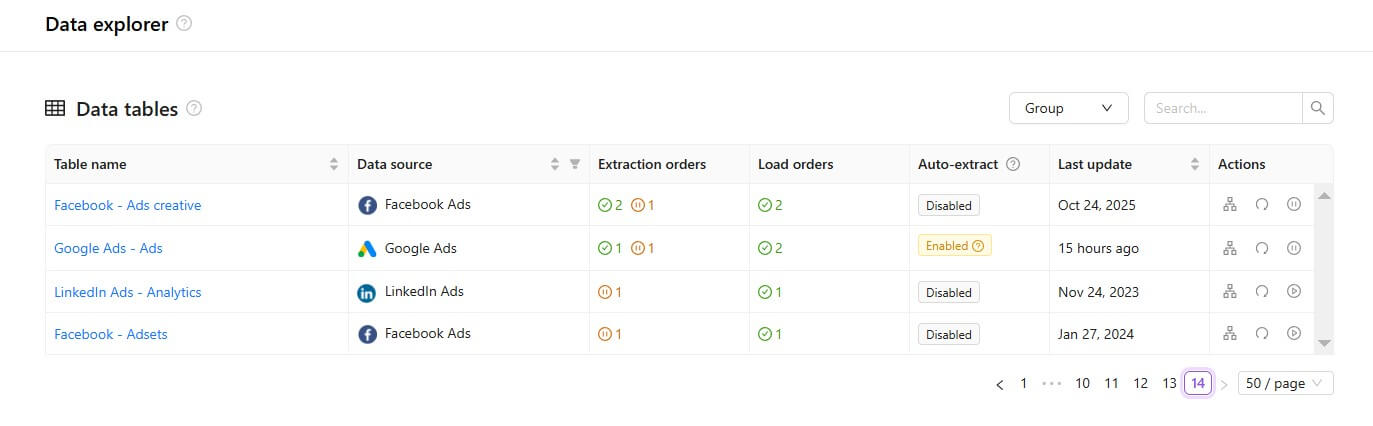
Select the Data Explorer item in the left menu to see your data tables list, their connected data source, and the number of extraction orders with the same granularity.
Use the search field to find the necessary data table. It works for table names only, not for a data source or anything else.
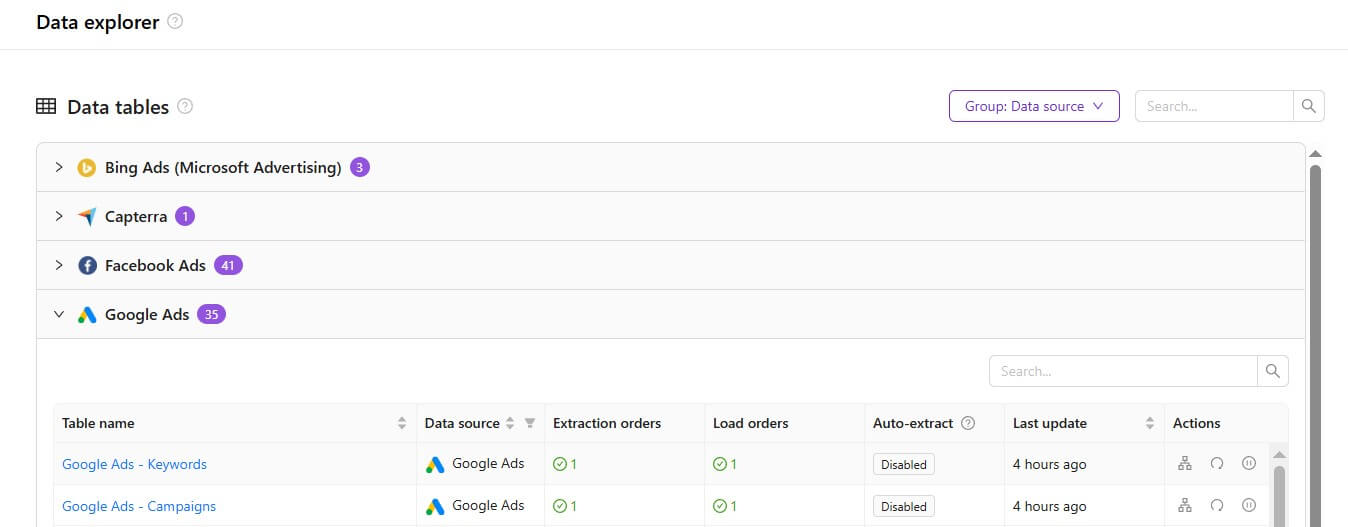
Grouped view
The Group option allow you to organize data tables by data source, making it easier to manage and navigate large sets of items.
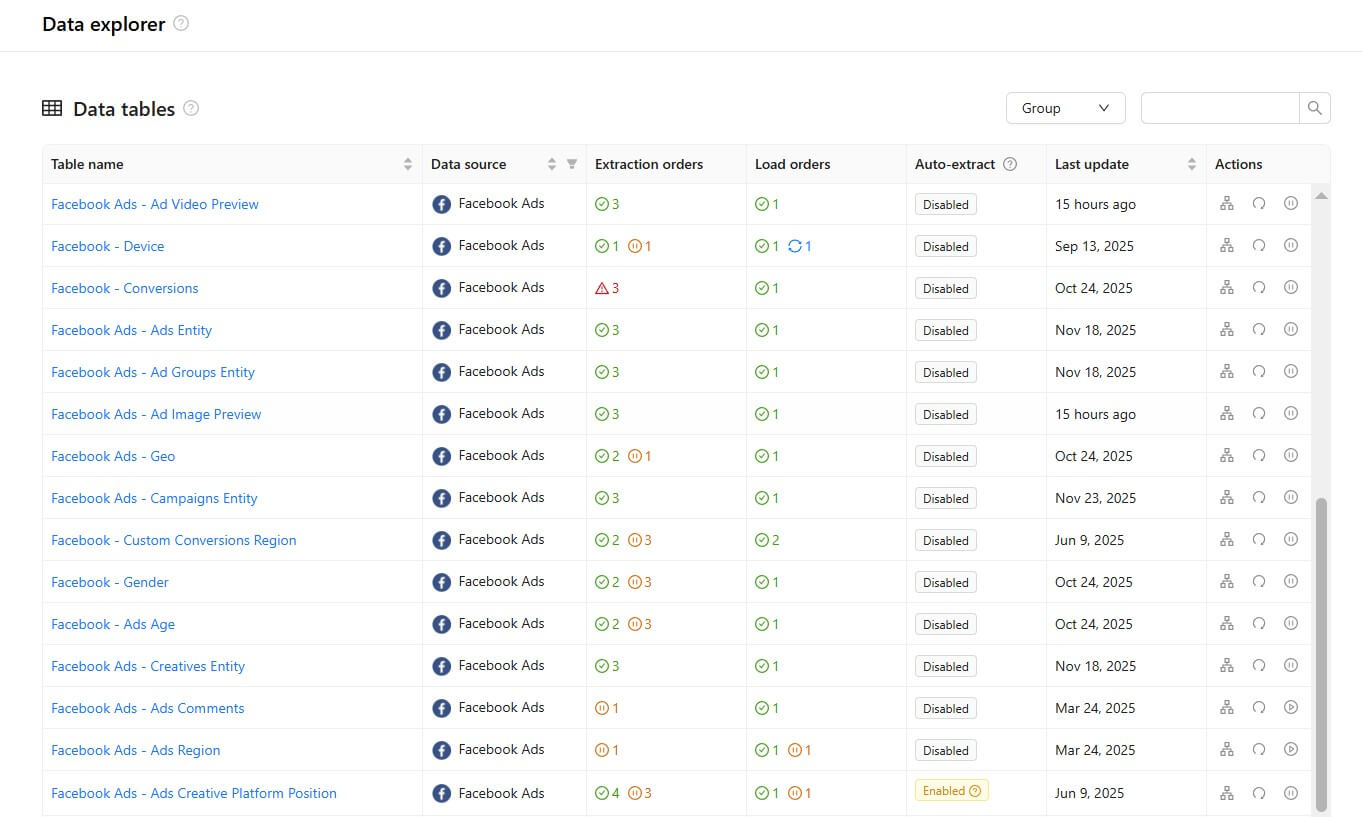
The data tables list contains seven columns. Let's look at each of them in more detail.
Table name
The data table name is formed by Data Source — Extraction Template rule. You can click on it to dive into the data tale settings and see the related extraction orders list.
Data source
This column shows the provider name for which this data table was created.
Extraction orders
This column shows how many extraction orders relate to this table by the granularity and the number of orders for each of these four statuses:
- data is synced
- pause
- error
- data is syncing
If there is no extraction orders in a certain status, then this status is not shown in User Interface.
Load orders
This column shows how many load orders relate to this table by the granularity and the number of orders for each of these four statuses:
- data is loaded
- pause
- error
- data is loading
If there are no load orders in a certain status, then this status is not shown in the User Interface.
Auto-extract
This column indicates whether automatic extraction of new accounts using the selected template is enabled or disabled for this data table.
Last updated
Here you can see when the last data sync was completed.
Actions
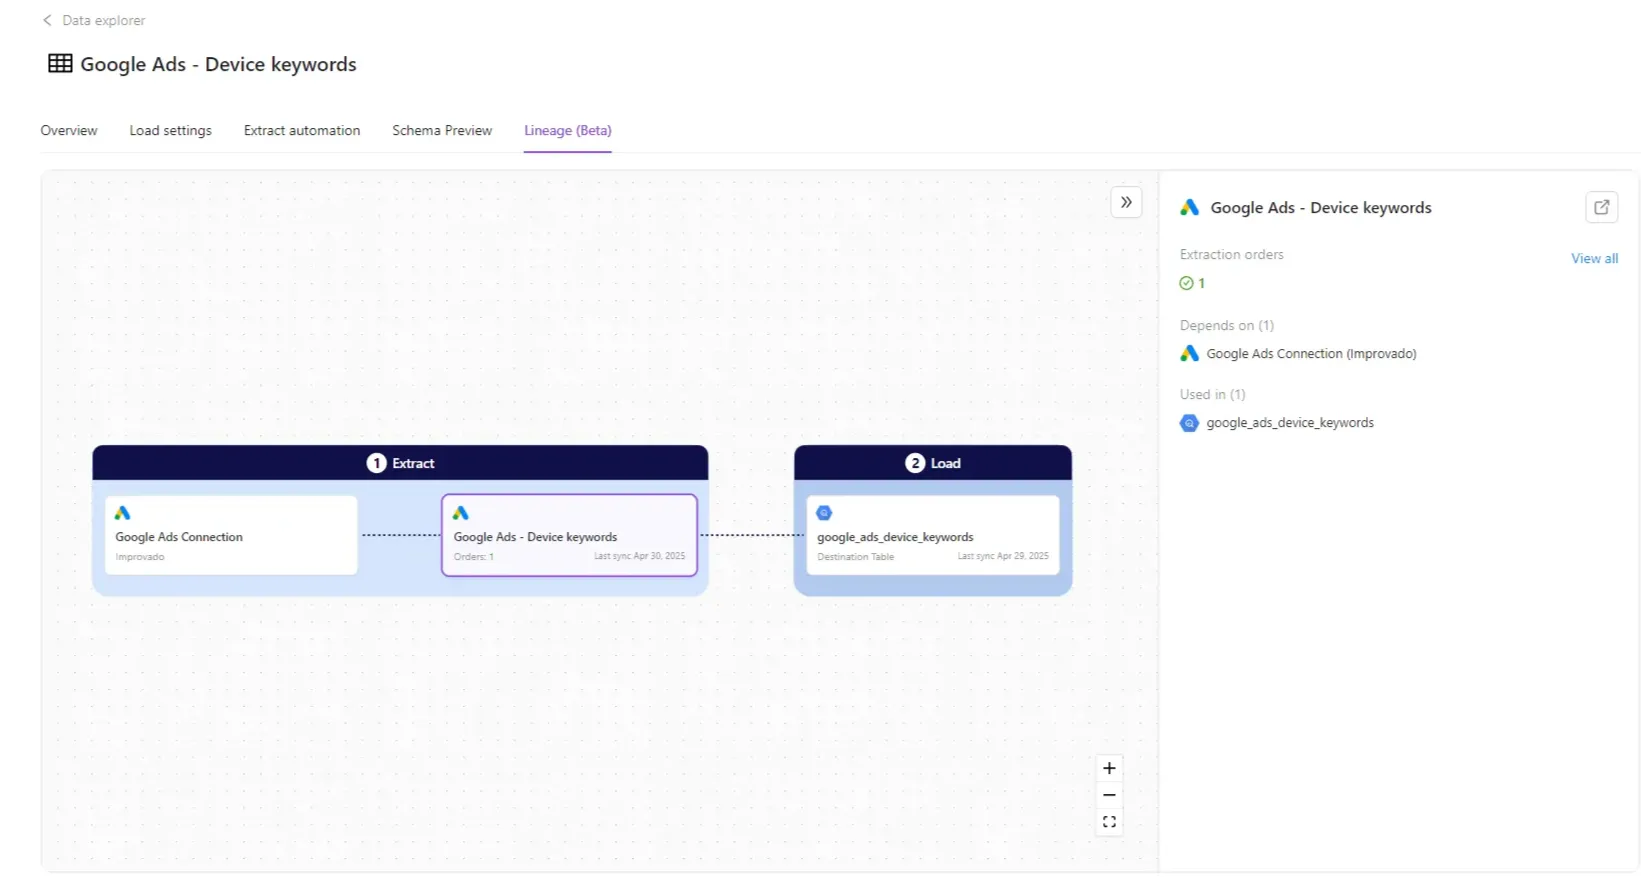
View Lineage
Click to see a visual map of your data’s journey through the pipeline.
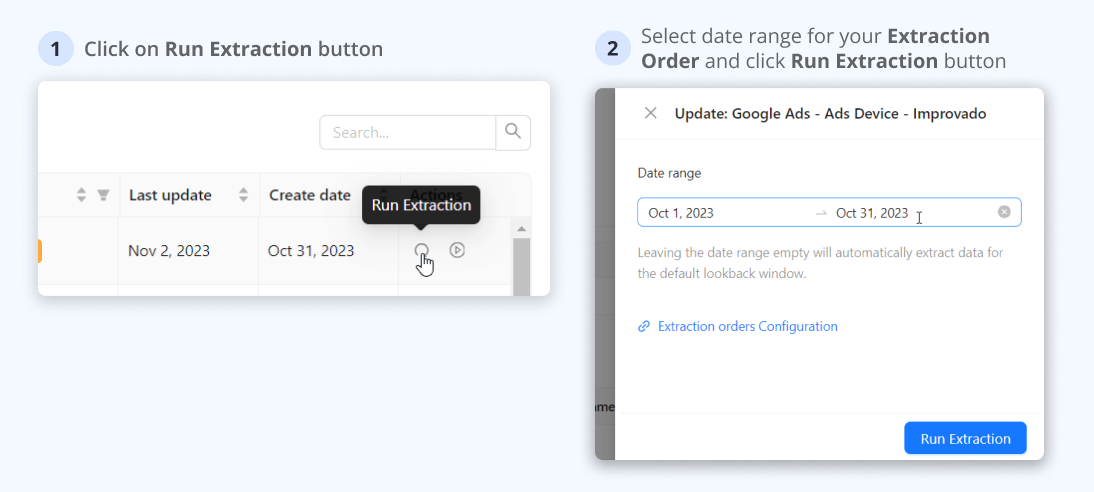
Run Extraction button
Click this button to run the Extraction order for the selected date range.
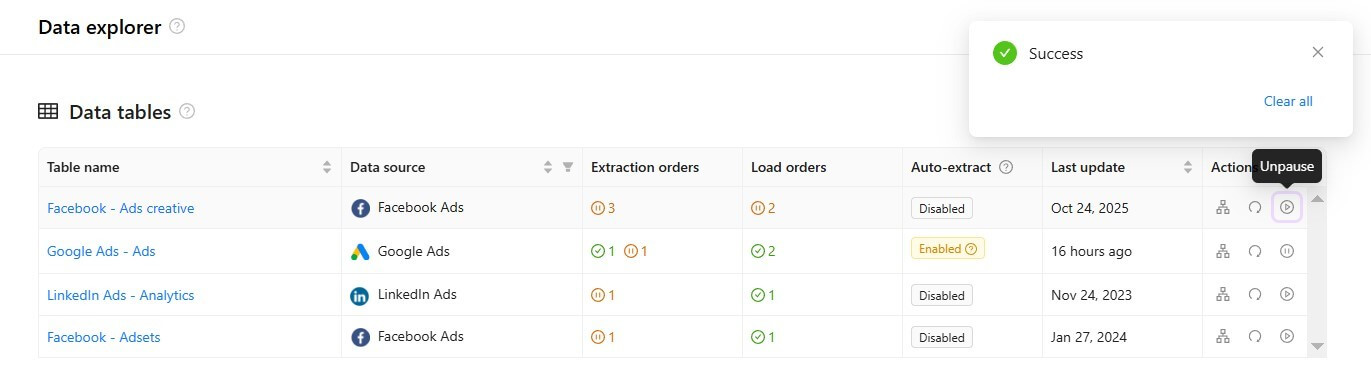
Pause
The "pause" icon in this column allows you to pause all extraction and load orders inside a particular data table.
The Success message means that you have successfully paused all extraction and load orders related to the data table.

After this, you will see the "unpause" icon instead of "pause". It allows you to start all extraction and load orders related to the data table at once.