2021 was a year of great changes and new findings for all industries across the globe. Trends caused by COVID-19 are gradually retreating, and businesses are starting to recover from the impact of the pandemic.
🚀Our previous report shows how COVID-19 influenced the ad spend across industries.🚀
Still, some niches are experiencing major trouble. For example, the retail and ecommerce industries suffered heavy losses because of a shipping crisis. Computer hardware manufacturers are also failing to meet the needs of the market because of chip shortages. US companies have less than a five-day supply of semiconductors.
We’ve kept our finger on the pulse of each industry to share how this year influenced the ad spend of companies across different regions and industries. In this report, you’ll find charts showcasing all ad spend trends and our thoughts on the situation. Let’s get started!
Background for the report
At Improvado, we are acutely aware of the digital marketing processes in place across all industries.
Marketing data is our main priority, and our data analysts processed large volumes of it to conduct a thorough analysis of global advertising spend in the current market.
We’ve analyzed digital advertising spend across 30,000 US-based companies, 42,000 British companies, and 45,000 EU companies. Our data is broken down into 145 industries, so we can deliver insightful information on every niche.
Share of digital advertising spend by industry
Year-over-year comparison
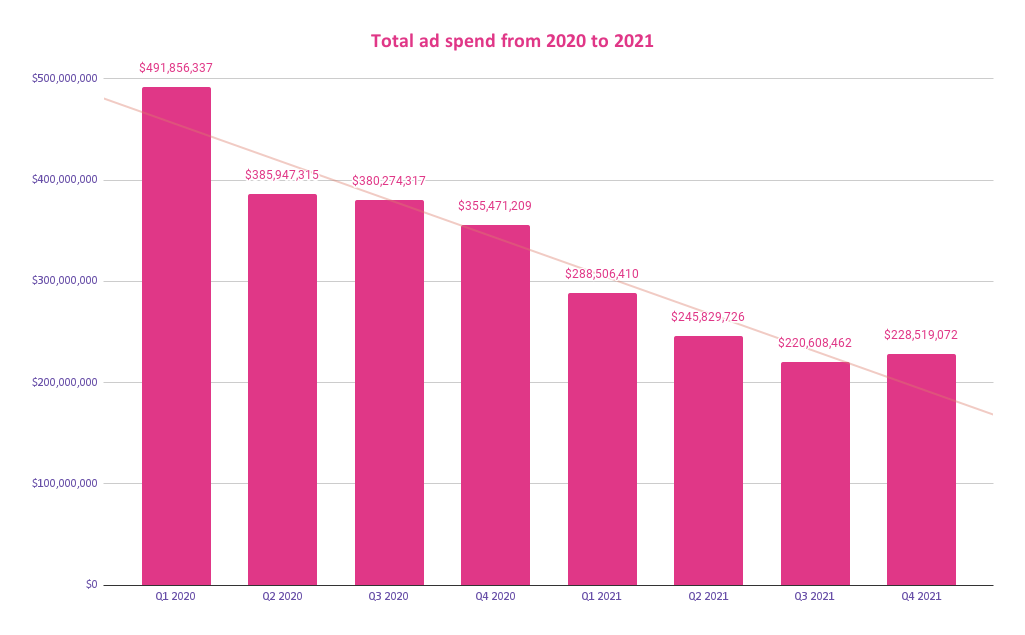
The total global digital ad spend in 2021 decreased by around 21%.
This suggests that the majority of industries are now getting back on their feet after the pandemic and are spending less on advertising.
In addition, consumer spending is progressively stabilizing, resulting in an increased demand for goods and services and a lower requirement for advertising to attract those customers.
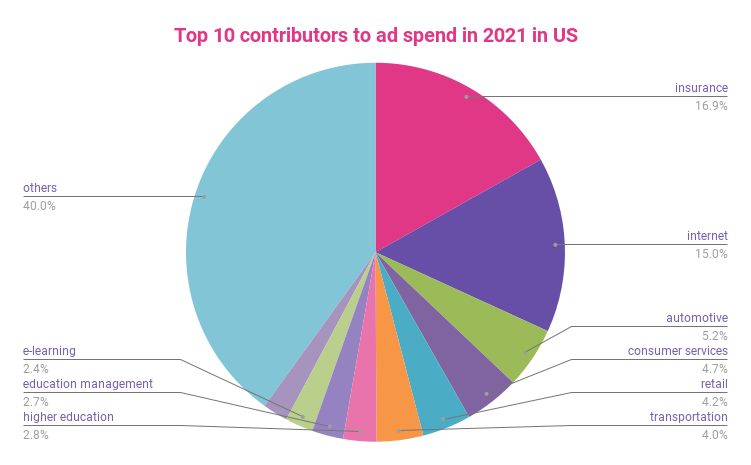
The top 10 industries that contributed the most to global digital ad spend in 2021 were:
- Internet providers
- Insurance
- Automotive
- Consumer services
- Retail
- Leisure, tourism, and travel
- Transportation
- Higher education
- Education management
- E-learning
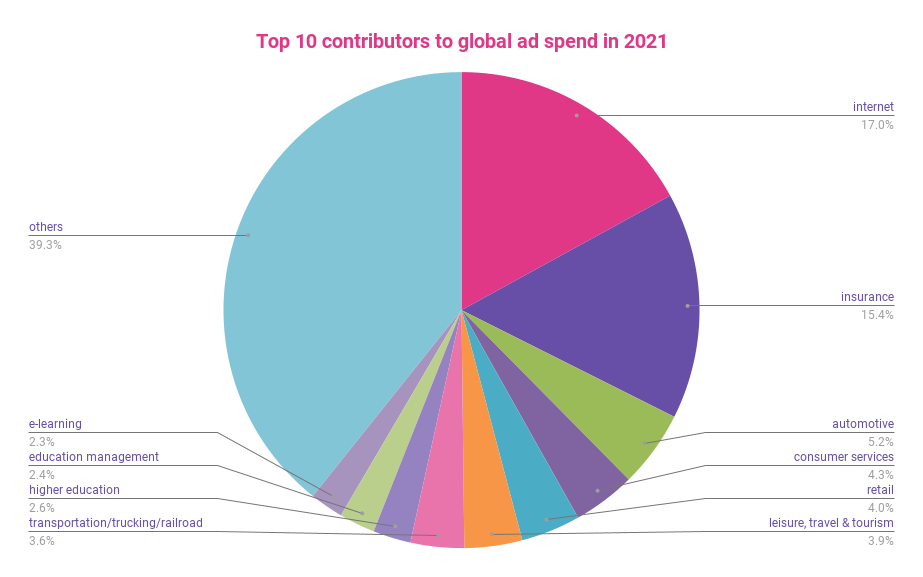
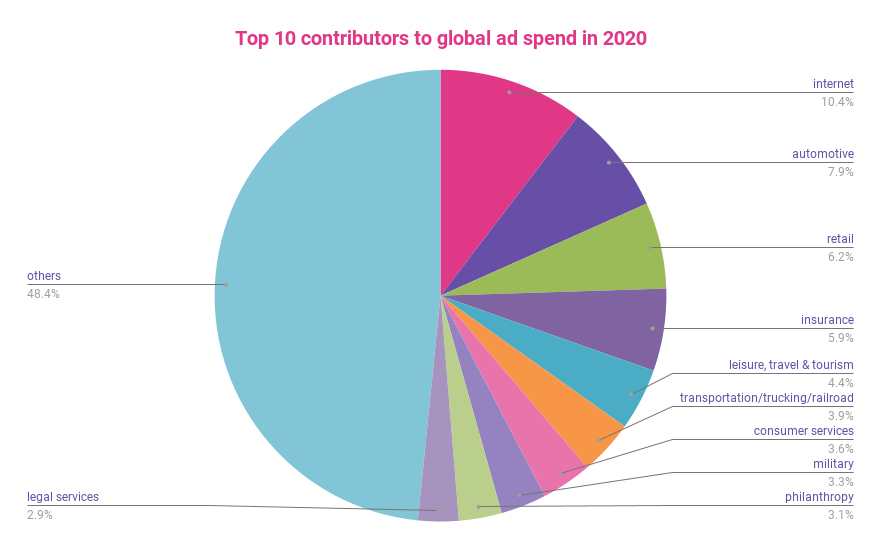
The main contributors mostly remained the same as in the year 2020. However, the military, philanthropy, and legal services industries experienced a decrease in ad spend in 2021.
In contrast, here are the top spenders of 2020.
Quarter-over-quarter comparison
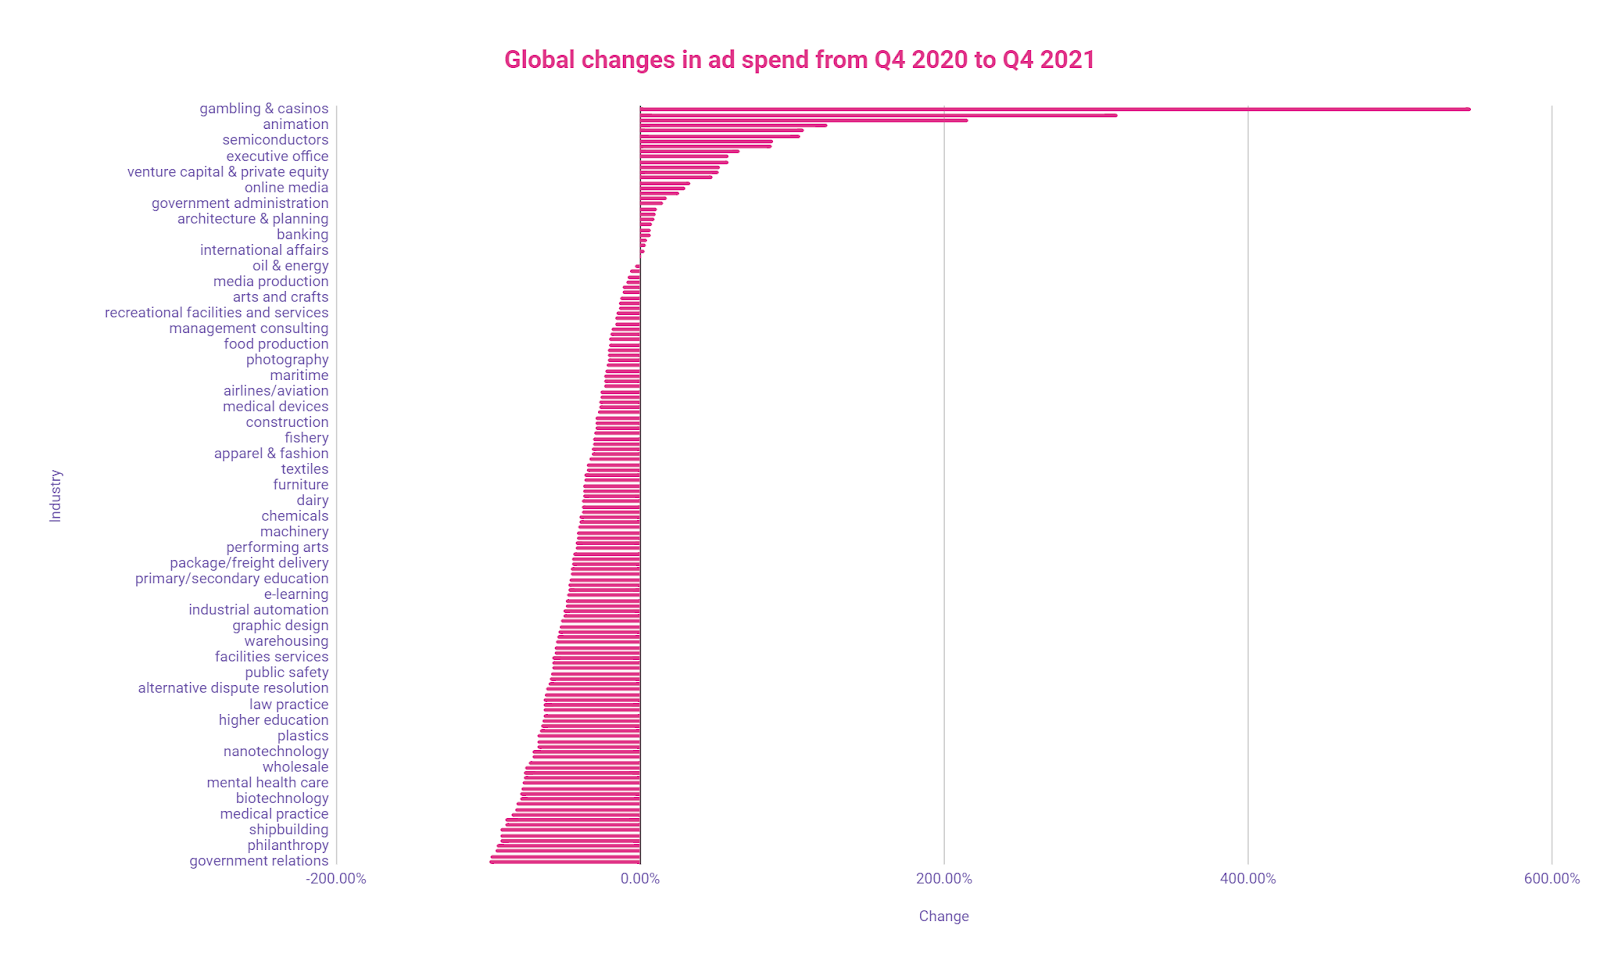
Here, you can see the difference in ad spend for each industry between Q4 2020 and Q4 2021.
Internet industry digital ad spend
From Q1 2020, Internet providers steadily decreased their digital advertising spend. This trend continued until Q2 2021, when the charts turned around and spending started to rise again. Q4 2021 saw the largest spike for this industry. At $57,750,153, this quarter set a new record since Q1 2020.
This amazing growth of 47.5% may be caused by the rapid development of 5G. Internet providers invested their efforts into migrating their users from 4G to a new generation of cellular technologies.

This technology requires significant financial investment to set up new mobile towers.
Unfortunately, 5G constantly runs into resistance from regular users and legal issues with governments, so it’s no wonder providers are pushing hard to get their investments back.
Insurance industry digital ad spend
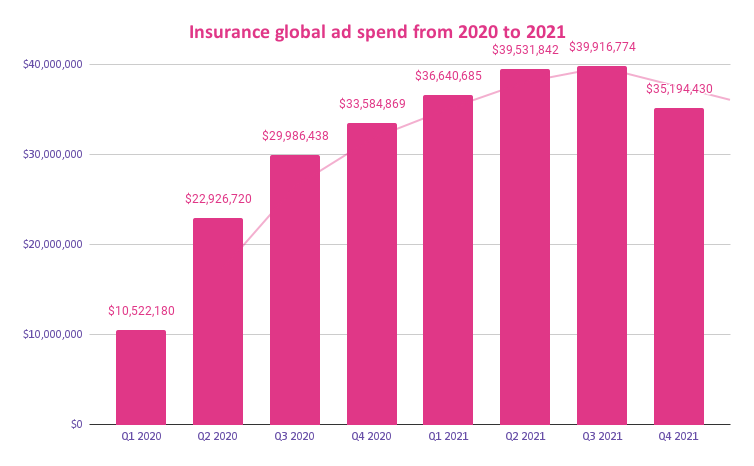
Since Q1 2020, insurance companies have been increasing their digital advertising spend at a dramatic pace.
From Q1 2020 to Q3 2021, insurance companies’ digital marketing spend increased by almost 400% and peaked at $39,916,774 in Q3 2021.
However, in Q4 2021, the trendline suddenly turned around. Companies reduced their advertising expenses, returning to the level of Q4 2020.
The sudden turnaround may be caused by a poor Q4 for some of the largest insurance companies.
For example, Progressive, the largest auto insurer in the United States, experienced a 40% net income drop compared to the same period in the last year.
AXIS Capital, an insurance and reinsurance provider, had a much more successful Q4. But the company still suffered weather-related losses due to Hurricane Ida, July’s European floods, and winter storms Uri and Viola.
Transportation/trucking/railroad industry digital ad spend
The transportation industry gradually reduced its investment in digital ad spend from the beginning of the pandemic.
In Q2 2020, the total digital ad spend for the industry was $18,303,514. In Q4 2021, this indicator dropped to a seven-figure number of $7,202,254.
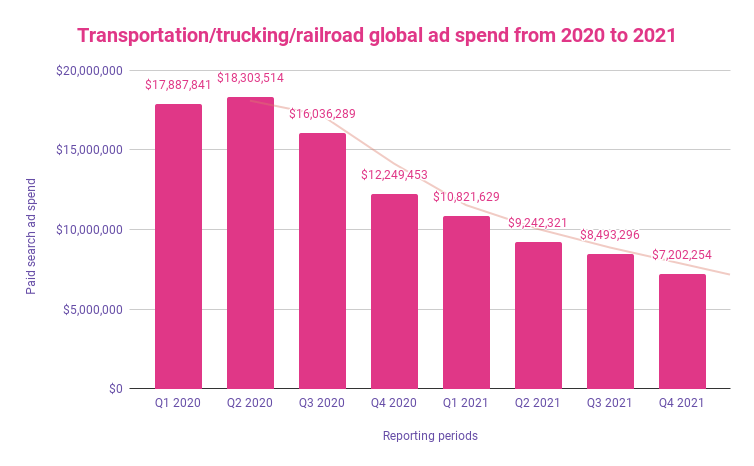
In percentage terms, companies in this industry reduced their ad spend by 60.7%, due in large part to a raging global shipping crisis. In 2021, the average price for a 10,000-foot container was approximately $10,000. That reflects a 323% increase in just a year. With so much demand, transportation companies don’t need to invest in advertising because they make the rules now.
Unfortunately, the crisis is expected to continue in 2022. In mid-December 2021, container prices were 170% higher compared to the prices just a year ago.
Automotive industry digital ad spend
The pandemic had a devastating impact on the automotive industry. According to Statista, in March 2020, US vehicle sales were down 38% year-on-year.
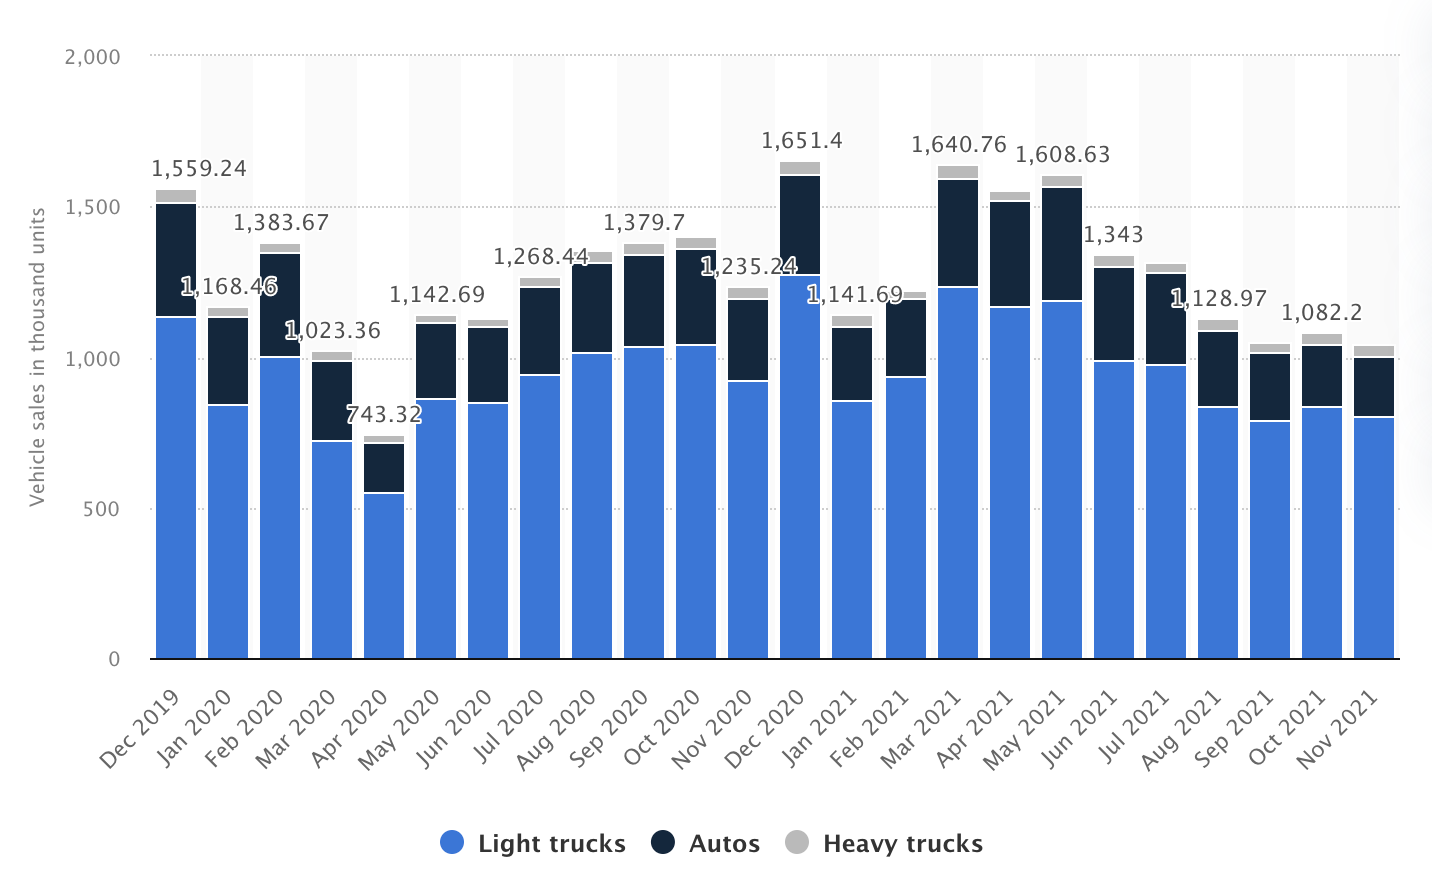
Low vehicle sales and the ineffectiveness of out-of-home advertising prompted companies to invest more in digital ads.
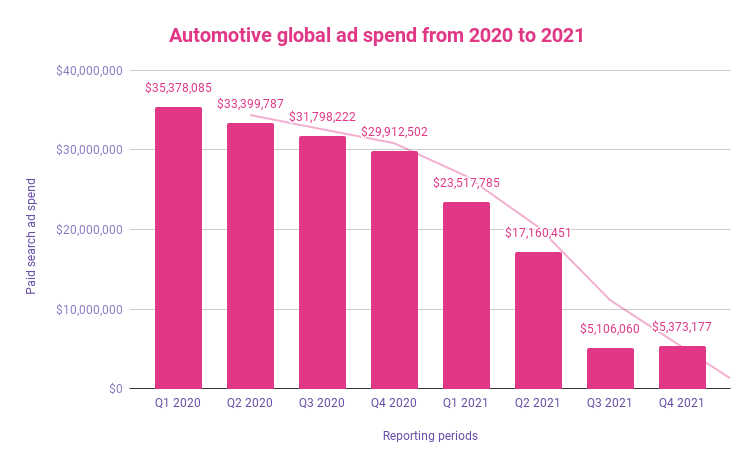
In Q1 2020, automotive companies spent $35,378,085 on digital ads to keep sales rates afloat. However, with the emergence of stay-at-home orders and partial stabilization of the global situation, digital marketing spend shrank.
The total digital ad spend dropped to $5,373,177 in Q4 2021, which is only 15.8% of the average spend in Q1 2020.
Educational industry digital ad spend
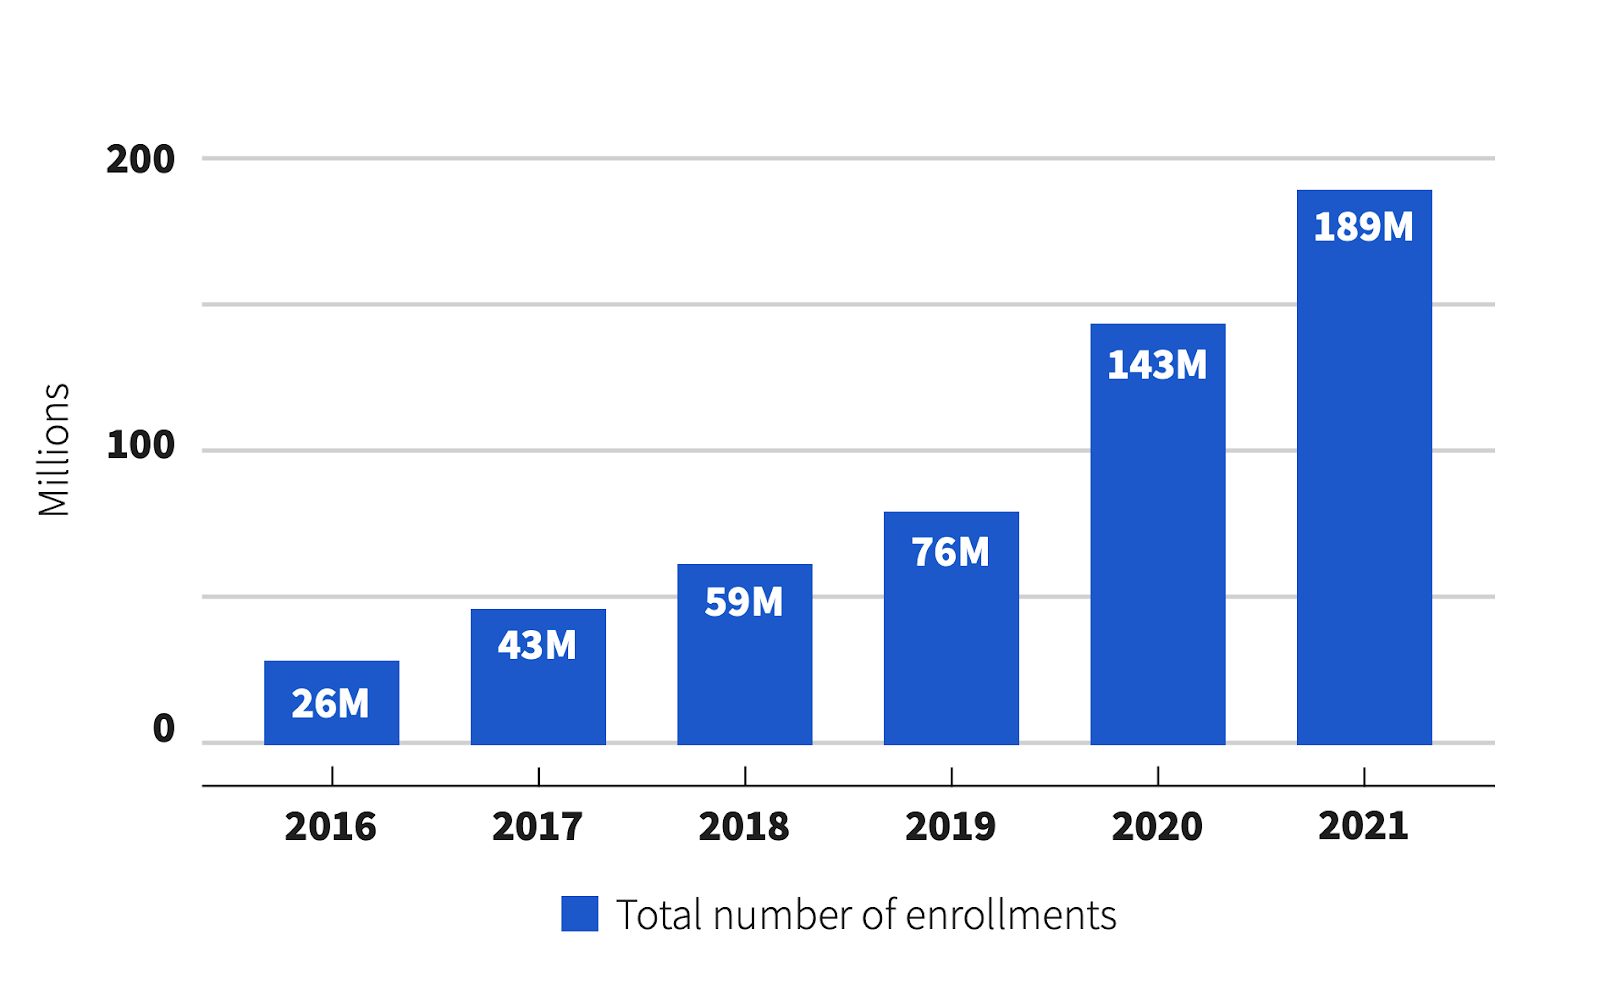
Higher education marketing campaigns are in tight competition with e-learning platforms and alternative education solutions like homeschool math tutoring. This is no surprise because e-learning services became highly popular during the pandemic. According to the recent Impact Report by Coursera, the platform had a total of 189 million enrollments in 2021 with a 32% year-over-year growth.
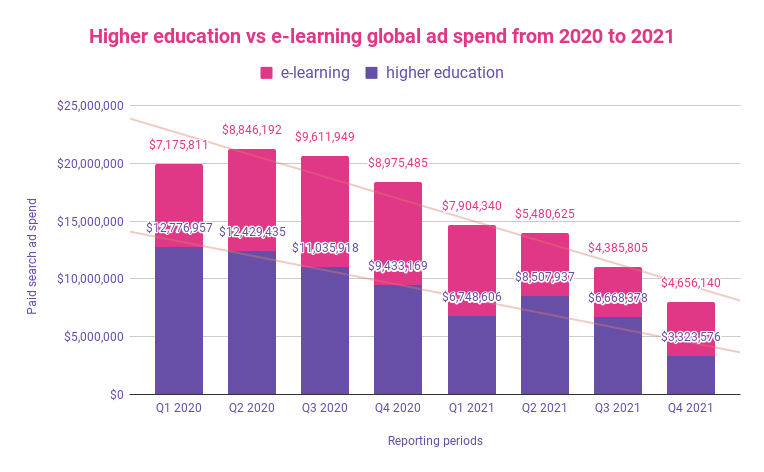
On the other hand, due to the global pandemic and increase in remote learning, higher education establishments significantly increased their marketing investments in 2020 to attract new students.
Explore how University of San Francisco increased enrollment rate with granular marketing insights from Improvado
This trend held steady until Q4 2020.
Right now, both e-learning platforms and higher education establishments have reduced their spending on ads. In Q4 of 2021, e-learning services invested 39% more than higher education institutions and ended the year with a total digital marketing spend of $4,656,140.
Retail industry digital ad spend
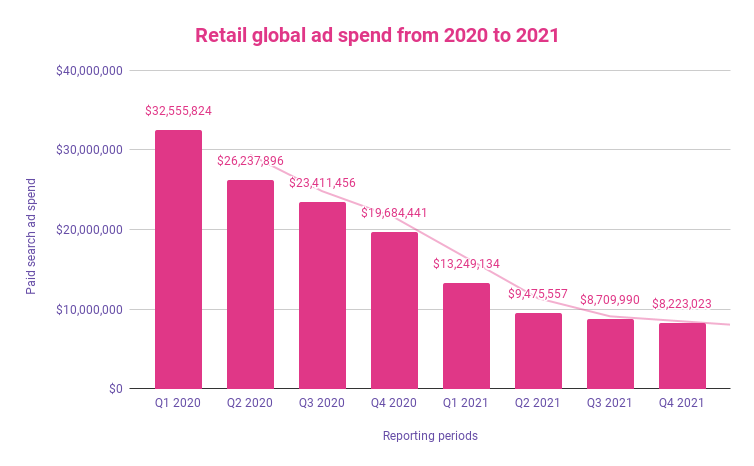
The retail industry fell backward significantly in terms of digital advertising spend. At the beginning of 2020, the total ad spend in the industry was $32,555,824. In Q4 of 2021, this sum was reduced by four times, reaching just $8,223,023.
However, this may also be caused by new privacy updates. Companies have noted a significant increase in customer acquisition costs ia paid ads. New privacy policies also make it harder to set the attribution correctly and understand where exactly leads come from. This leaves them with no other choice but to search for new marketing channels and adopt cookieless tracking.
🚀Read this article to stay on top of upcoming 2023 trends in e-commerce and retail industries.🚀
Consumer services industry digital ad spend
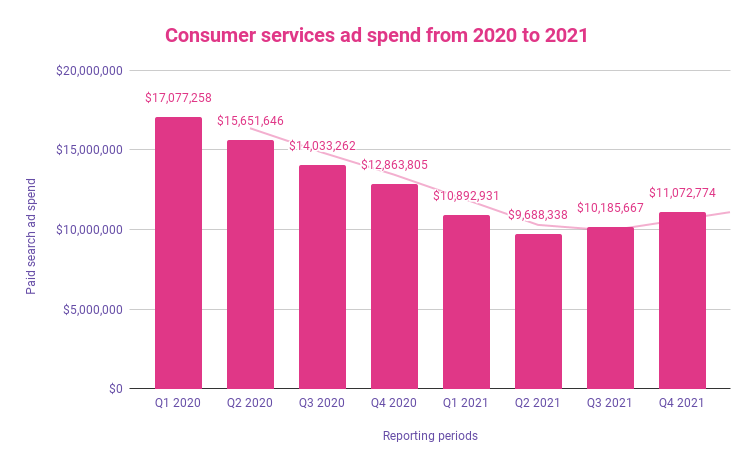
Ad spend in consumer services has changed significantly since the beginning of Q1 2020. When the pandemic disrupted the industry, the total ad spend was $17,077,258. This decreased over time, but in Q3 2021, companies started investing more in advertising.
In Q4 2021, the industry’s ad spend reached $11,072,774, growing at a rate of 5-7% each quarter from its lowest point.
Digital ad spend by region
In this section, we’re going to cover digital advertising spending across different regions. We’ve gathered and compared statistics from three regions:
- United States
- United Kingdom
- European Union
Let’s identify the differences in ad spend between these three regions.
The United States
During our research, we identified several characteristics for the US. In Q4 2021, the total amount invested into digital ad spend across all industries was $203,528,469.
The main contributors to the US ad spend are basically the same as in other parts of the world, except for a couple of industries like printing, education management, and philanthropy.
Comparing the ad spend of 2021 with that of 2020, we can see that the trends have changed significantly.
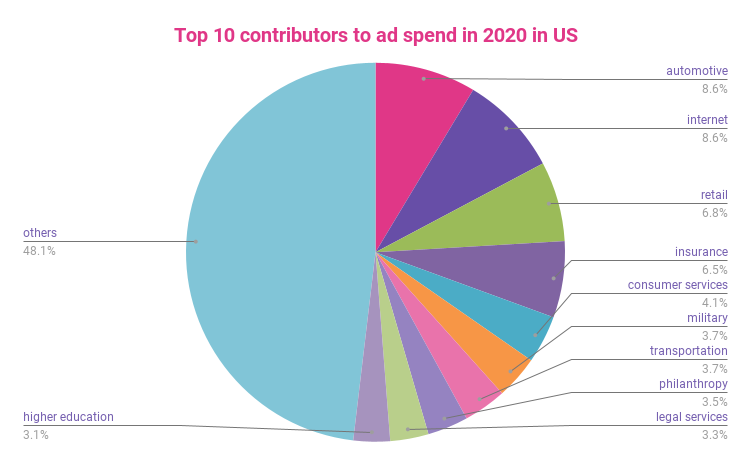
The military, philanthropy, and legal services niches were completely pushed out of the top 10 in 2020. Meanwhile, the Internet and insurance industries have almost doubled their marketing spend and now dominate the top positions in US ad spend.
Americans now tend to gamble less
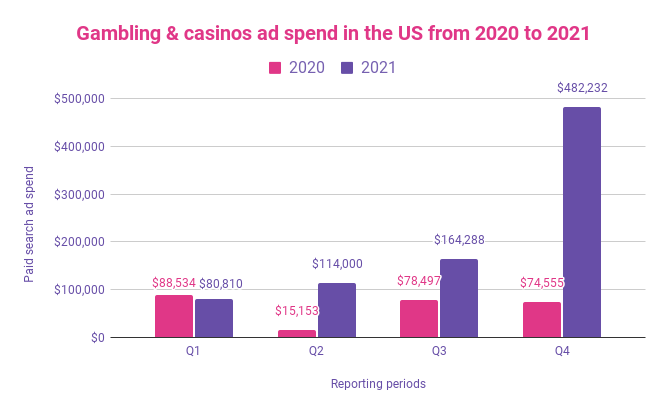
The casino and online gambling industry’s marketing spend surged in Q4 2021. Compared to Q4 2020, the ad spend increased by 547%, increasing from $74,855 in Q4 2020 to $482,232 Q4 2021.
Such growth may be a result of two different factors.
The first one is that the industry is recovering from the impact of COVID-19 and is trying to engage more clients.
The second is that Americans may have reassessed their priorities and may have started to spend their money more responsibly during the pandemic. Thus, casinos and gambling companies must invest more heavily in advertising to attract customers.
The food and beverage industry is on the rise
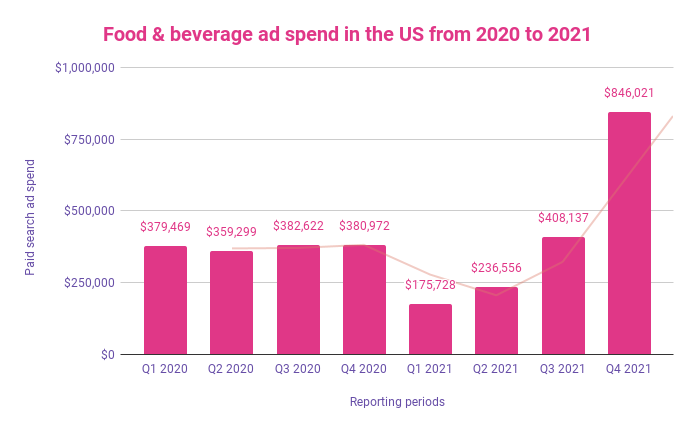
US-based food and beverage companies finally increased their ad spend after a long stagnation period. In Q4 2021, the industry’s digital ad spend reached $846,021, which is 2.2 times more than in Q4 2020.
However, this industry’s paid ad spend grew only in the US. In the EU and the UK, the trendline has steadily fallen since Q4 2020.
Commercial real estate companies actively search for new clients
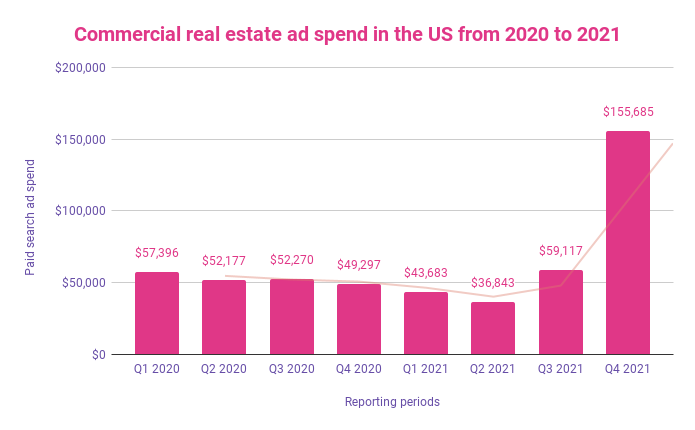
According to this commercial real estate marketing guide, the commercial real estate sector in the US significantly increased its digital ad spend by the end of 2021.
Throughout 2020 and 2021, the ad spend fluctuated between $60,000 and $40,000 per quarter. However, everything changed in Q4 2021, when the ad spend spiked, increasing by nearly 2.2 times, reaching $155,685 at the end of the year.
Animation companies spend more to lure viewers to cinemas
Ad spend in the animation industry drastically increased at the end of 2021. In Q4 2021, digital ad spend reached $280,414. That’s a 220% increase compared to Q4 2020.
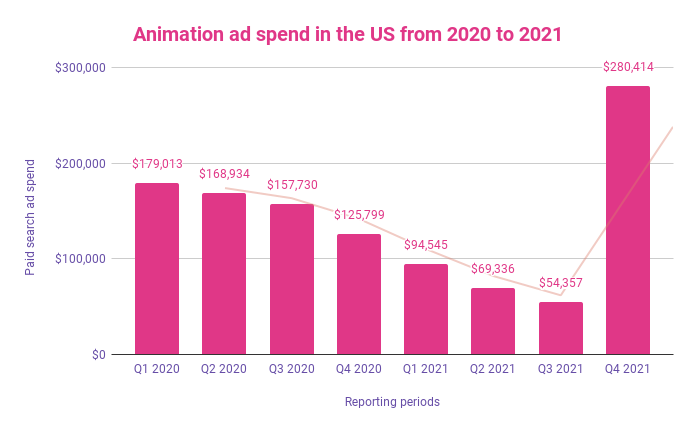
2021 was a year packed full of successful projects for this industry, including movies like “Raya and the Last Dragon” and “The Mitchells vs the Machines”. These and other movies had large marketing budgets that stimulated the overall growth of the industry’s ad spend.
United Kingdom
The United Kingdom’s largest contributors to the country’s ad spend are slightly different from those in the US.
Here’s what UK ad spend looked like in 2020.
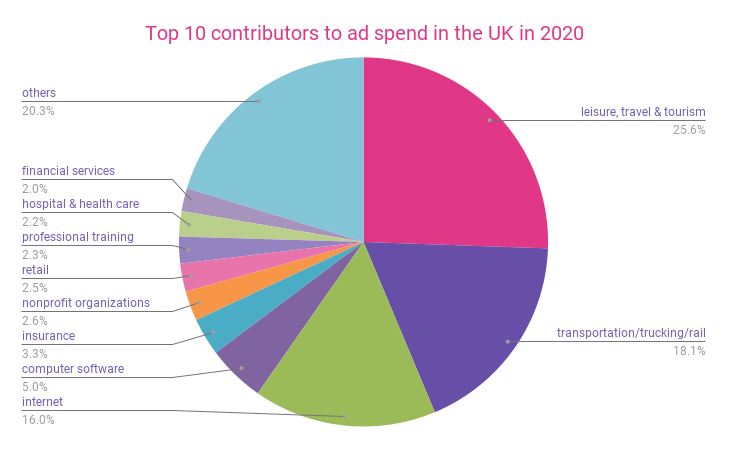
The above chart shows that leisure, travel & tourism companies desperately tried to keep afloat by increasing their marketing budgets. The transportation industry also had high hopes for marketing endeavors as passenger traffic dropped to critical levels.
In 2021, however, the situation changed. Here’s what the chart looked like at the end of 2021.
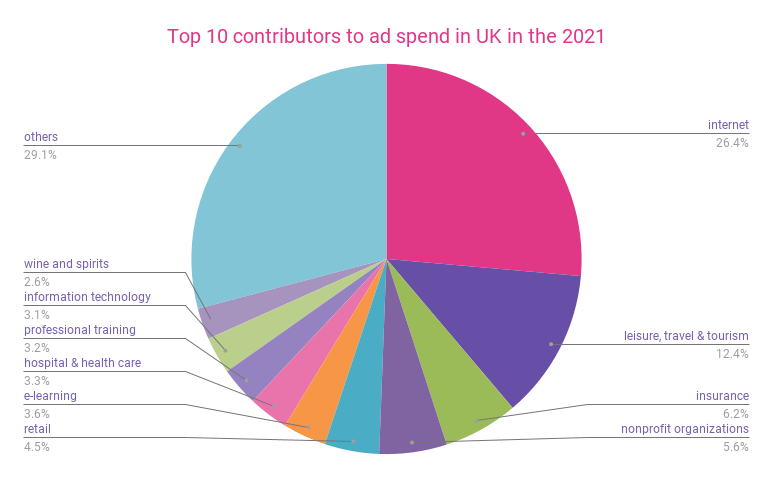
The Internet industry, an undisputed leader in marketing spend around the world, is responsible for more than a quarter of the UK’s global digital ad spend. The travel and transportation industries moved back, while insurance and nonprofit organizations strengthened their positions on the list.
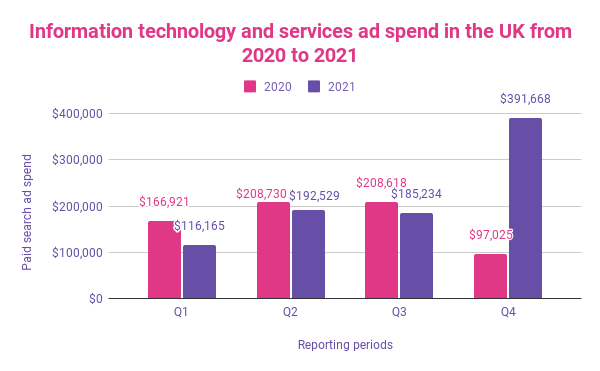
The UK’s IT sector grows and searches for new customers
Since the beginning of the pandemic, IT services and experienced IT talent have been worth their weight in gold. All industries set out to increase their digitalization, meaning IT companies have had an influx of clients and income.
Given the growing success of this industry, companies started to increase their marketing spend. In Q4 2020, the average digital ad spend was $166,921 per month per company. By the end of Q4 2021, that increased to $391,668 per month per company. That’s a 2.3x growth in the course of one year.
E-learning platforms search for new students as universities reopen
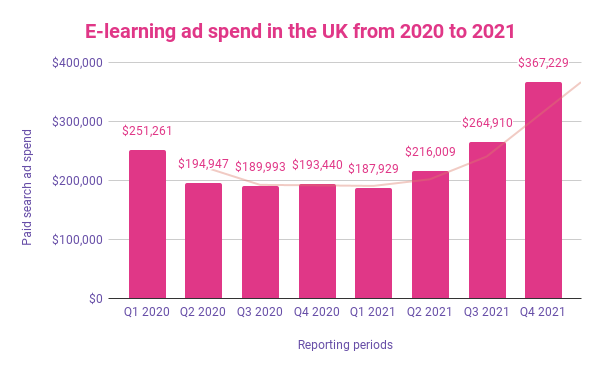
E-learning ad spend in the UK gained momentum in 2021. With an increasing number of vaccinated people, universities returned to business as usual. This factor forced e-learning platforms to attract new students to their courses.
That’s why the industry’s ad spend has skyrocketed. In Q4 2020, the average paid ad spend in the UK was $193,440 per month per company. A year later, in Q4 2021, this almost doubled, reaching an average of $367,229 per month per company.
Airlines increase their ad spend due to the resumption of flights
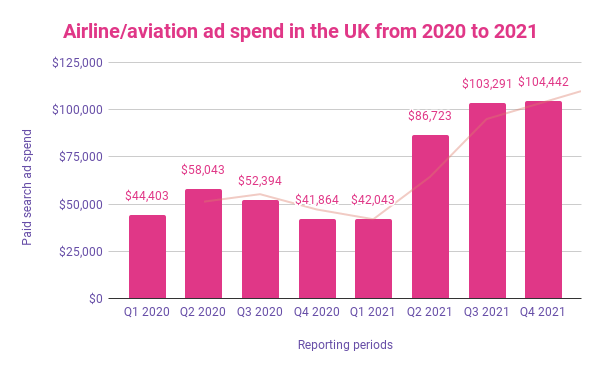
In 2021, the majority of airlines resumed suspended flights and significantly increased passenger traffic. Since business has started to return to normal, companies in this industry have invested more in digital ads. In Q4 2021, digital ad spend increased 2.3x times compared to Q4 2020. The average spend reached $104,442 per month per company.
European Union
The European Union, which also has an interesting budget distribution, is the last region on our list.
The two most dominating industries in terms of digital ad spend are the Internet and travel industries. These are responsible for around 70% of all digital ad spend in the EU.
Here’s what the situation looked like a year ago in the European Union.
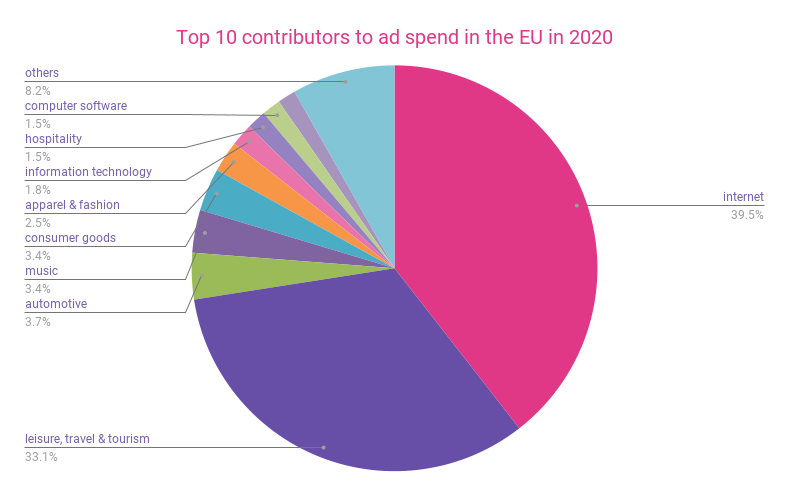
The Internet and travel industries accounted for 72.6% of the EU’s ad spend. Other industries that made it to the top 10 split the remaining ad spend.
Not much has changed in 2021.
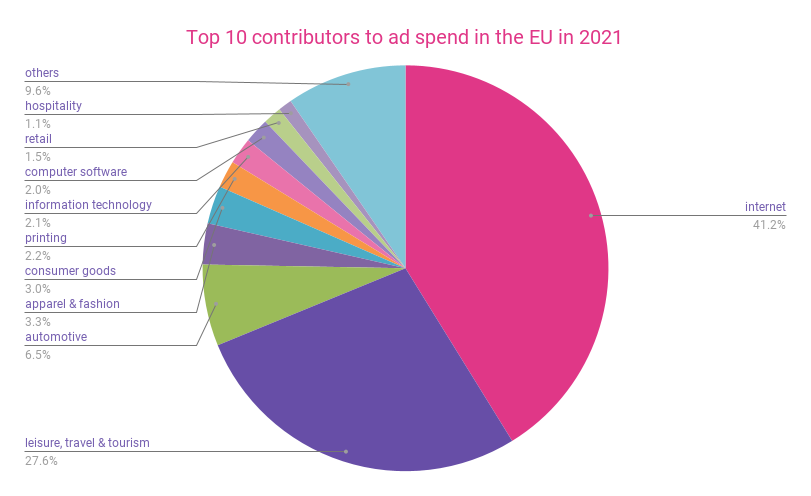
There are some slight changes, but the overall picture remains the same.
The automotive industry broke last year’s record
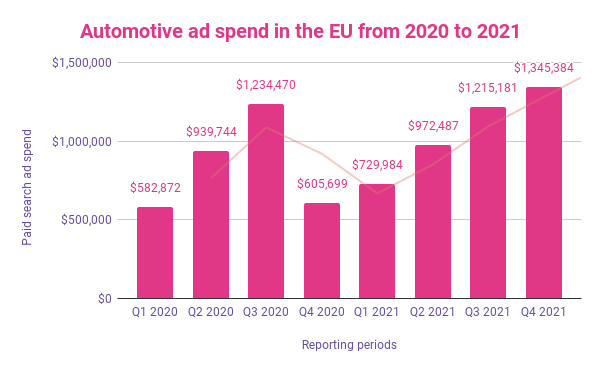
The start of 2021 wasn’t very promising for the EU’s automotive industry. However, despite the low-budget start, this industry has set a new record in ad spend, finishing Q4 of 2021 with a total of $1,345,384. The industry’s global ad spend increased by 122% compared to Q4 2020.
The logistics and supply chain industry is in desperate need of clients
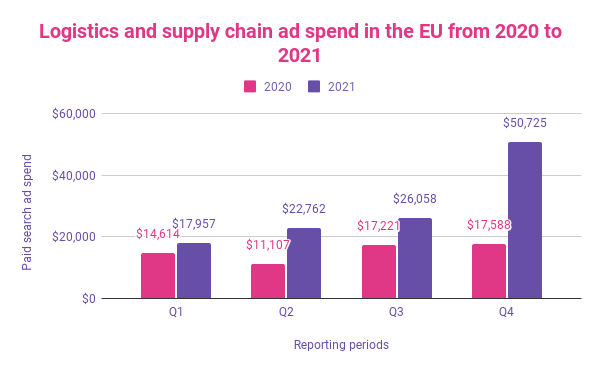
Due to the shipping crisis and the increasing popularity of Asian shipping companies, the demand for European shipping services has declined. As a result, EU-based logistics businesses now use the power of digital ads to attract new customers and find new audiences.
In Q4 2021, the logistics industry ad spend reached an average of $50,725 per month per company, which is almost three times more than last year.
Our thoughts on the situation
Having analyzed the information across all industries and regions, we feel it is safe to say that digital ad spend is steadily declining.
Even though marketing spend has increased since Q3 2021, the global trend indicates that companies are cutting their marketing expenses.
There are numerous reasons for this, ranging from the successful distribution and uptake of the vaccine and return to a more normal lifestyle to a decrease in companies’ revenue. It has become clear that companies have to adapt to the new reality, work on new marketing strategies to attract customers, and stay on top of developing marketing trends.
Stay on top of developing marketing trends 👇
We’re making this report evergreen, helping you to always stay on top of new and emerging challenges and trends. It will be updated each quarter with brand-new information across all industries and countries.
Sign up for updates to get exclusive new insights that will keep you one step ahead of the competition
.png)
.jpeg)


.png)
