New AI Agent
The new AI Agent is a huge leap forward — it’s faster, smarter, more flexible, and more autonomous. Think of it as your embedded analyst that actually understands your business and can explain, visualize, document, and act on your data — all through natural language.
Heads-up: The Agent now does deeper reasoning. That’s great for complex queries, but it may sometimes overthink. If it goes too far, interrupt it and clarify. It’ll adjust immediately.
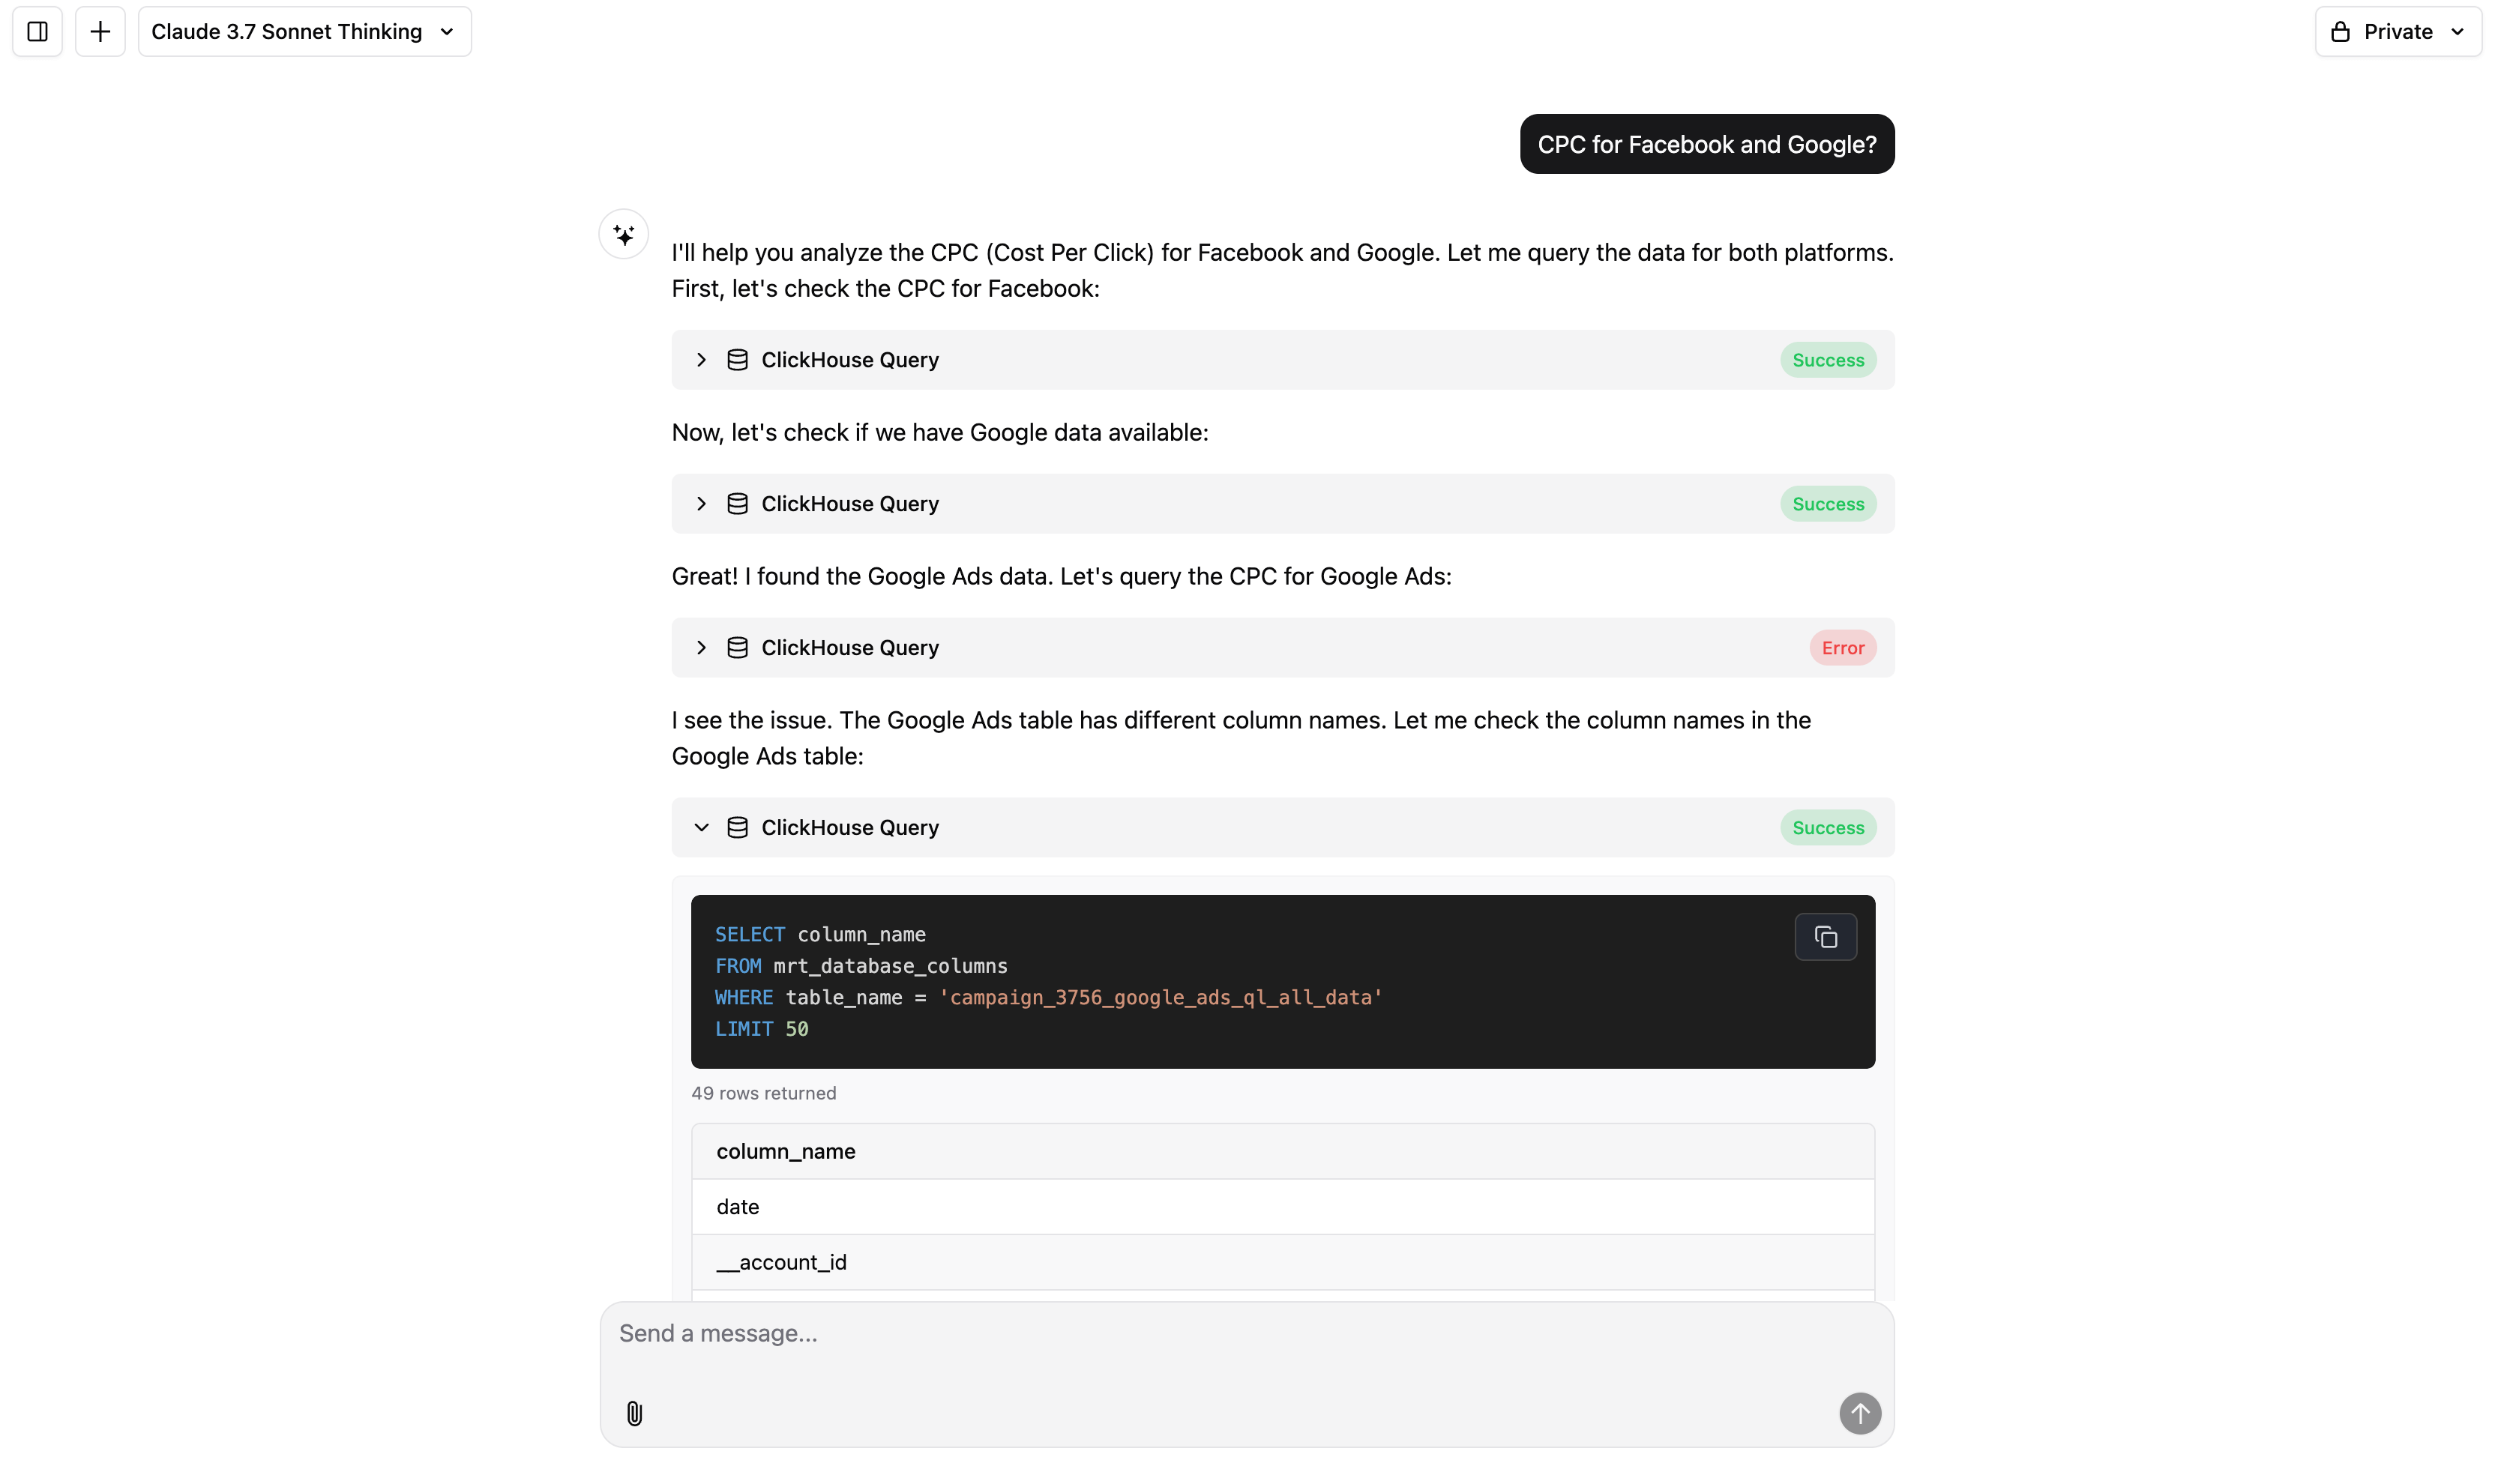
Query your data in real time
You can ask the Agent anything about your data. It streams the result in real time, and you can interrupt or redirect it mid-response.
Examples:
- “What are my top-performing campaigns by ROAS in the last 30 days?”
- “Break down total spend by channel and country.”
- “Show daily spend trends for the last 2 weeks with anomalies flagged.”
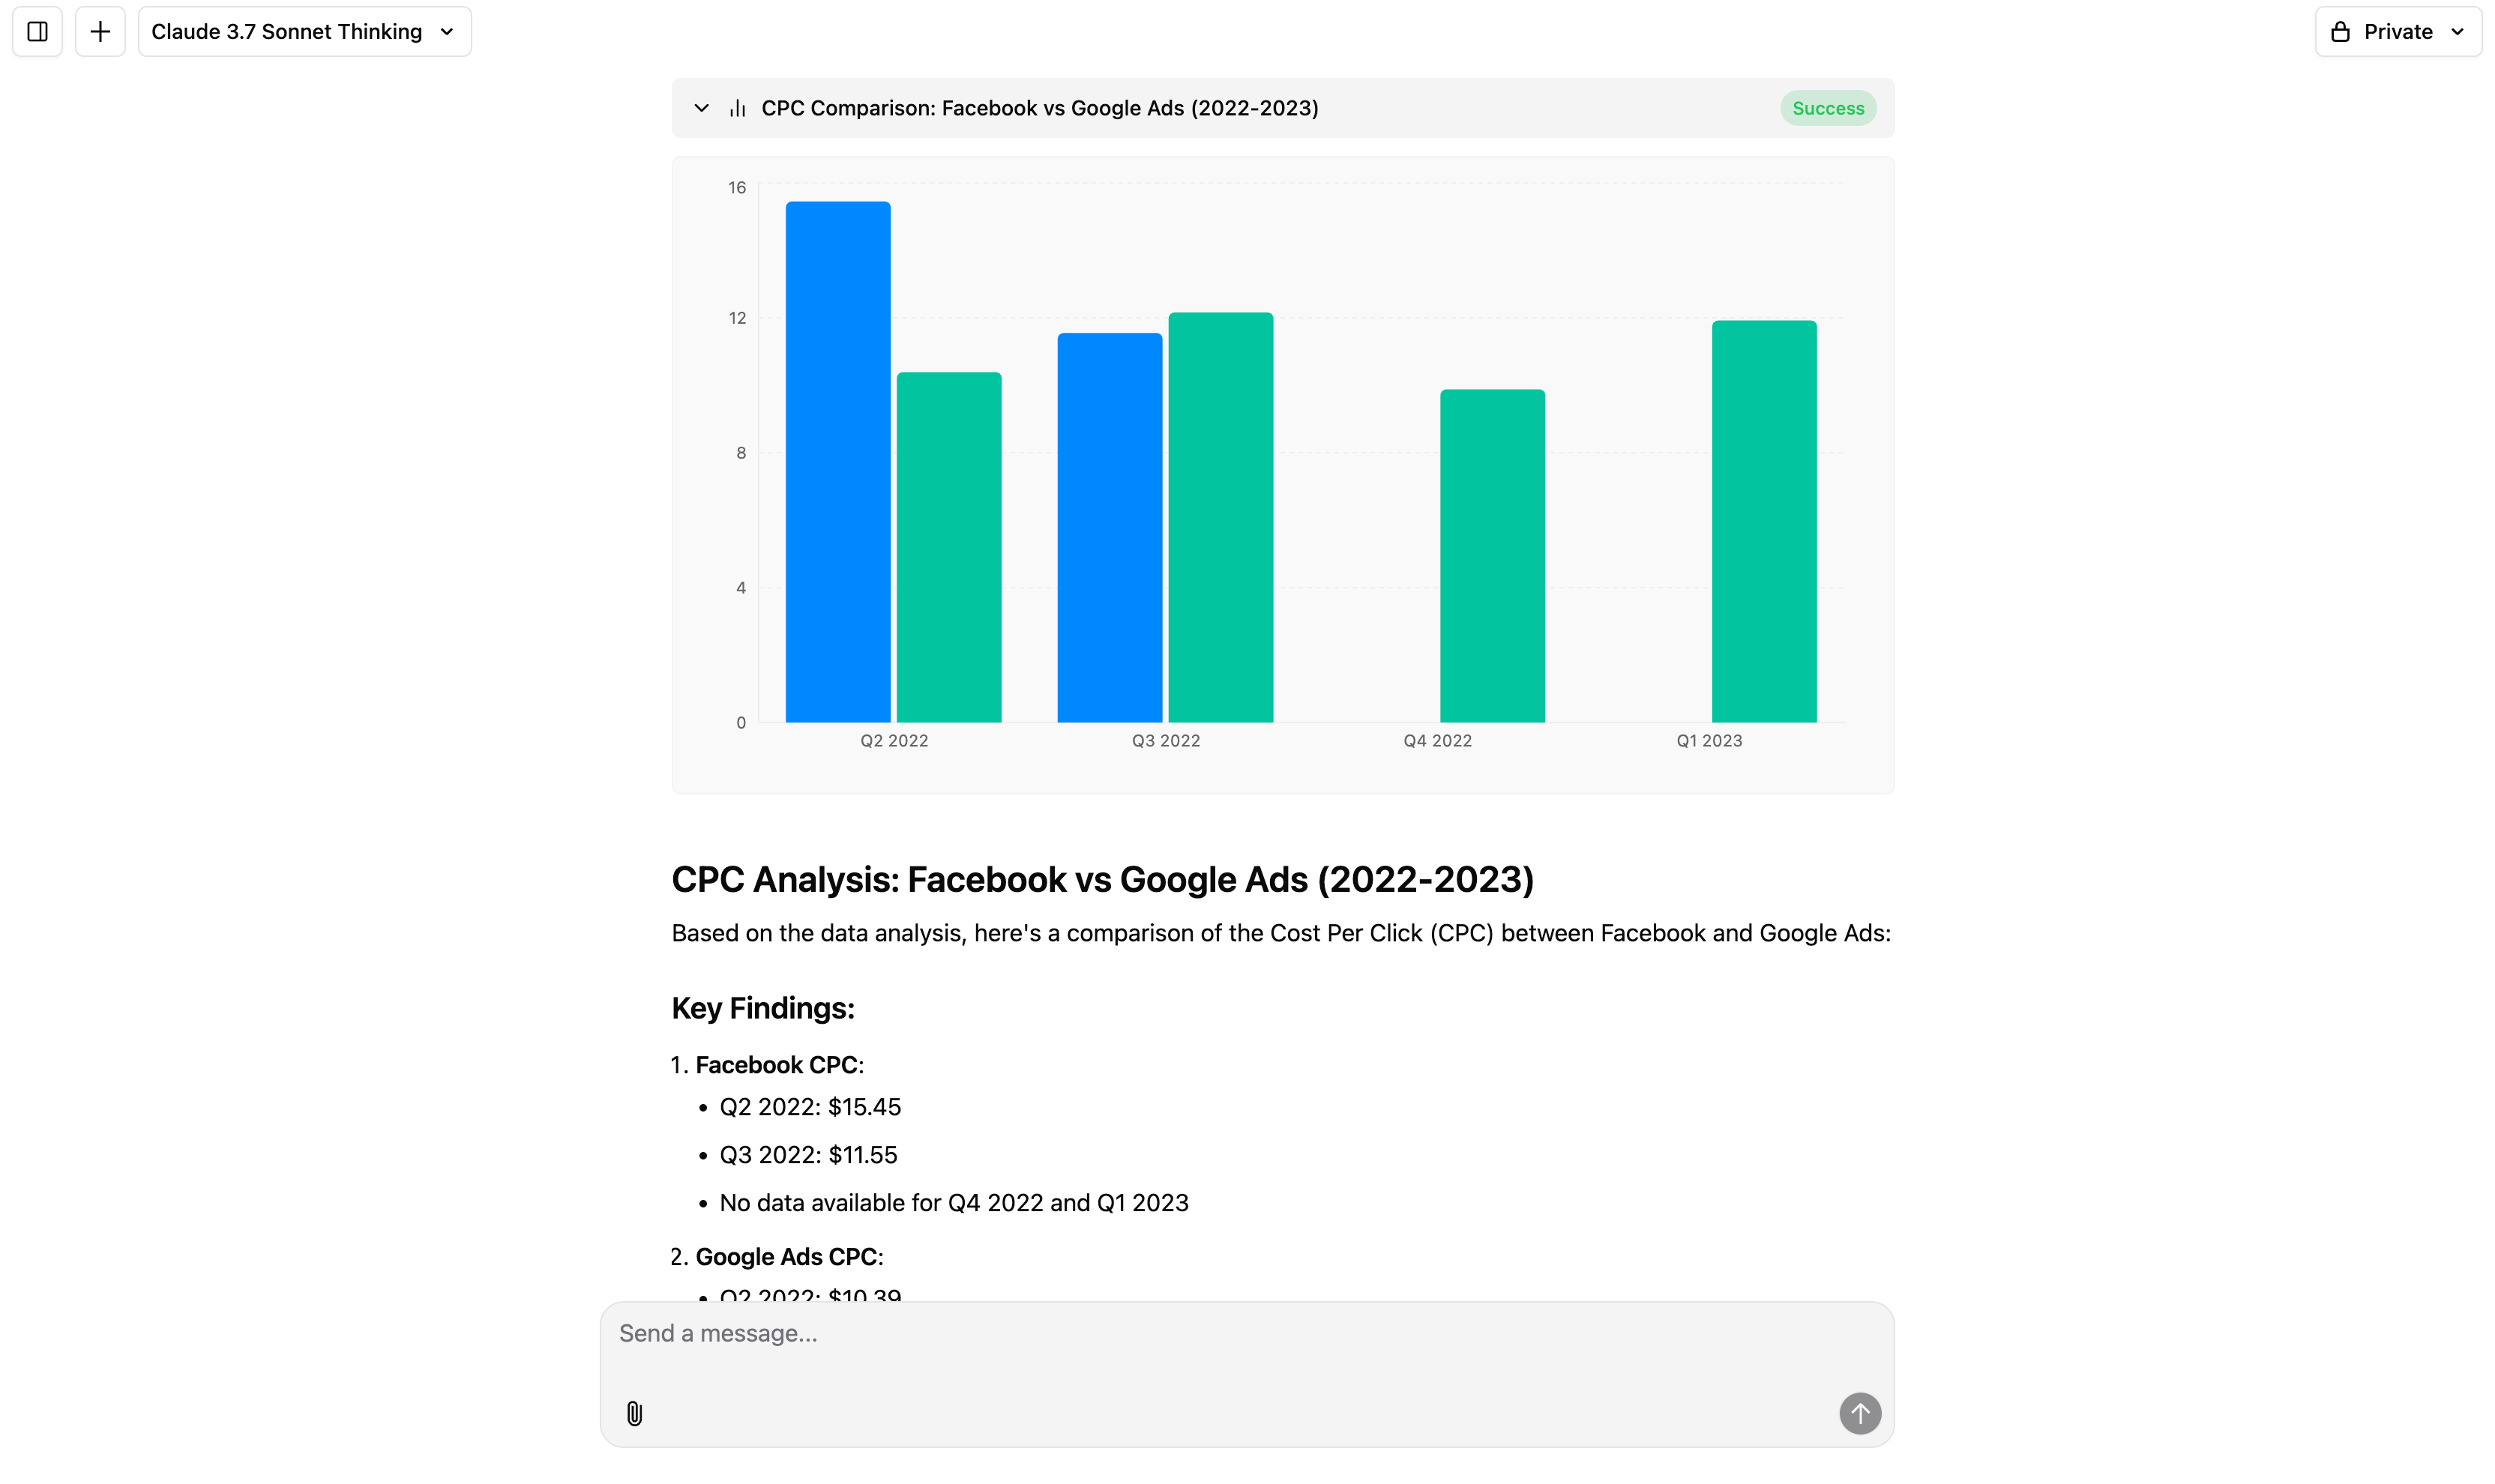
Visualize your data
The Agent supports rich chart generation, including advanced types. You can ask for visualizations explicitly or leave it to the Agent to choose the best format.
Examples:
- “Visualize revenue vs. spend over time.”
- “Show platform performance as a pie chart.”
- “Create a scatter plot of CPC vs CTR and highlight Facebook data.”
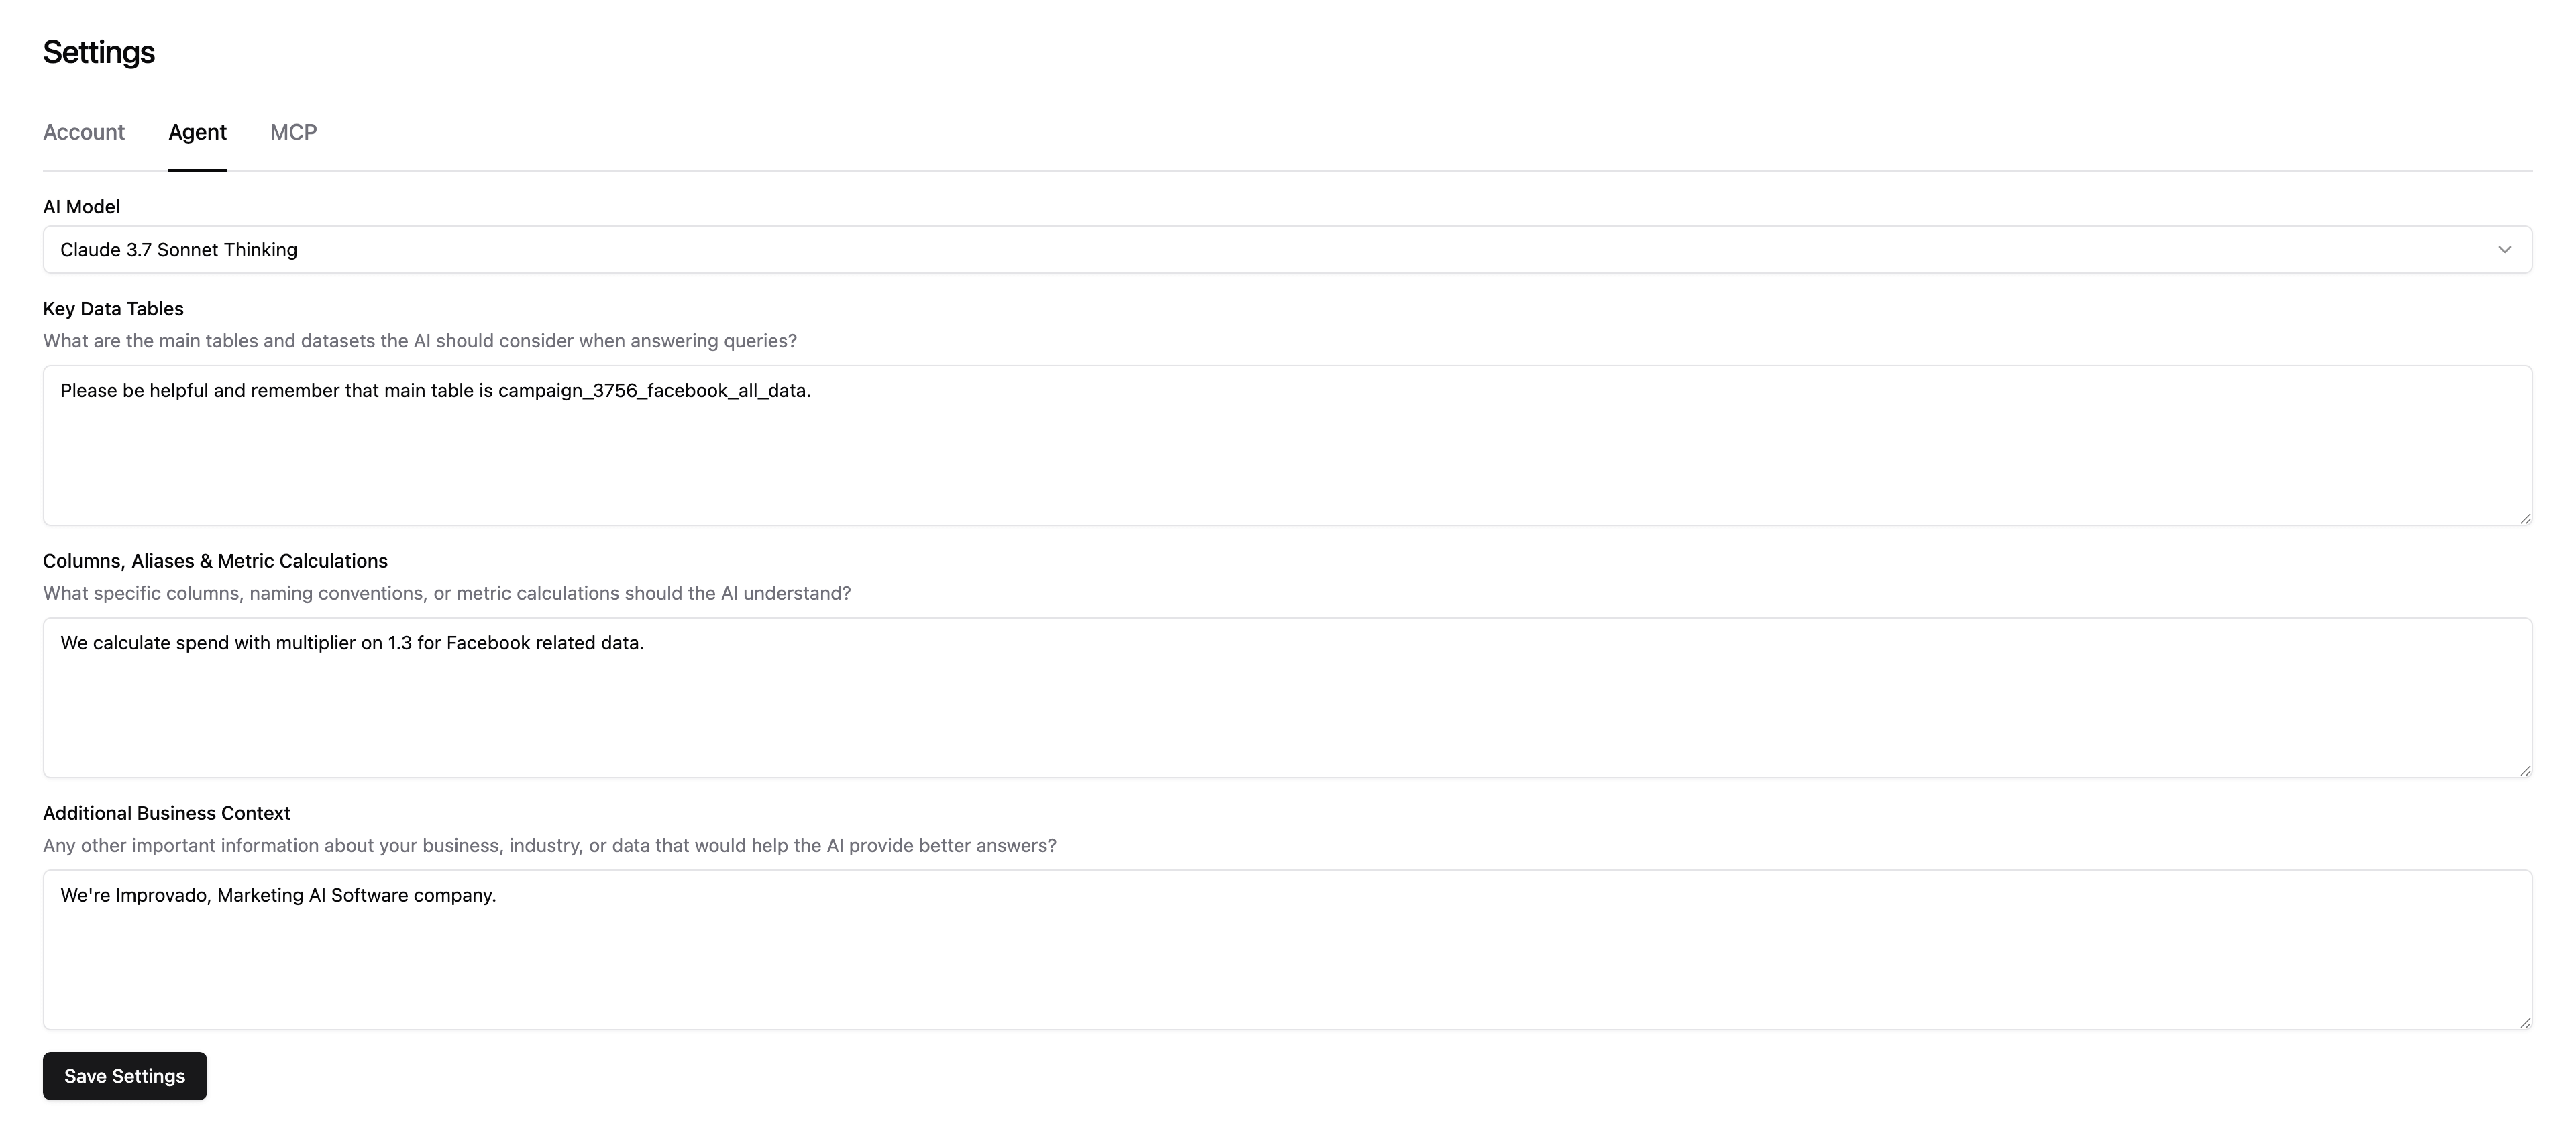
Add business context
Make the Agent work like it’s on your team. You can customize how it understands your company, data, and metrics.
Examples:
- “When I say ‘sales’, use the total_sales column from agg_summary.”
- “Use cross_channel_recipe as the main table unless I say otherwise.”
- “Marketing Efficiency = (Sales - Spend) / Spend.”
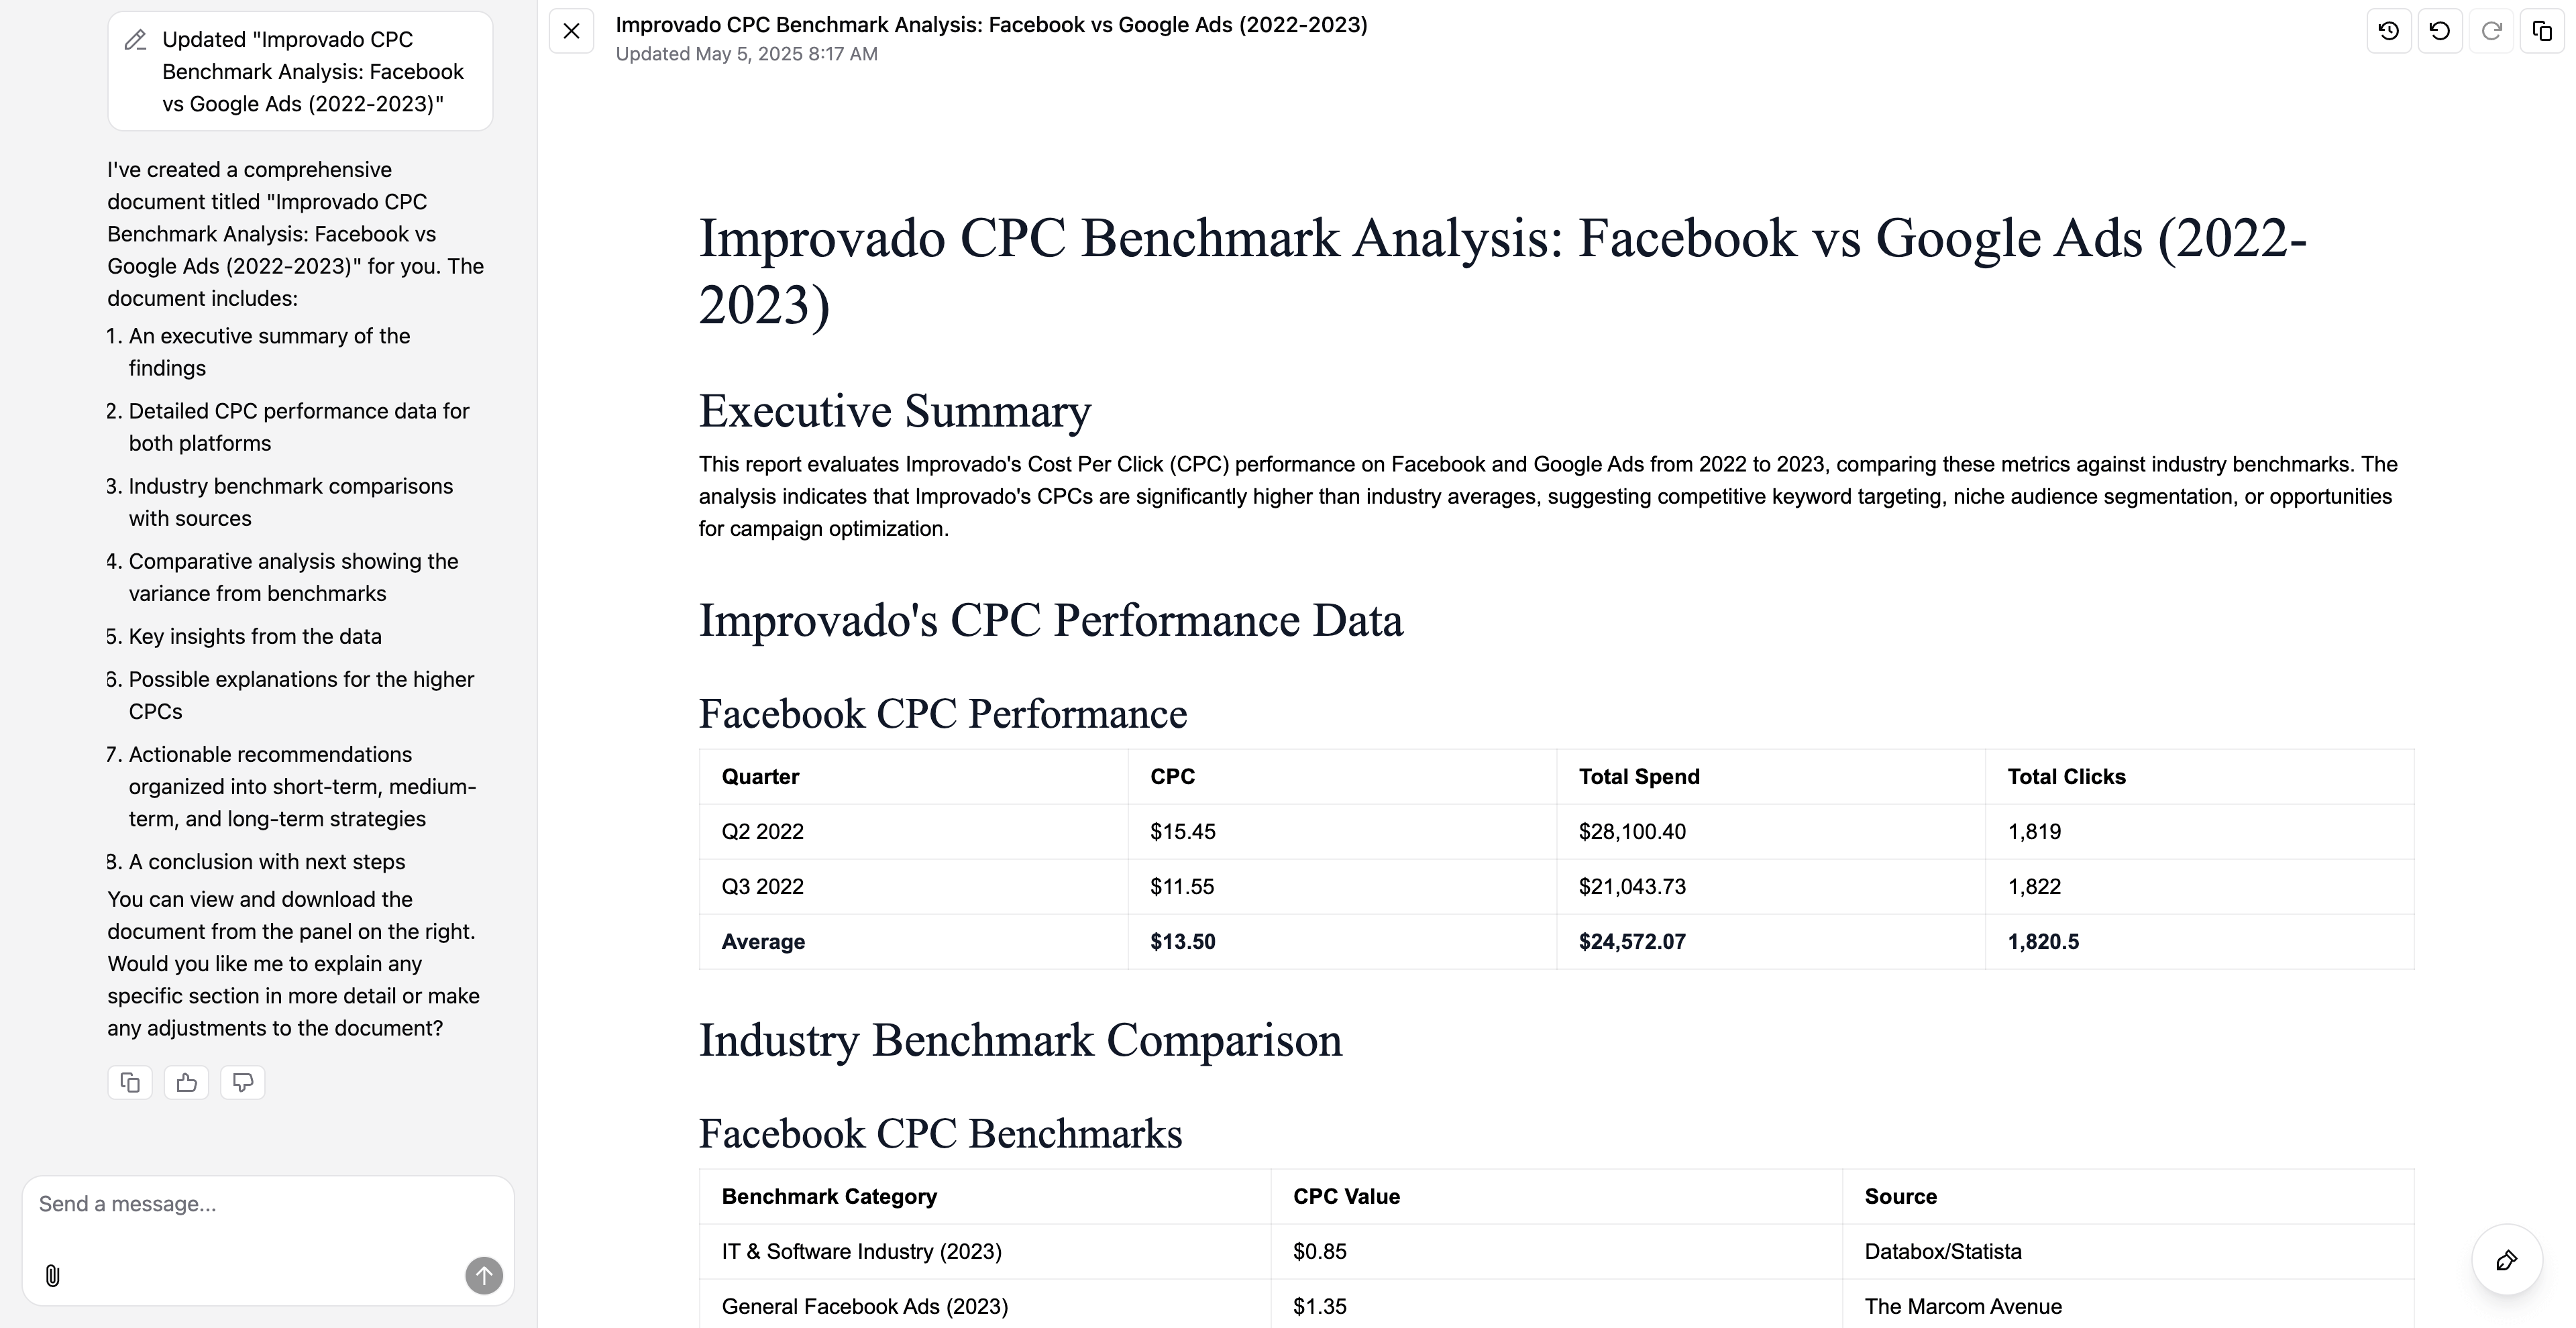
Create documents
The Agent can build internal documents like summaries, analyses, workflows, or plans — just by describing what you need.
Examples:
- “Create a report summarizing ROAS by platform for last week.”
- “Make a checklist for launching a new campaign with dependencies.”
- “Document how to run a weekly budget QA.”
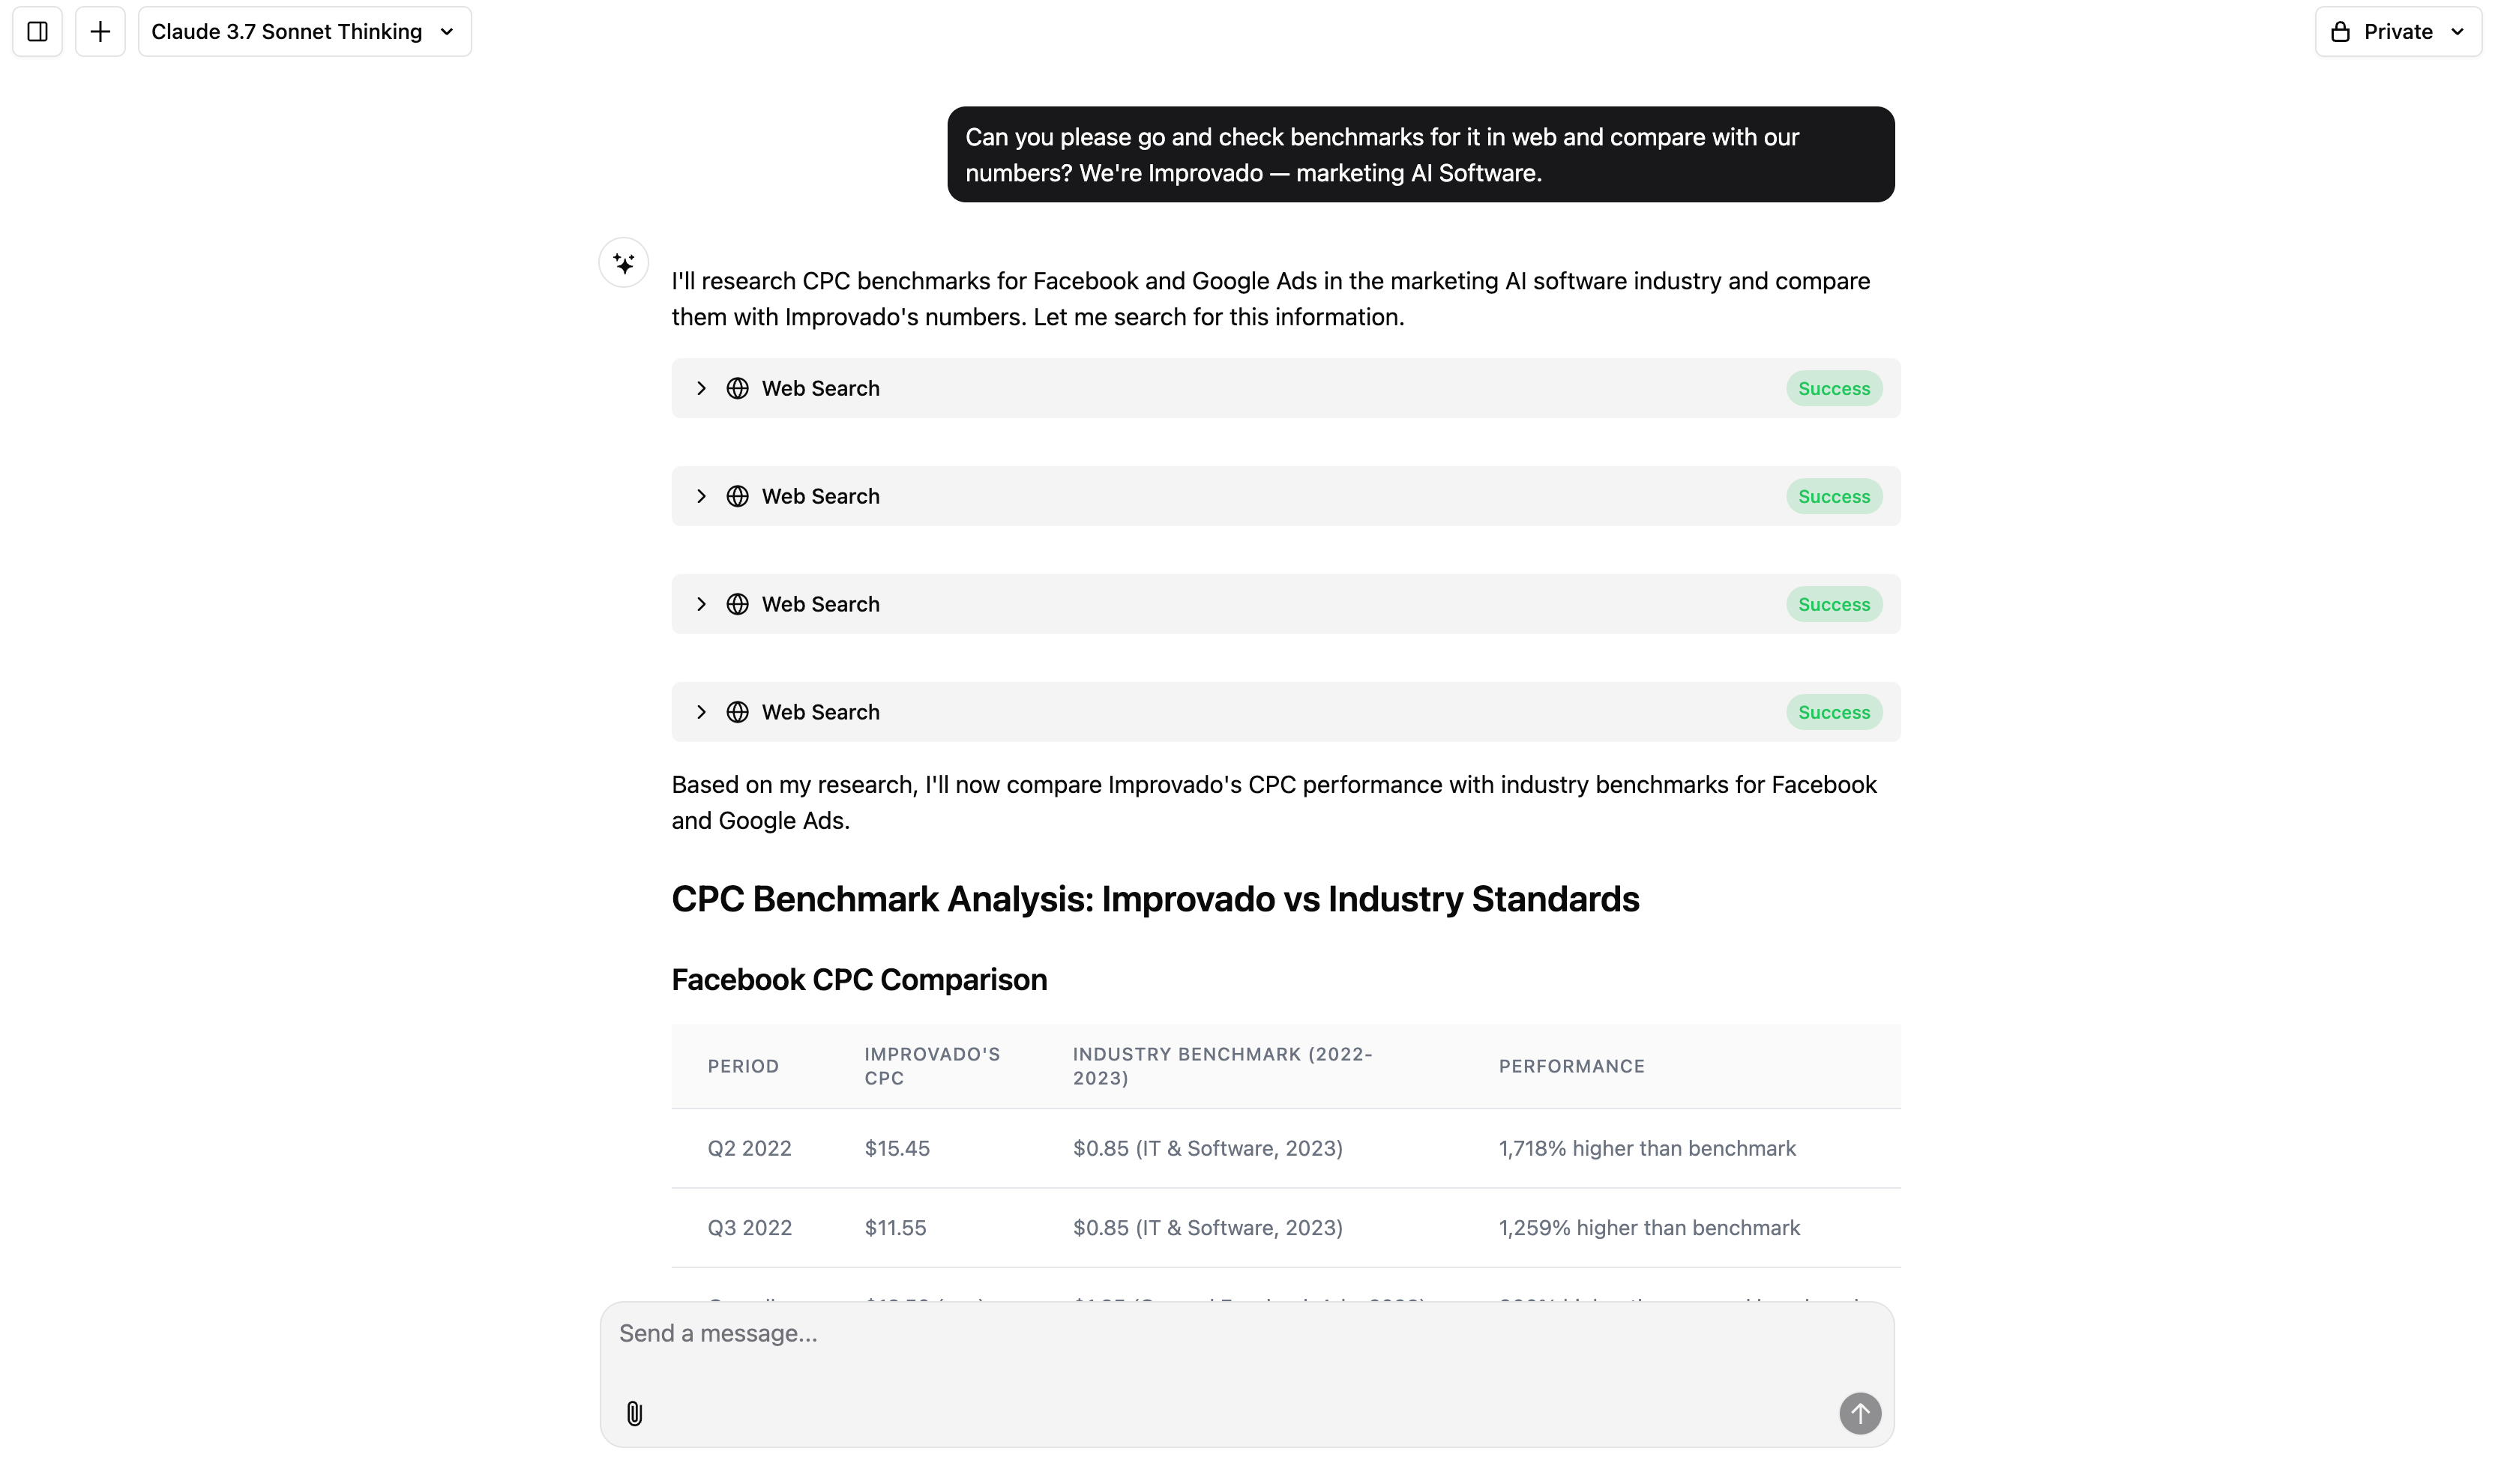
Search the web
Use the Agent to fetch live benchmarks, competitor data, or market stats from the internet — and optionally match them to your internal performance.
Examples:
- “Find CPM benchmarks for DTC in Q1 2024.”
- “Get a list of all competitors of HubSpot and compare their pricing pages.”
- “Search for new TikTok ad formats announced this month.”
Choose your AI model
You can now choose the engine powering your Agent — useful for preference, speed, or tone.
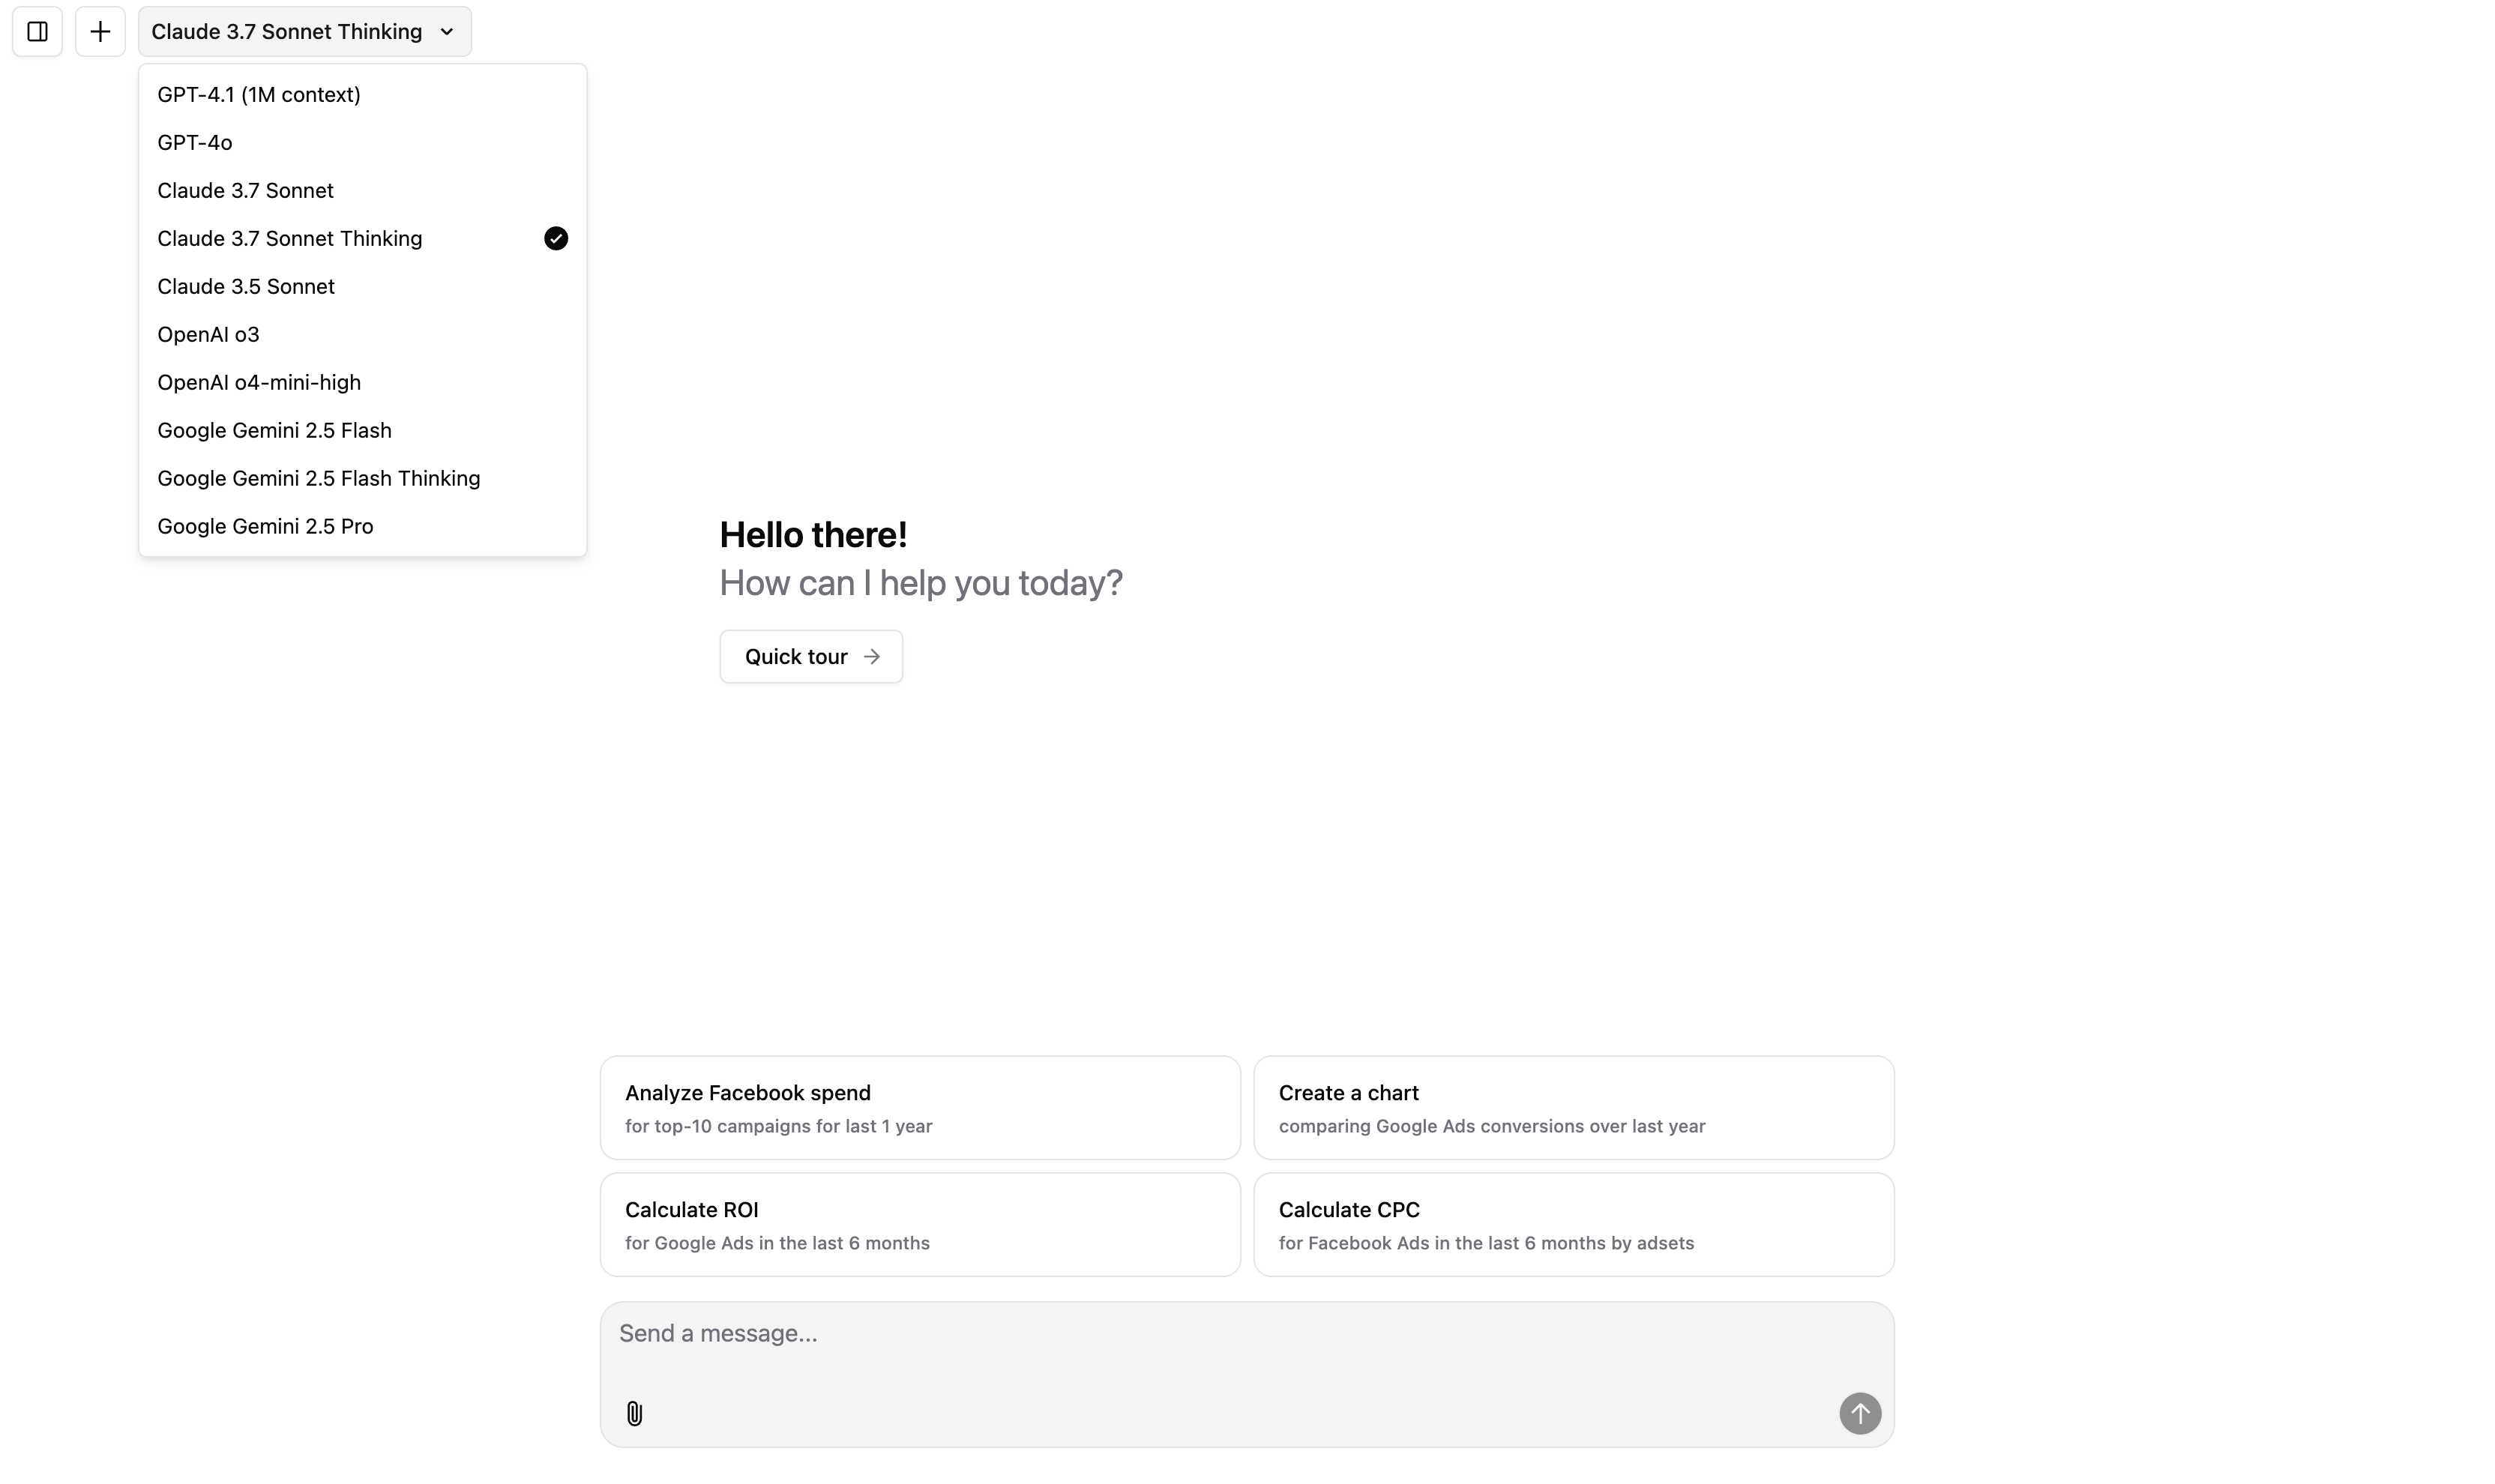
Options:
- OpenAI — fast, quick answers.
- Anthropic Claude — for deeper reasoning.
- Google Gemini — a balance between OpenAI and Anthropic.
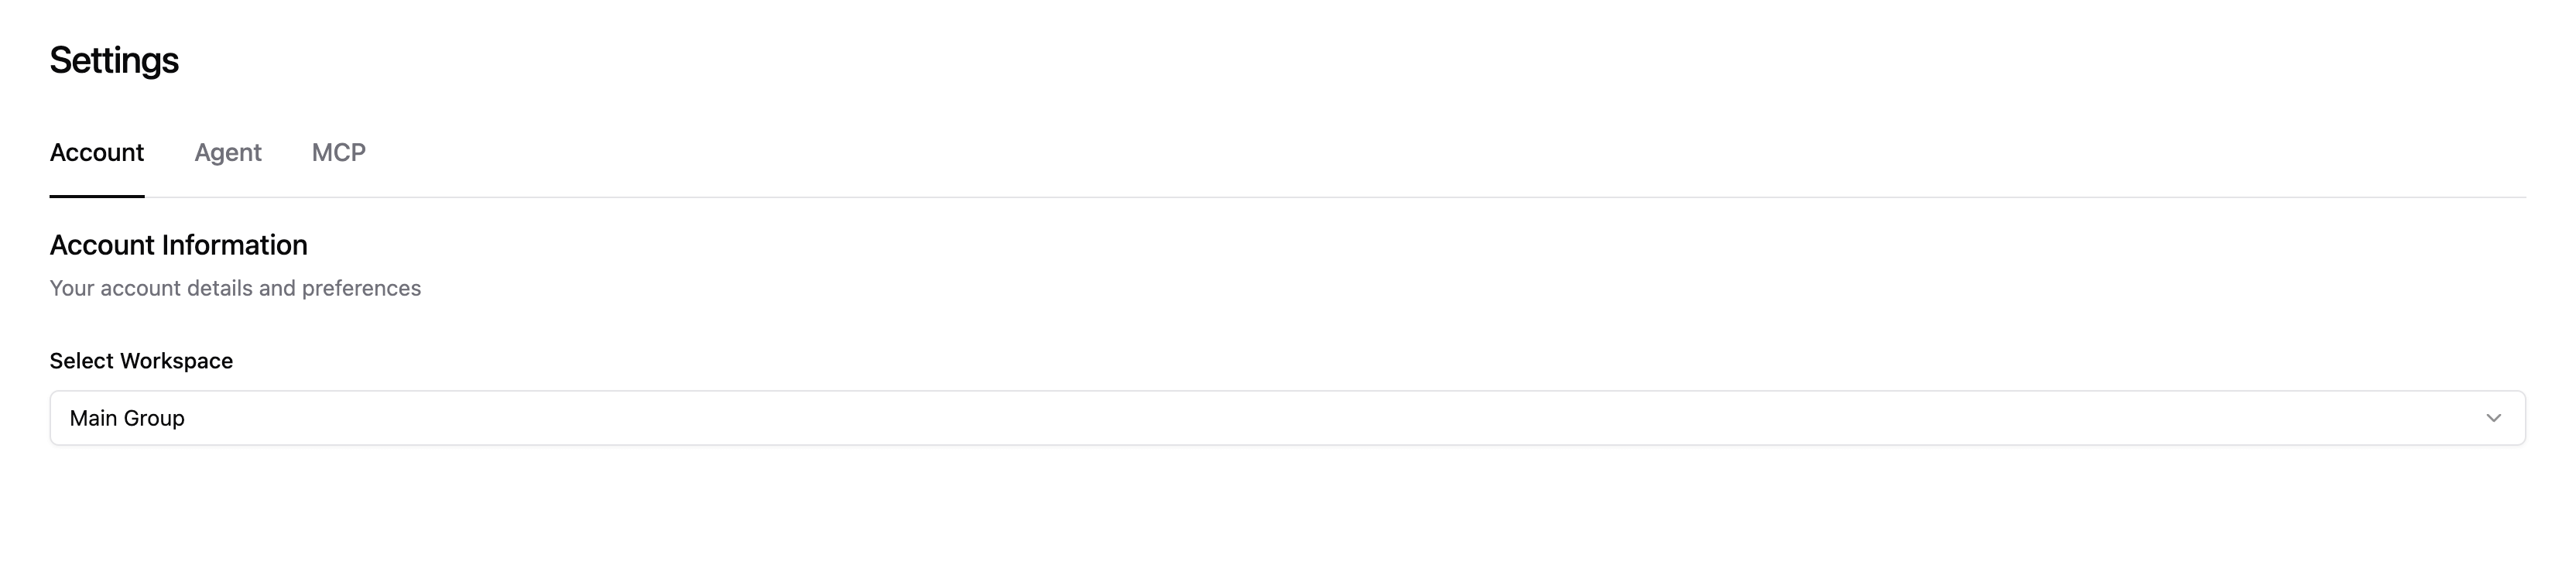
Switch between workspaces
In the settings menu, you can choose which Workspace you want the Agent to operate in. Once selected, the Agent will instantly switch to that workspace’s data context, including access to relevant tables, metrics, and rules.
Public and private chats
Every chat starts as private by default. You can toggle visibility to public, which will move the chat into the Shared Chats section.
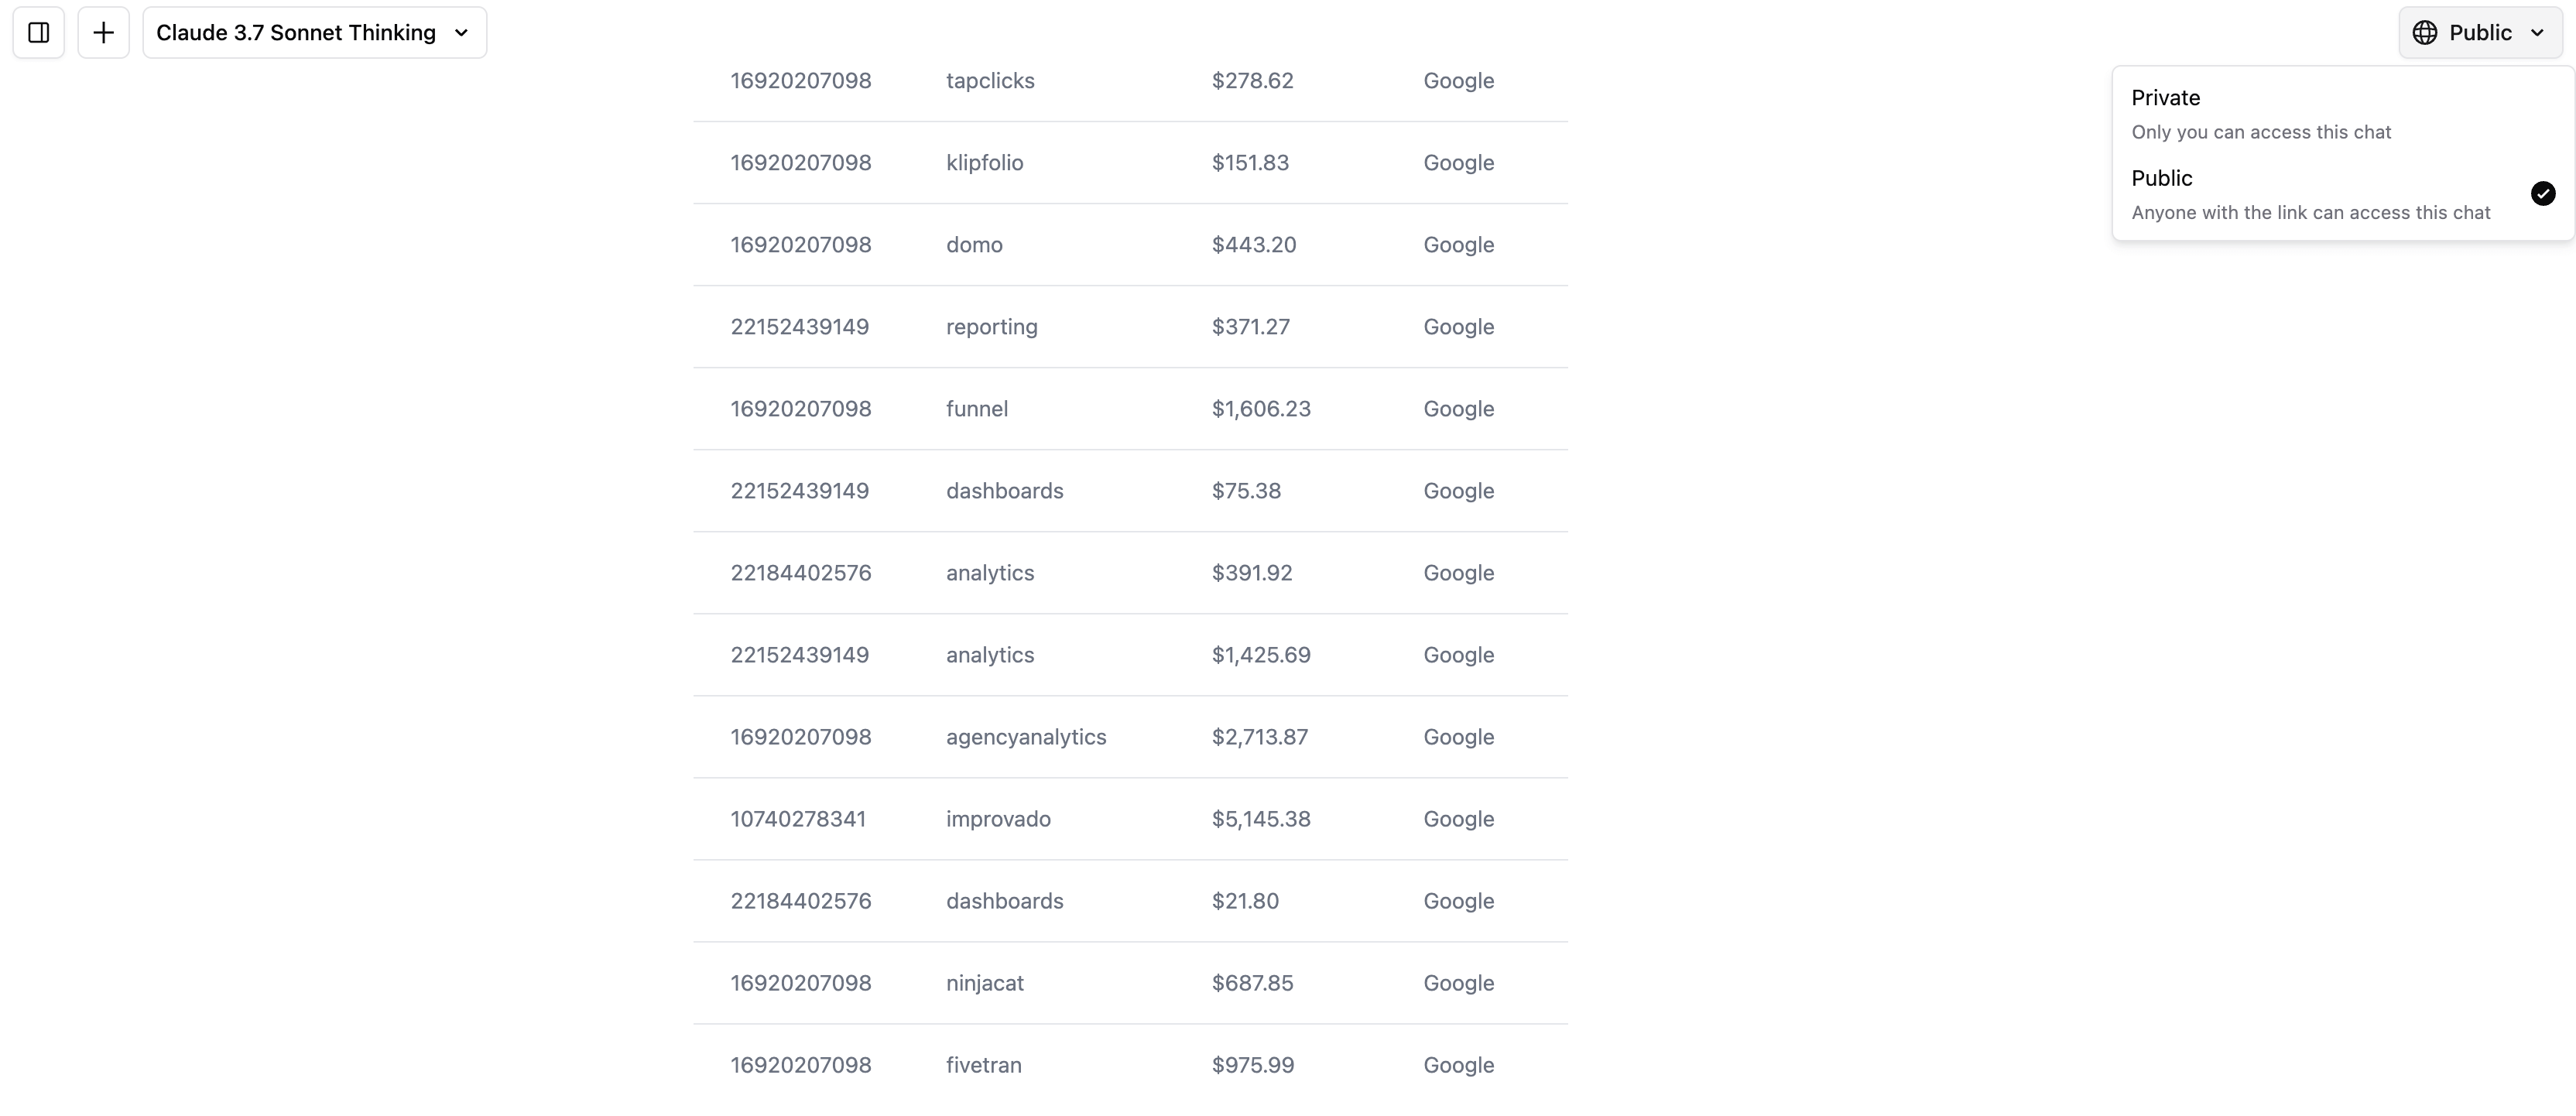
When a chat is public:
- All team members in your organization can view it.
- It’s great for shared learning, reporting workflows, and team alignment.
(Beta) Connect external tools with MCP
MCP stands for Model Context Protocol — it’s a universal plugin system that allows the Agent to connect to any external tool or service, such as Google Ads, Salesforce, Gong, and thousands more.
With MCP, the Agent can understand tools as if they were part of your dataset — query them, reason over the output, and combine them into workflows.
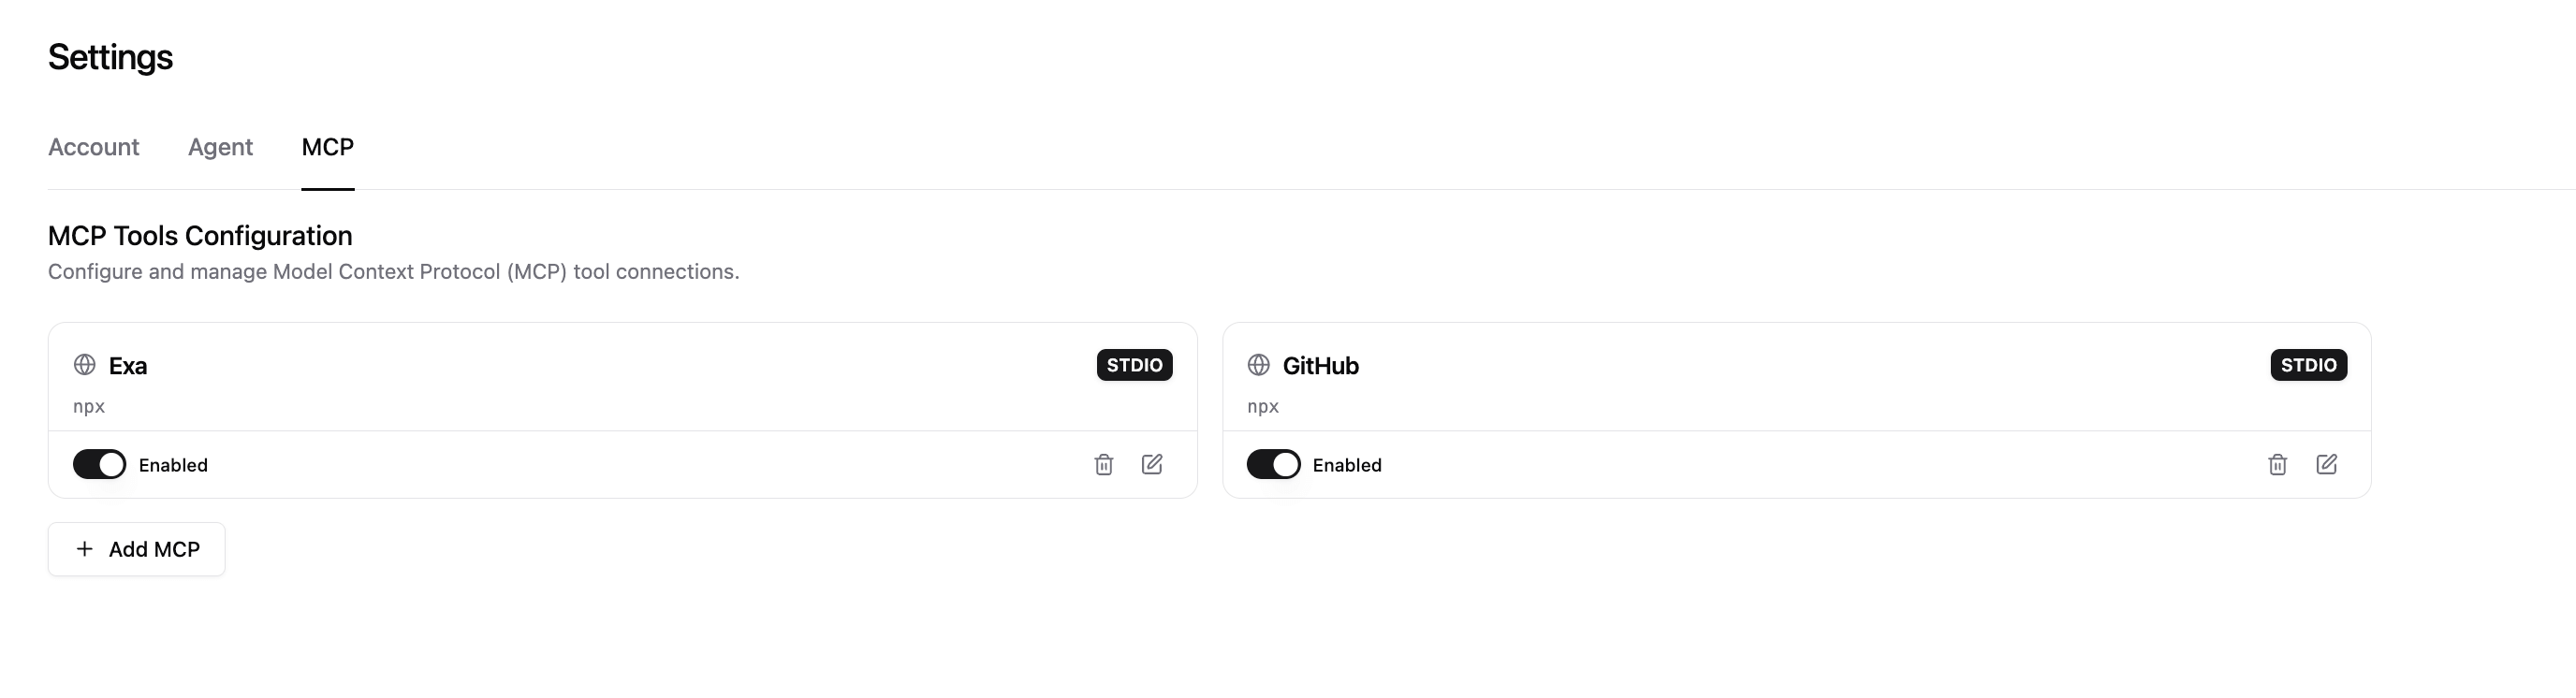
Improvado’s team can help connect your tools to the Agent via MCP securely and quickly. Just reach out to your CSM.
Conclusions
AI Agent is your always-on data analyst that understands your business, adapts to your language, and delivers insights in real time. It helps you move from questions to visualizations, documents, and automated actions — all in one place. With built-in customization, web access, and tool integrations via MCP, it becomes smarter the more you use it.