Updated on
Jan 29, 2025
We’ve launched a feature that lets you create dashboards based on the structure of a recipe. Here’s how you can set up a new dashboard and explore visualizations in just a few steps.
Each recipe within our Recipe Library has a specific dashboard structure.
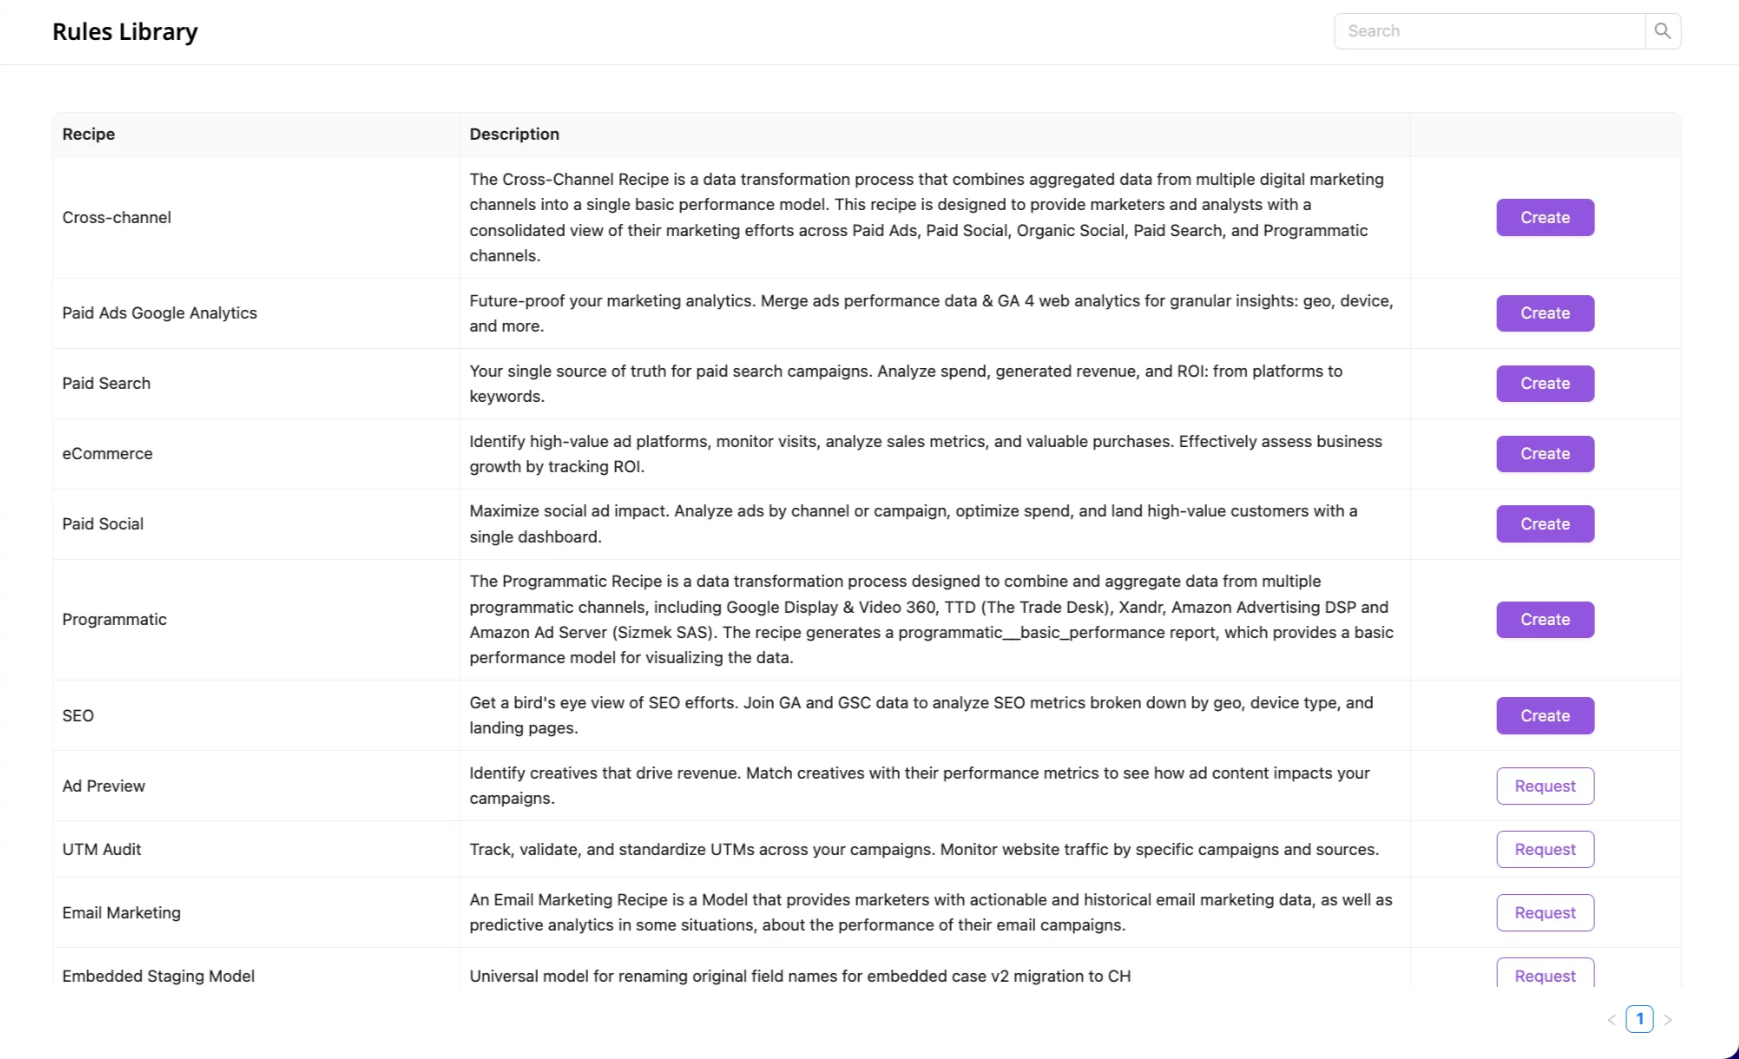
For example, let’s look at how a cross-channel dashboard would work.
To create a dashboard, begin by selecting or creating a recipe. Each recipe in Improvado provides the foundation for your dashboard, with a predefined structure that tailors insights to your specific data transformation.
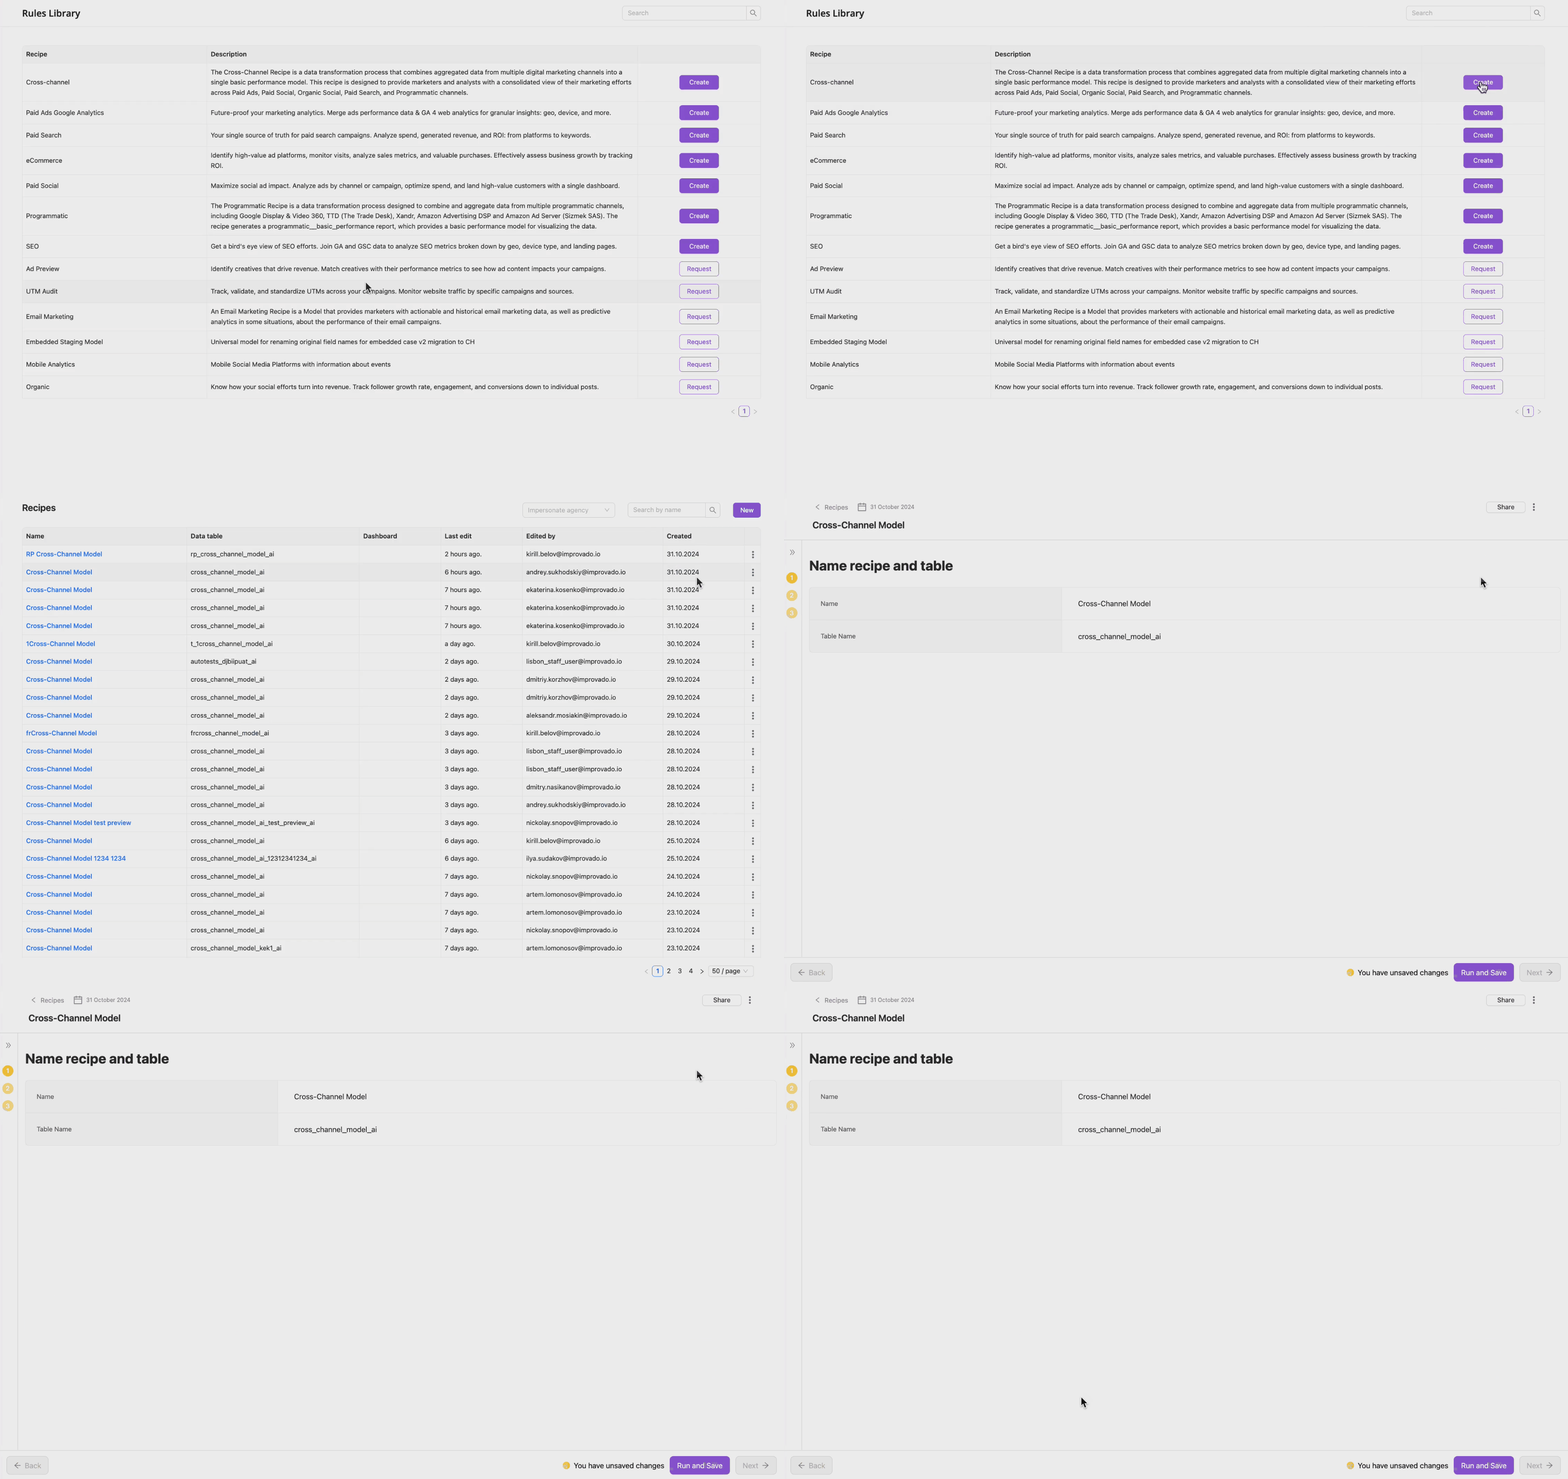
Once your recipe is set up with data sources and calculated fields, you’re ready to generate a dashboard. From the dropdown, choose Create Dashboard. This action will automatically generate a dashboard based on your recipe.
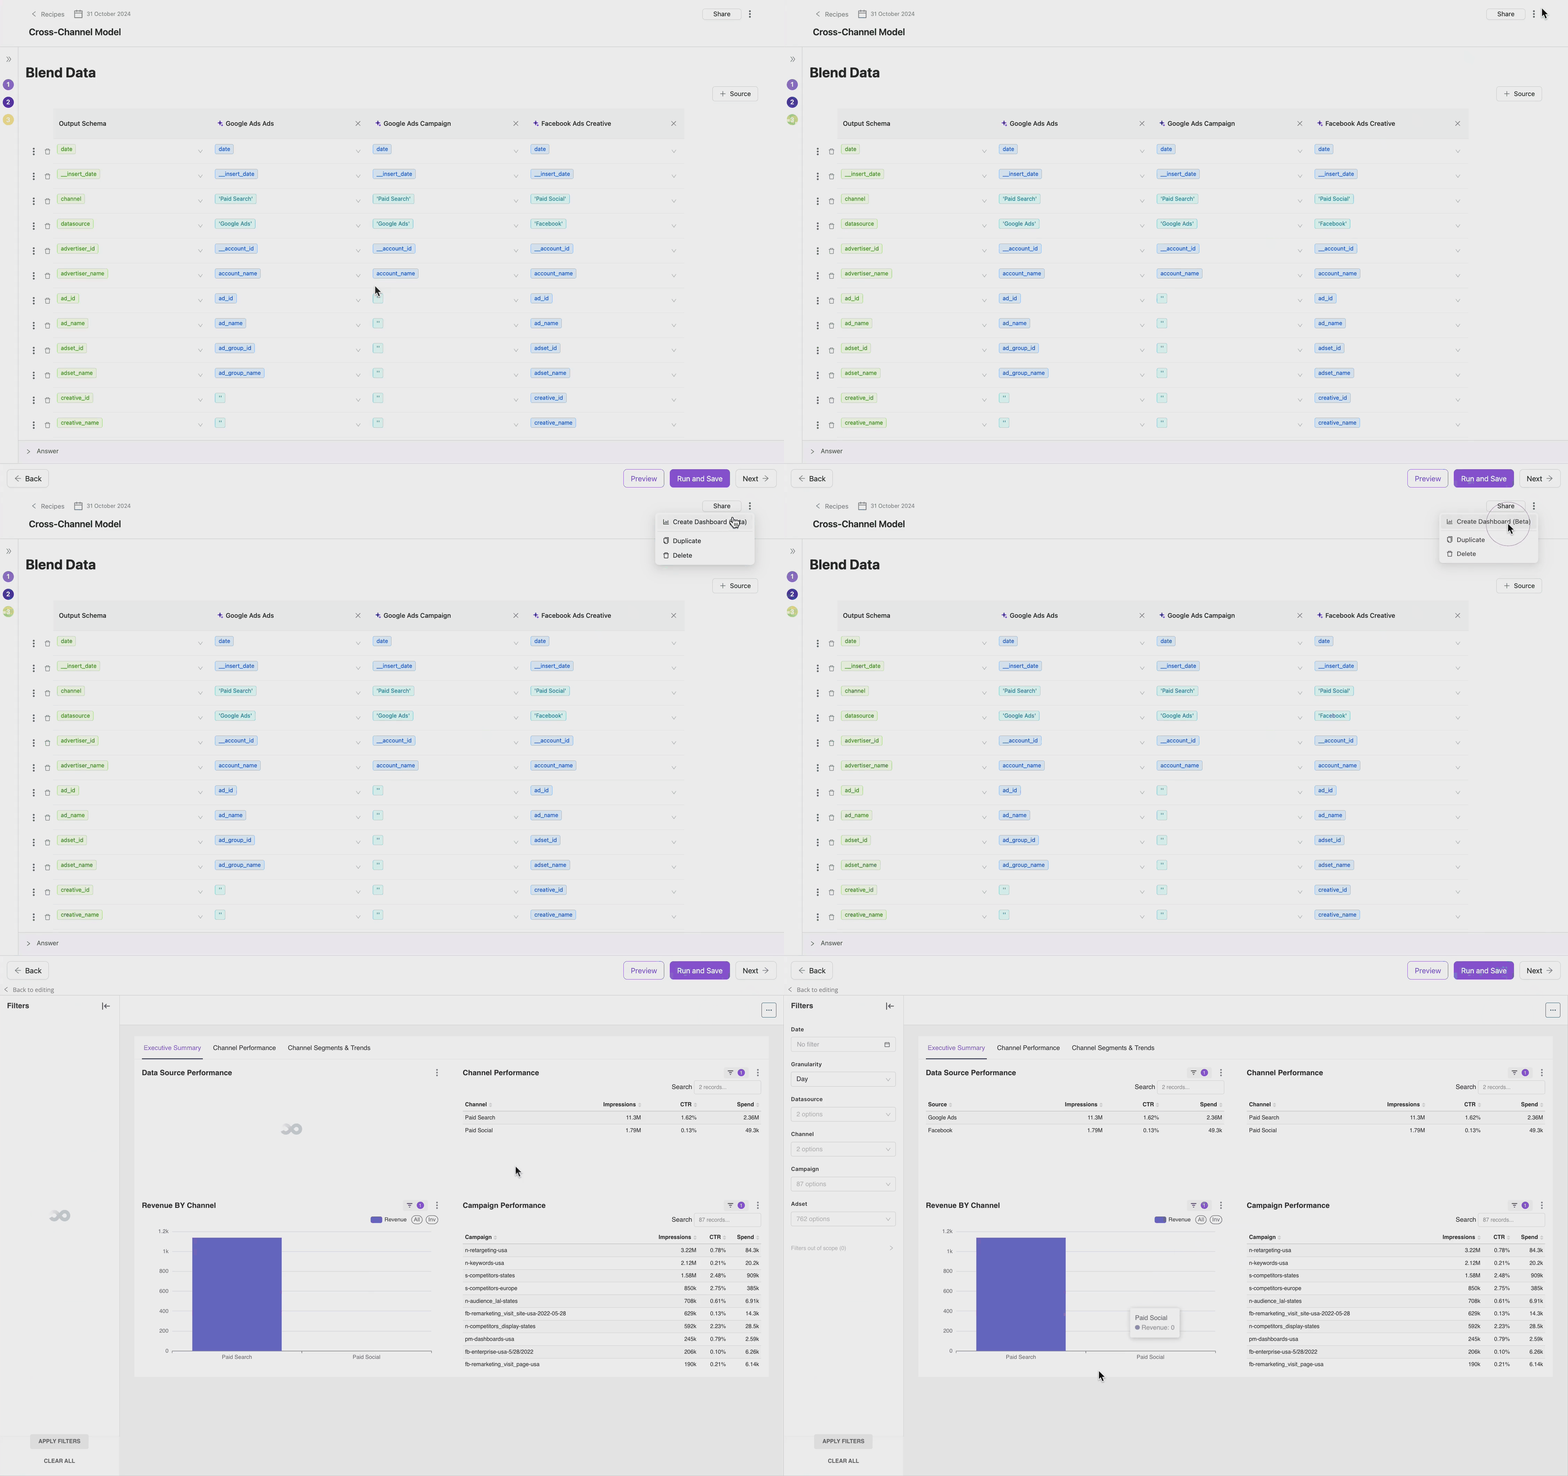
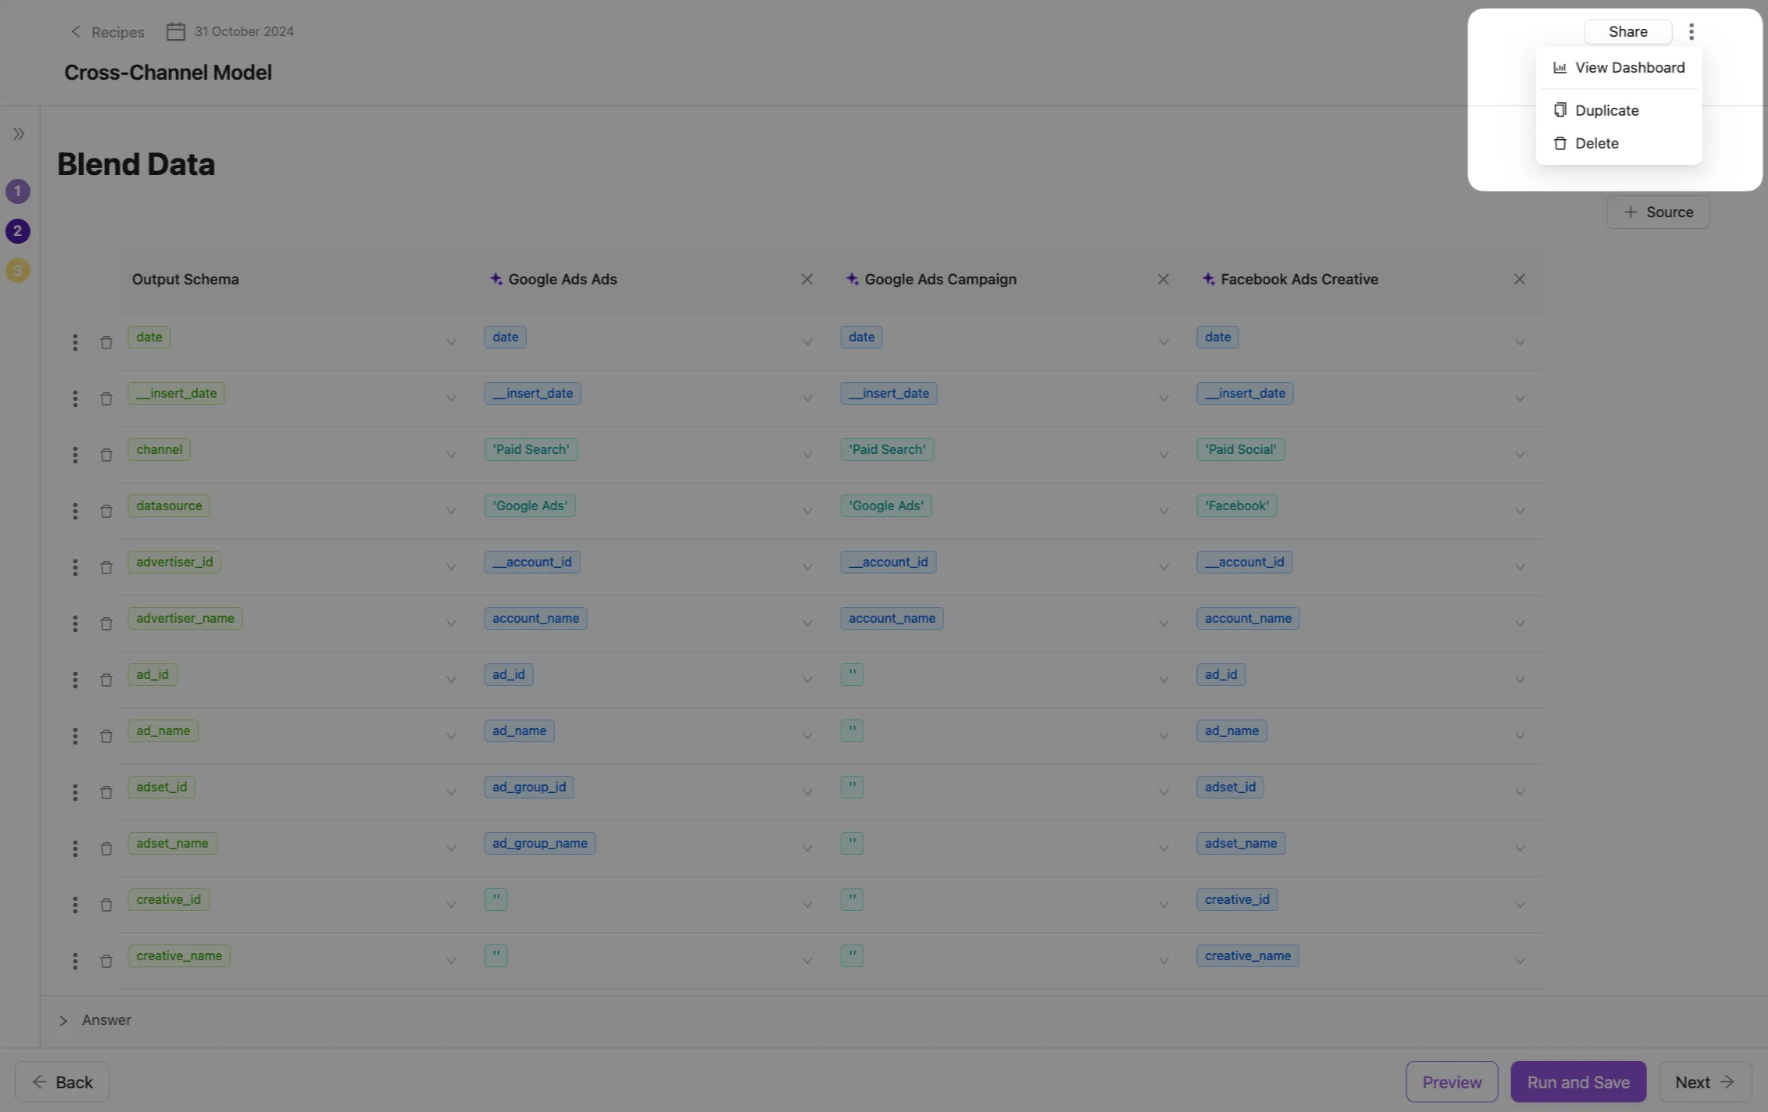
The dashboard will be accessible in two places:

Any time you adjust your recipe — adding data sources, modifying calculations — your dashboard will update to reflect these changes.
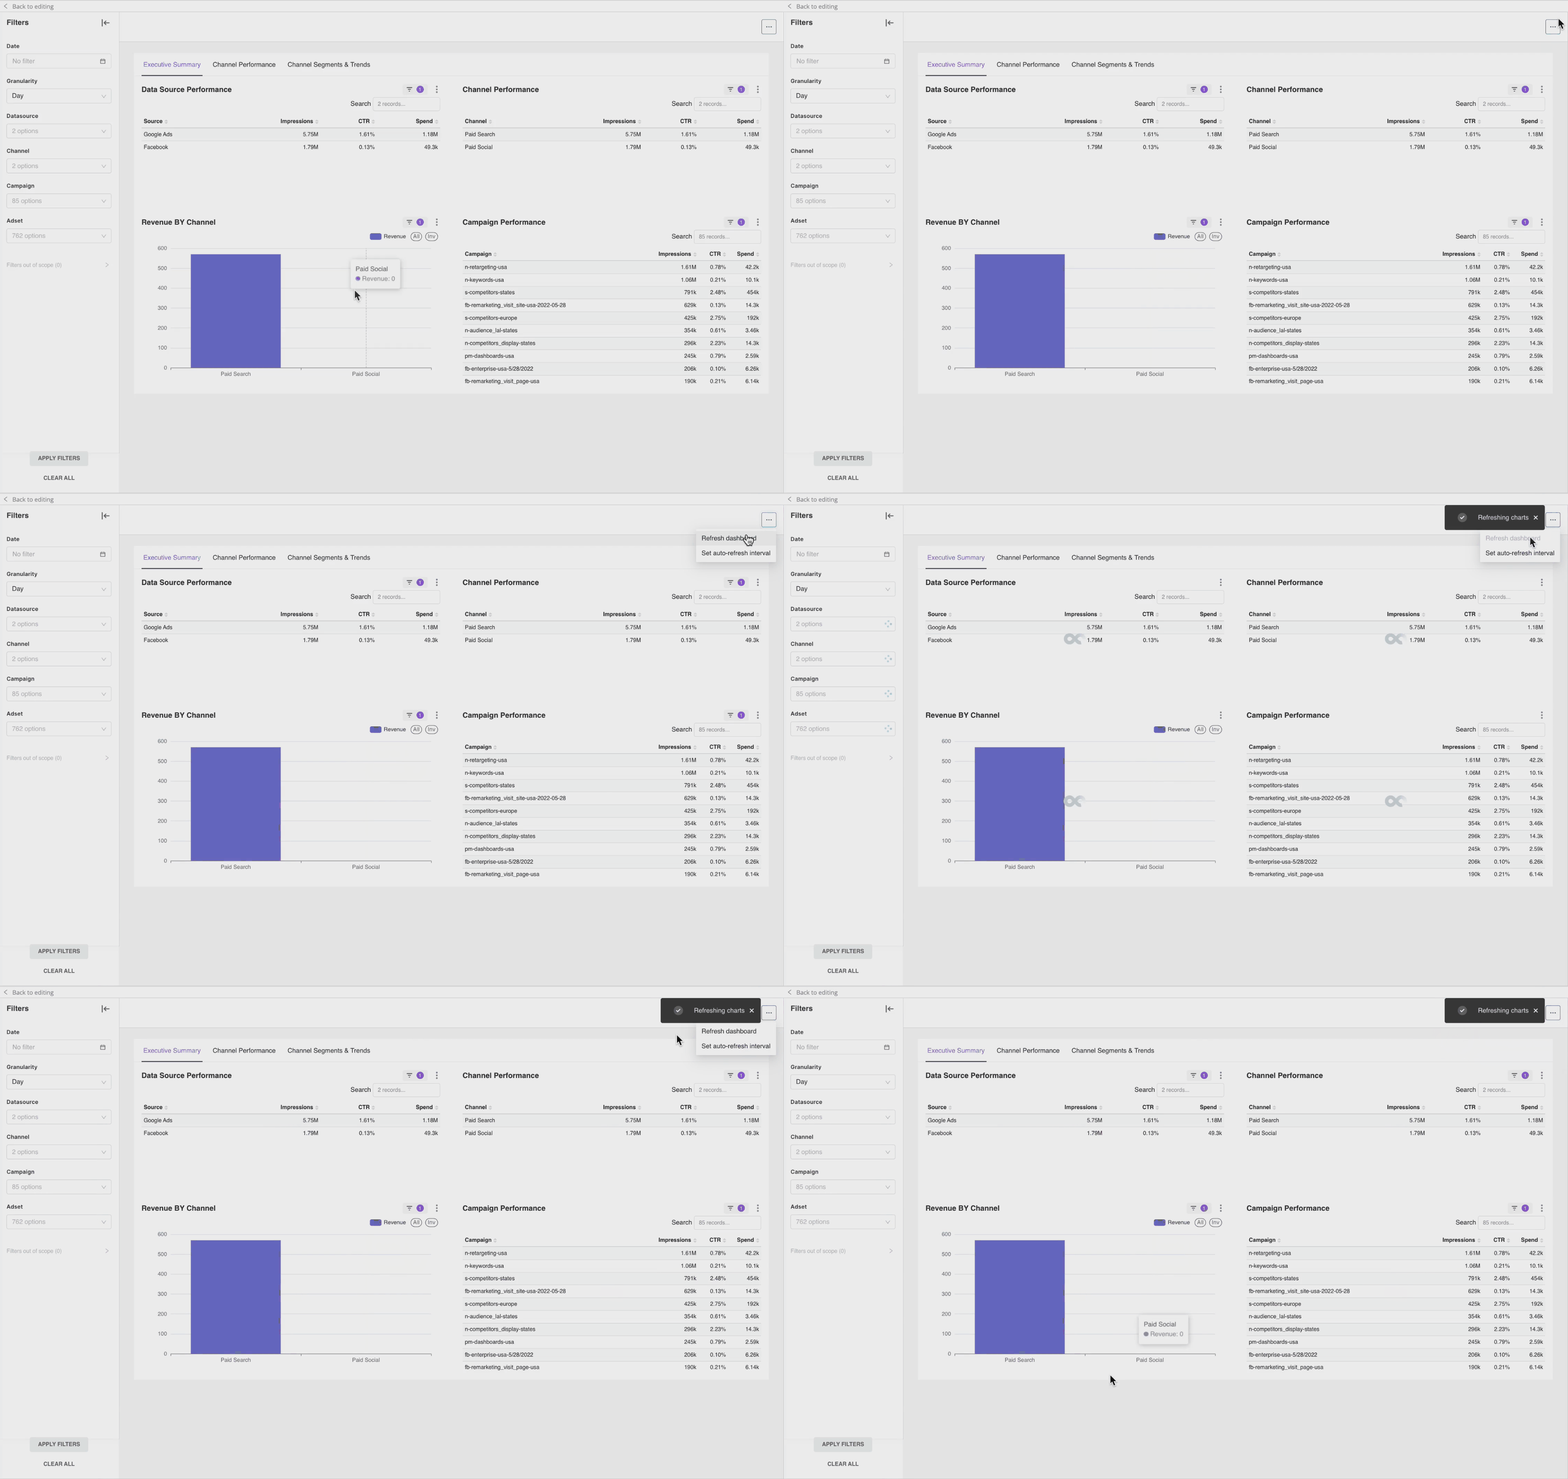
Note: Please be aware that column names in the recipe structure cannot be modified at this time. The dashboard does not yet support dynamic updates to column names, so any changes in the recipe’s column naming will not be reflected in the dashboard.
You can easily share their dashboards with external stakeholders by clicking the Share button in the top-right corner of the dashboard. This generates a public link, allowing individuals outside of Improvado to view the dashboard without requiring access to the platform.
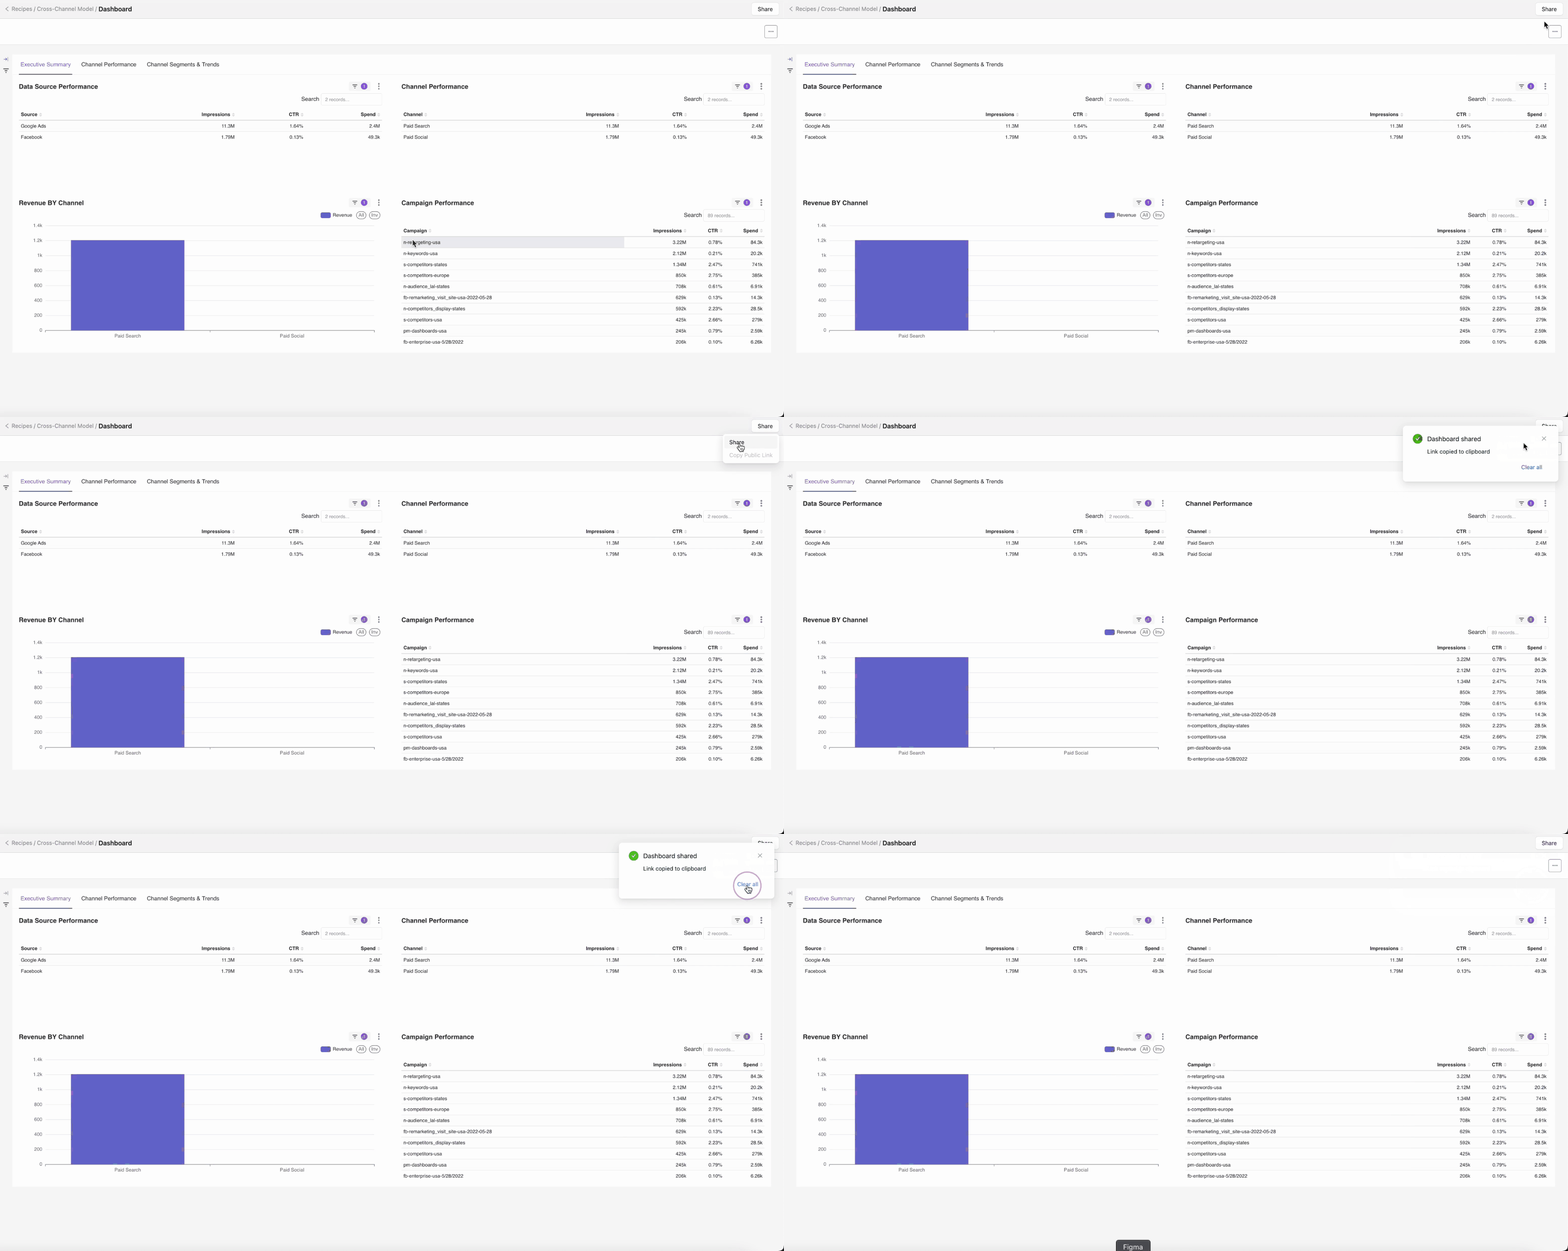
Creating dashboards in Improvado provides a powerful, self-service tool for visualizing data transformations with ease. With automatic updates and real-time refresh capabilities, your insights remain current and ready to support informed decision-making.
Improvado team is always happy to help with any other questions you might have! Send us an email.
Contact your Customer Success Manager or raise a request in Improvado Service Desk.