Digital marketing doesn’t revolve around one particular metric or dashboard. It’s about your core strategy. So don’t just chase the hottest new trend or tool. Going after these ever-changing targets is difficult as an eCommerce brand grows, often becoming untenable when you’ve reached large store status. You’re better off taking a moment and looking at operations as a whole.
Addressing analytics and the needs they target for a large eCommerce store is all about tailoring your efforts and setting expectations for various stakeholders. You’re discussing more than just what’s working. At this level, you’ve got to identify issues and barriers, create data to support changes, and then adjust those changes to the language of relevant departments. It’s a complex mix, and best practices will vary.
So, let’s look at some guiding forces for analytics best practices in eCommerce stores.
Create a change management plan
Analytics offers a variety of options for any store, but they shouldn’t be your first step. The goal of performing analytics is to grow and change. Success here requires a change management plan — covering the analytics you’ll perform, general practices that they’ll impact, and how you’ll follow up on any changes they lead you to make. Don’t let the analytics conversation get stuck at dashboards.
To build an effective change management plan, you’ll need to define stakeholders in related projects and identify when they (or their tasks) are updated based on analysis. For example, if you’re looking at sales data, ask who will be impacted. For each role in outbound and inbound sales, plus search engine optimization and marketing efforts, determine who must approve any task to change. This is easy for smaller companies, but once you hit the enterprise level, many department heads and leads are involved in these changes.
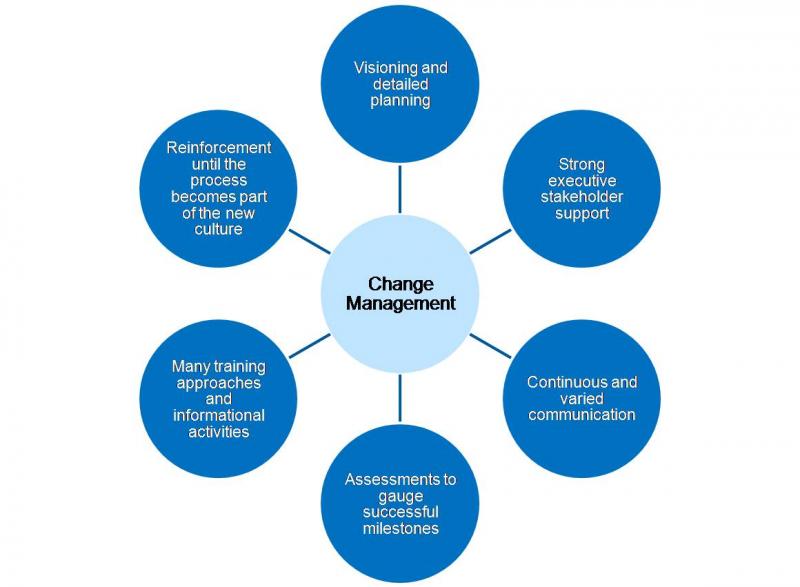
You may not even have the authority to impact a change but are building out recommendations. In this case, your change management plan focuses on what those decision-makers need. Are they swayed most by budgets and ROI calculations? Do they have enough time to implement changes and accomplish other tasks? Are there tech, teams, or mindset limitations that may slow down a change? You’ll need a plan for improvements and changes based on analytics as robust as your plan to capture data and evaluate any analysis.
Select tools based on company goals
It’s easy to overlook some similarities between enterprise eCommerce businesses and new startup eCommerce sites. One of the biggest areas of these overlaps is that many departments are working with tools that complicate analytics or aren’t even meant to deal with tasks you’re working on today. In our experience, a wide range of professionals are stuck with leftovers or work with a module tacked onto a platform that doesn’t have them in mind.
Working within company parameters, you’re often not able to ask for a suite of analytics tools. Instead, you’ll have to present specific use cases and benefits for each requested tool. We’ve seen that the cost-benefit analysis tends to trend positive (in terms of acceptance by decision-makers and budget holders) when you’re first looking to accelerate routine operations for analysts.
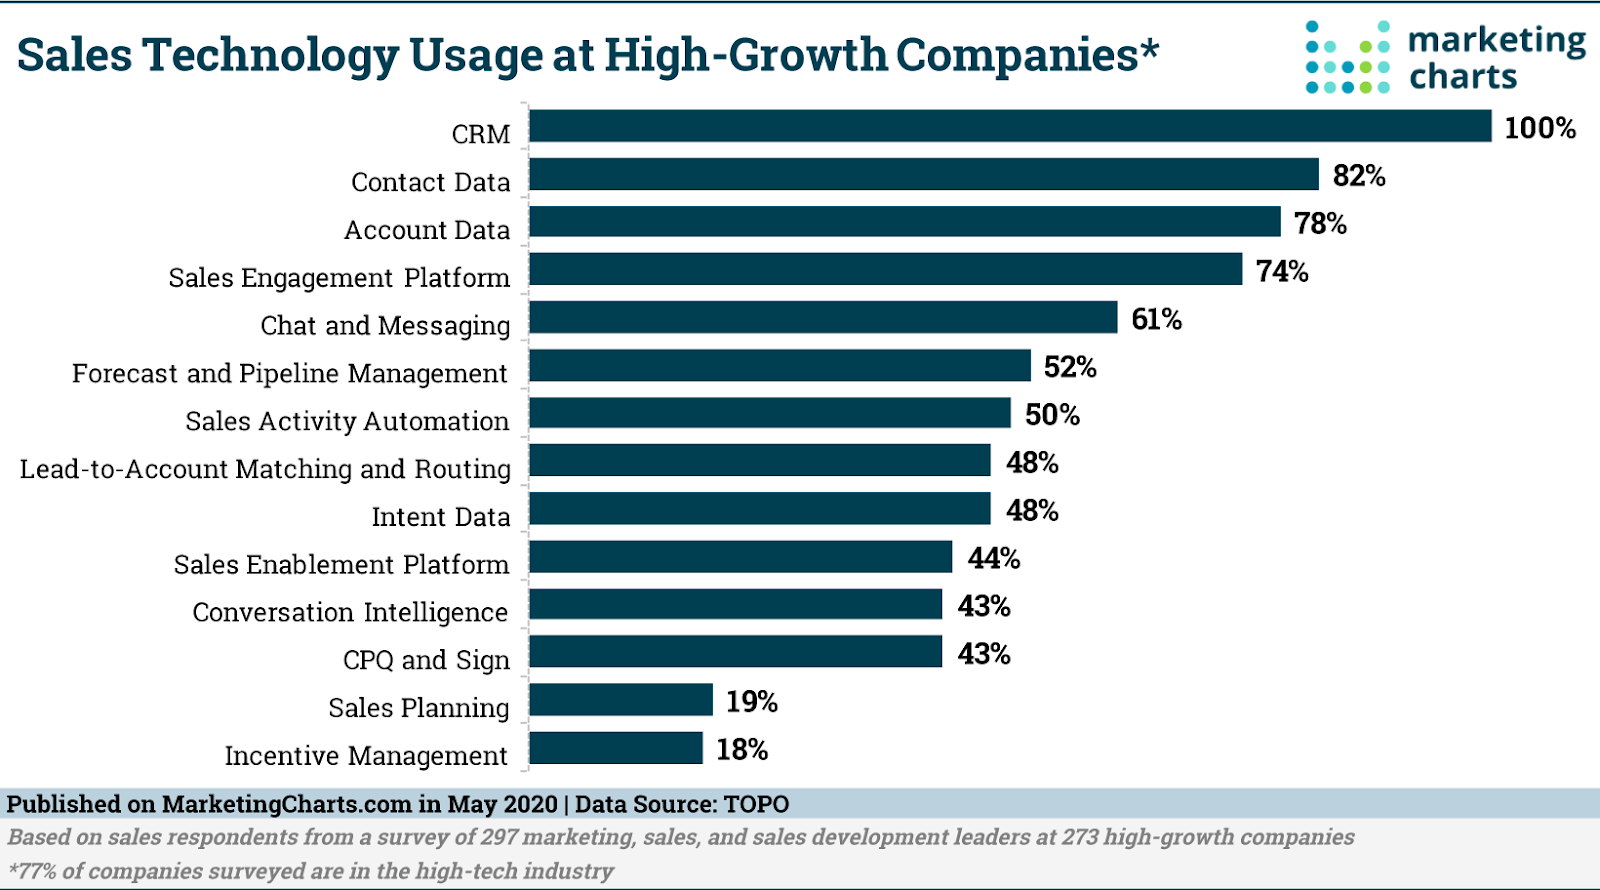
You’re generally working across multiple data sources and visualization platforms at the enterprise level. So, focus on tools that can give you cross-channel reporting capabilities or reduce manual reporting time for your consistent analysis. In this way, you can cut company labor costs and get more time for analytics or KPI management tied directly to revenue streams.
Look for solutions that target your preferred channels and address high-value needs. For example, say social selling is leading your growth. Leverage a tool for processing raw and unstructured data or offering sentiment analysis may give deeper insight into why someone is buying from you compared to simply tracking hashtags.
Be strategic to gain insight
The trick for analytics professionals is to ensure that their activities relate directly to larger company needs, often around cost savings. While that’s been said time and again, we still regularly hear from professionals that they have not looked outside of department stakeholders for guidance on where tools specifically can have an impact.
Sometimes, the best investment isn’t a new dashboard or analytics tool but a platform that can aggregate data in one place, remove data silos, and accelerate departments’ interaction with insights.
Chasing expensive or shiny solutions, such as natural language processing tools for marketing activities, may drastically increase your marketing spend and not even yield any results. Prioritize ways to improve the online business areas of importance, not just the checkout page, with granular product data and company understanding.
Create a deeper understanding of customer value
No one reading this needs to be convinced of the value of tracking CLV or CRR. You know that they’re the lifeblood of an analytics program You’re also likely tracking them to compare against acquisition costs so that you’ve got a quick determination of when you hit positive ROI per new customer.
Retention rates then help allocate ad budgets and overall marketing spend to ensure you’re maintaining a robust enough sales pipeline to offset any churn.
If you’re unsure how to get started or want to refresh your data, look to your existing marketing platforms for their built-in tools or calculators.
HubSpot has a free metrics calculator that can track these and other performance indicators. Tools like this are a good place to verify the formulae you’re using and start thinking about how to build a holistic picture of your perforamnce with all of these metrics.
The challenge with HubSpot and some others is that they’ve got the right data, but visualization and the actualanalytics either aren’t supported or can be exceedingly difficult to automate within the platform. If you need more advanced analytics, search for integration partners that both automate the data capture and combine it with information from other sources.
CLV is a straightforward calculation for most. It’s the average lifespan of your customer multiplied by the average customer value. This customer value metric is the number of purchases a customer makes on average multiplied by the average order value.
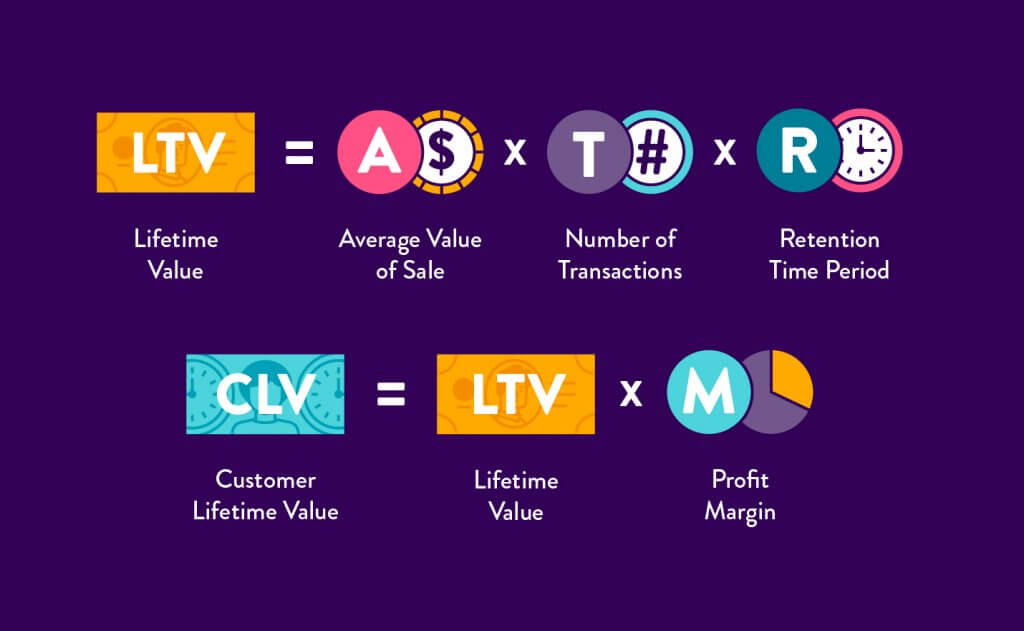
CRR is another easy calculation. Pick a length of time and look at customer purchases in that timeframe. Sort your CRM to identify customers in this time period that either made multiple purchases or had bought from you before the time period. Take that set of customers and divide by the total number of customers who bought from you during the time period.
Improving returns for your target audience
Many enterprises can step up their game here by combining CLV and CRR with a focus on the value you’re creating for the customer. This analysis will push you to think beyond just spending and cost. Thankfully, your most valuable content is often gated behind a form or delivered via email. This links actions back to accounts where you can track customer requests for help, additional downloads, sales, and ratings if you send out surveys or collect NPS scores.
Use your CRM to identify average companies and positive outliers, then open their accounts to look at your data spread. Does a higher CLV track with an older customer or one who is purchasing a certain set of goods? Do they submit more service requests or have better service metrics, such as faster complaint resolution times? Where would these shoppers be captured in your CRR metrics — do they shop during the year-end holidays or your peak season? Are they prolific buyers each month?

The analysis here will help you focus on when, specifically, a customer brings value and what you do that’s valuable to your most important shoppers. You may identify times when you can reduce ad spending and CRR drops for a few months but then ramp up for peak and yield the same or higher purchases with less spend. Or, as many enhanced eCommerce companies transition to the enterprise level, you may identify that your customers have shifted to purchasing year-round with an eye toward deals and new editions.
For CLV and CRR, adapting to the trends you spot may impact one positively while the other changes negatively. However, having a unified understanding of how these metrics interact and how outside forces, such as support and seasonality, impact them can help determine when a change is more beneficial for the company.
Explore 7 Smart Ways to Improve Ecommerce Customer Data Collection
Dive deep into conversion rate
While most enhanced eCommerce stores know the importance of the conversion rate, many stick to the surface level of understanding, without going deeper than A/B testing things like button color or what percentage in a discount overcomes an objection. Analytics should consider the user journey on your site to see what landing pages cause them to leave and exit the sales process.
A great place to start is using heat mapping technology to see if navigation is easy and better understand how people use your site. Heatmaps are visualizations of site activity or specific actions, highlighting the most popular places where your audience engages and what doesn’t get a click.
There are different types of heatmaps that track different actions. For example, click maps show where users click on a landing page, while mouse hover maps show how users move their cursor to understand where they’re looking. Scroll maps can be good general tools because they show you how far down your audience scrolls — move up important sections to places where nearly everyone can see them!

These tools help you understand which elements from your landing pages resonate with your audience or users stop acting within the funnel. Combining this with bounce rates, session duration time, and referral analysis can help you determine what exact factors drive conversions.
The ad that generates a lot of clicks paired with a landing page that fails to convert is a waste of your marketing budget.. In this case, mouse hover maps may indicate that people aren’t seeing the conversion CTA. A tweak here means you can A/B test an adjustment versus a new landing page to see if you can capture your audience with the planned message.
One place to study regularly is your checkout page and process. Watch where people click and scroll, and when they leave. You may identify that they leave at the point a new fee is explained, prompting you to add pricing estimates in your carts from the beginning. A scroll map on an overly complex form might show your audience gives up when they’re halfway done filling things out.
Clicks are important. You’ll want to think broadly about this metric. For instance, if users are regularly clicking for customer service help, but your help desk wait time is always 3 minutes or more, reducing that time could be a way to secure sales. But, if response times are immediate, you may want to dive into the chatbot or agent logs to learn the questions people ask and see where you’re losing them.

The best option here is torefine your analysis with an extra layer of data. You’re after potential reasons for action so that your business intelligence efforts create a reliable response. Heatmaps are a great place to start, and you’ve got a lot of options. Among your options are the classic Hotjar, AI-focused Contentsquare, mouse and keystroke maven Mouseflow, Lucky Orange with its in-depth chat integrations, and Smartlook which has reliable tools for engagement tracking.
Evaluate the value of returns
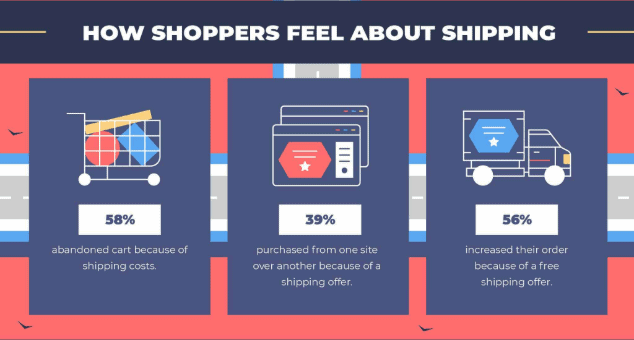
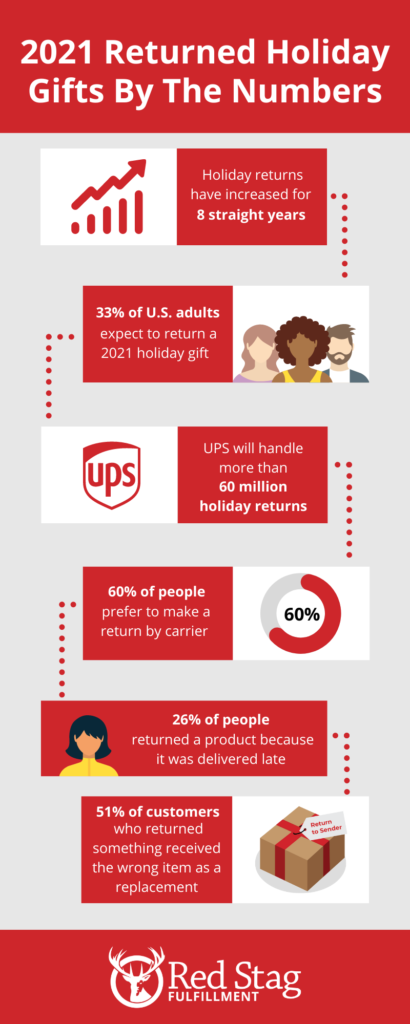
Returns are a fact of life in eCommerce store operations, and the higher you scale, the more you should expect them. The 2021 holiday season was the largest for eCommerce sites so far, but eCommerce website returns increased too, with one-third of American adults expecting to return something. This makes returns a great example for learning when to consider operations in your analysis.
Baseline analysis may look at the increase in returns and see a reason to cancel a policy or avoid those products. However, mixing in data from studies about return policies would shift approaches because a high-quality returns policy that’s easy for customers to use often correlates with increased sales and a higher CRR.
The important analysis is determining what returns can cost you and how to minimize that. For instance, in one of the reviews linked above, a survey asking consumers who have returned a product before found that more than half received the wrong item as a replacement. In this case, the original return isn’t the biggest drain on capital. Improper operations mean the company is paying for at least three shipments — wrong item there and back, then a third and hopefully correct shipment to the customer — instead of just getting the correct item to the customer.
Mistakes outside of product quality itself often drive returns expenses. When you’ve identified returns and are analyzing company returns policies, don’t neglect operational effects. A warehouse struggling to fill orders correctly or routinely damaging inventory ahead of final delivery will drive up labor, per SKU, receiving, and materials costs.
Substantial returns and related errors also require more physical space in a warehouse, which limits revenue potential relative to square footage. With warehouse space at a premium across the U.S., this also can be a growth-limiting concern. Low order accuracy rates and issues with returns management may be an entrance into a deeper analysis of the value of outsourcing to reduce errors and protect revenue.
Wrapping up
Your enhanced eCommerce brand’s exact mix of tools and best practices are unique to your store. Once you reach the large or enterprise stage, a tool that can integrate and share with others can be just as important as one with a model for the latest trend. Some time-tested methods give a broader understanding, such as heatmaps and CRR tracking, but you’re at a stage where any list of specific tweaks will have a limited application.
Today’s analytics experts at companies like yours are working to build big-picture models that integrate across your verticals. They’re creating a company-level understanding so that solutions can be put in terms that leadership and stakeholders are willing to back. Turning analytics into action is storytelling, and your best practices should focus on building the data and business intelligence you need to craft a compelling tale.
.png)


.png)
