

The best ecommerce analytics tools for 2026 include Google Analytics 4 and Adobe Analytics for cross-channel tracking, Improvado and Supermetrics for unified reporting across 1,000+ sources, and Glew, DataHawk, and Triple Whale for ecommerce-specific attribution. This guide ranks all 14 by pricing, hidden costs, and where each one breaks at scale. Market context for this choice is in ecommerce trends for 2026.
Key Takeaways:
• Decision matrix maps 14 tools against company size, technical resources, and primary use case with explicit trade-offs.
• Hidden cost breakdown shows true TCO beyond list pricing, integration hours, API overages, consultant fees.
ASUS needed a centralized platform to consolidate global marketing data and deliver comprehensive dashboards and reports for stakeholders.
Improvado, an enterprise-grade marketing analytics platform, seamlessly integrated all of ASUS’s marketing data into a managed BigQuery instance. With a reliable data pipeline in place, ASUS achieved seamless data flow between deployed and in-house solutions, streamlining operational efficiency and the development of marketing strategies.
"Improvado helped us gain full control over our marketing data globally. Previously, we couldn't get reports from different locations on time and in the same format, so it took days to standardize them. Today, we can finally build any report we want in minutes due to the vast number of data connectors and rich granularity provided by Improvado.
Improvado saves us about 90 hours per week and allows us to focus on data analysis rather than routine data aggregation, normalization, and formatting."

The Problem with Manual Reporting
To overcome silos, many teams resort to manual reporting. This involves exporting CSV files from each platform and painstakingly combining them in spreadsheets.
This process is not only incredibly time-consuming but also highly prone to human error. Data gets misaligned, formulas break, and by the time the report is ready, the information is already outdated. It's an inefficient and unreliable way to manage critical business data.
Before Improvado, preparing reports at Signal Theory was a labor-intensive process, often taking four hours or more per report. Switching to Improvado reduced that time by over 80%, making reporting significantly more efficient and far less stressful.
"Reports that used to take hours now only take about 30 minutes. We're reporting for significantly more clients, even though it is only being handled by a single person. That's been huge for us.”

Key Features to Look For in Ecommerce Analytics Software
When evaluating different ecommerce analytics tools, certain features are critical for driving meaningful growth. Look for a platform that moves beyond simple reporting and provides a robust foundation for deep, actionable analysis.
Data Integration and Connectors
The platform's ability to connect to all your data sources is paramount. Look for a tool with a wide library of pre-built connectors for ecommerce platforms (Shopify, BigCommerce), advertising networks (Google, Facebook, TikTok), email marketing tools, and more.
The best solutions automate the complex ETL processes required to pull, clean, and load this data for analysis.
Real-Time Dashboards and Visualization
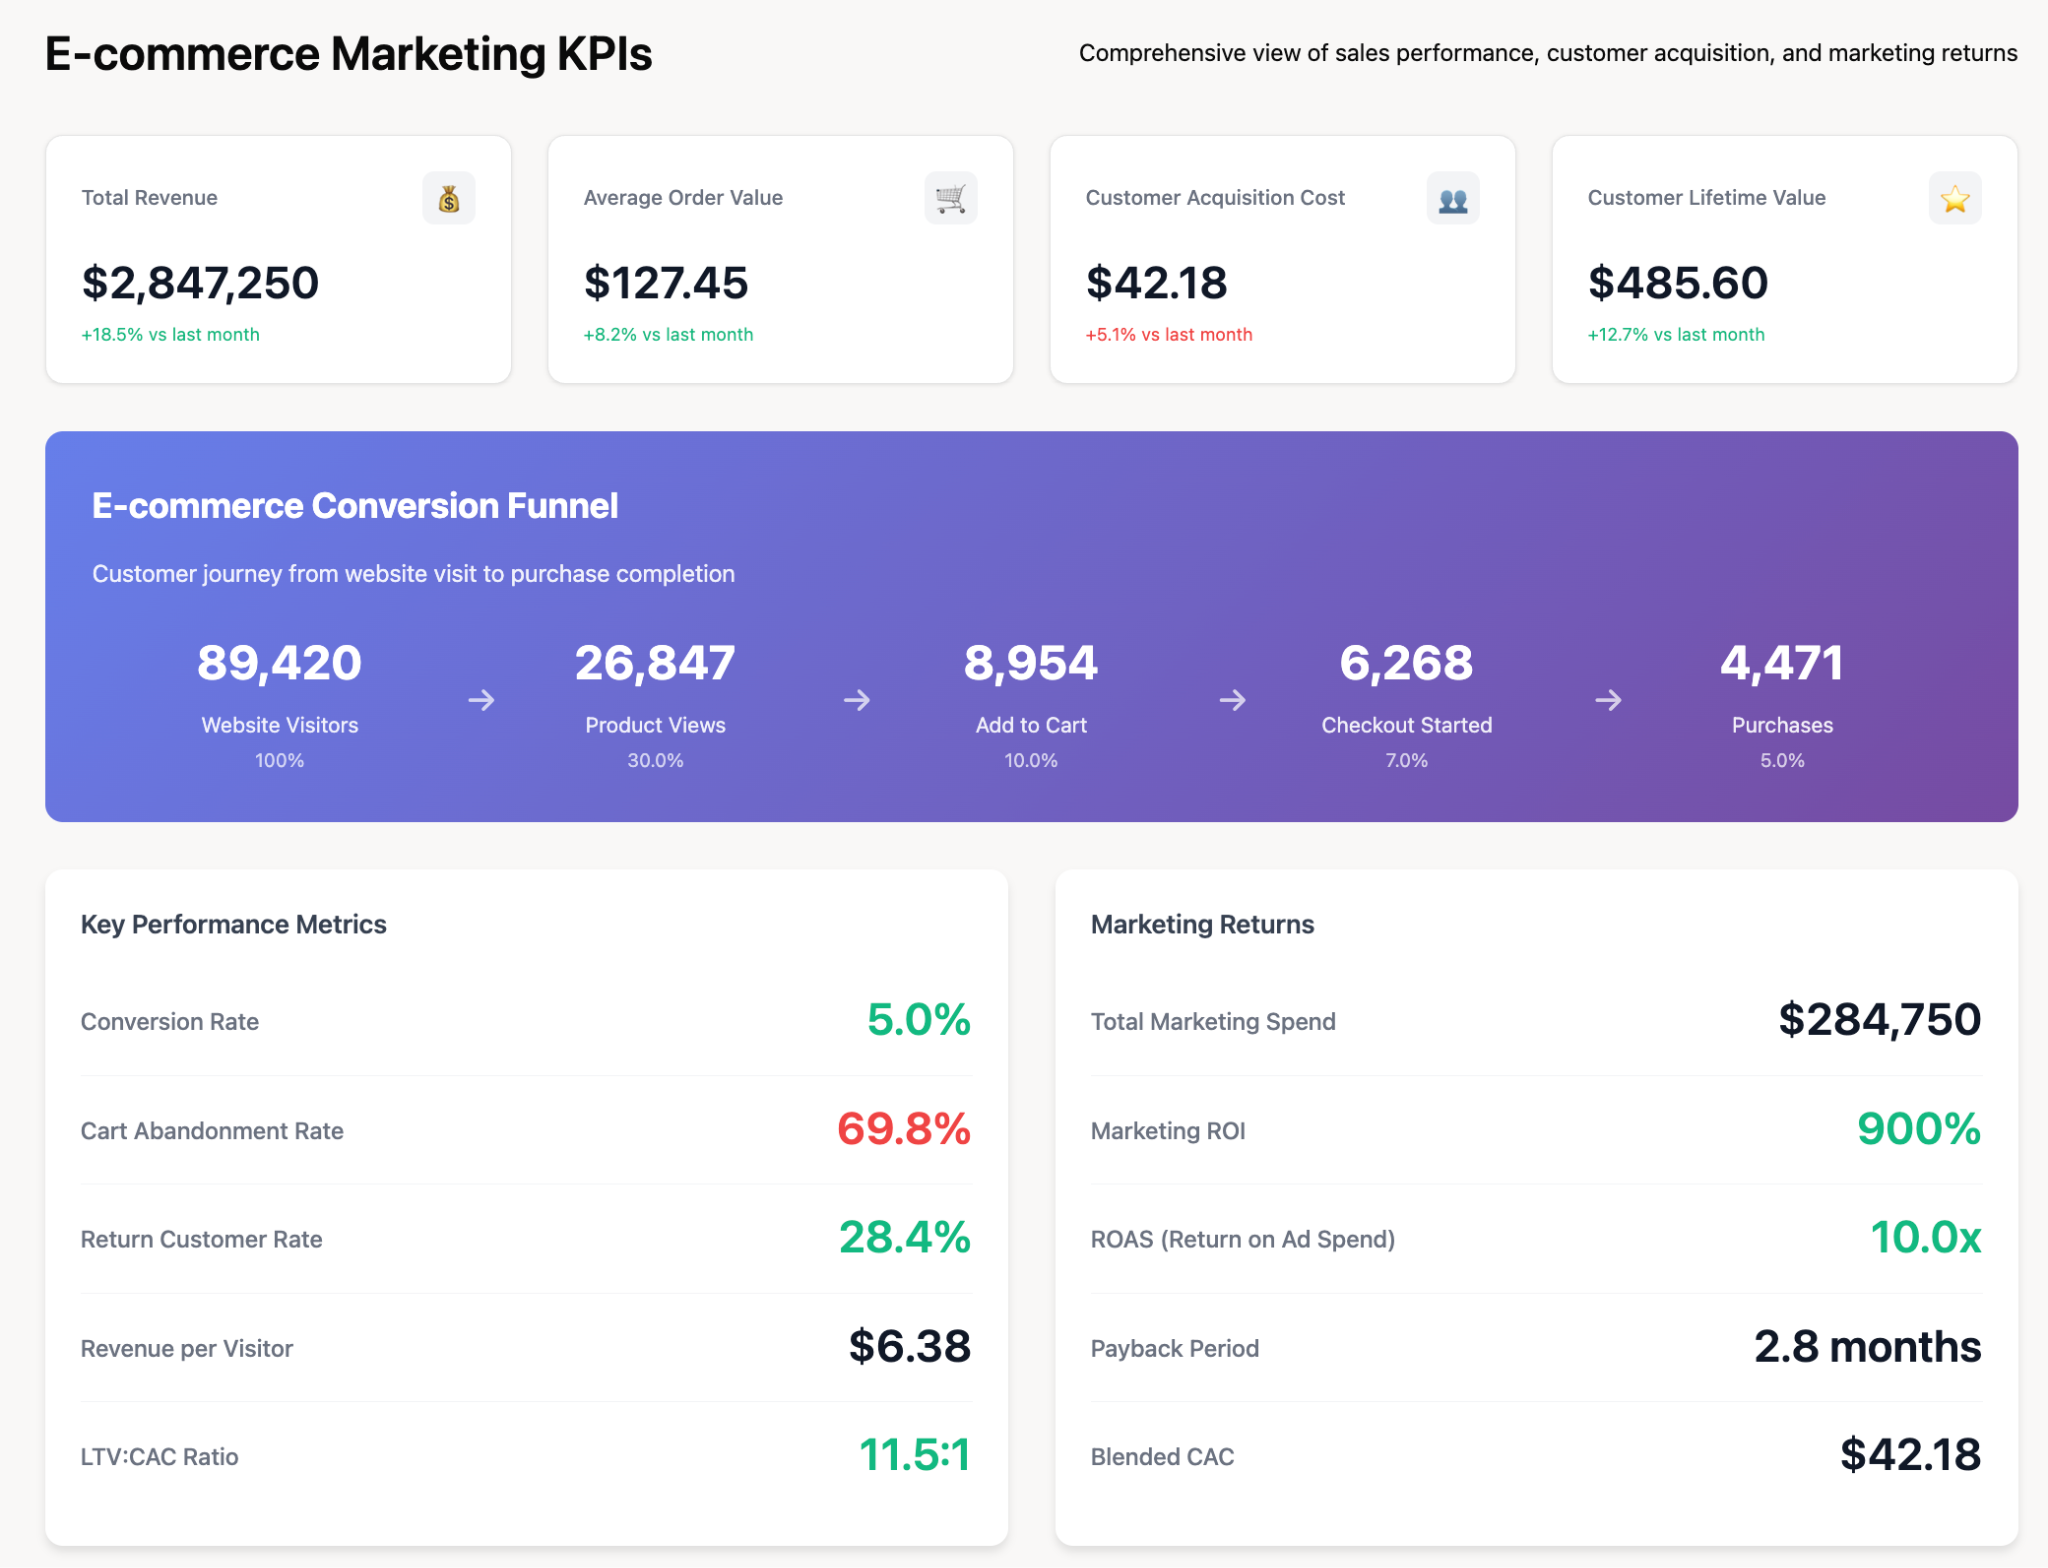
Data is only useful if you can understand it. Top-tier tools offer customizable, easy-to-read dashboards that visualize key metrics. These should be updated in near real-time, allowing you to monitor performance and react quickly to trends or anomalies.
The ability to drill down into reports is crucial for uncovering the "why" behind the numbers.
Customer Journey Mapping
Understanding the complete path a customer takes before purchasing is vital. Look for features that allow you to map and visualize multi-touchpoint journeys.
This helps you see how different channels work together to influence conversions and provides insights into where you can improve the customer experience.
Product and Sales Performance Analytics
Your tool should offer granular insights into product performance. This includes tracking sales by SKU, category, or brand. It should also help you analyze profitability, identify product bundling opportunities, and manage inventory more effectively. Metrics like average order value (AOV) and items per order are essential here.
Marketing Attribution
Which marketing efforts are actually driving sales? An effective analytics tool helps you move beyond last-click attribution. It should support various marketing attribution models, allowing you to assign proper credit to each touchpoint in the customer journey and optimize your ad spend accordingly.
1. Google Analytics
Best for: Event-based tracking and analysis of user behavior across websites and apps.
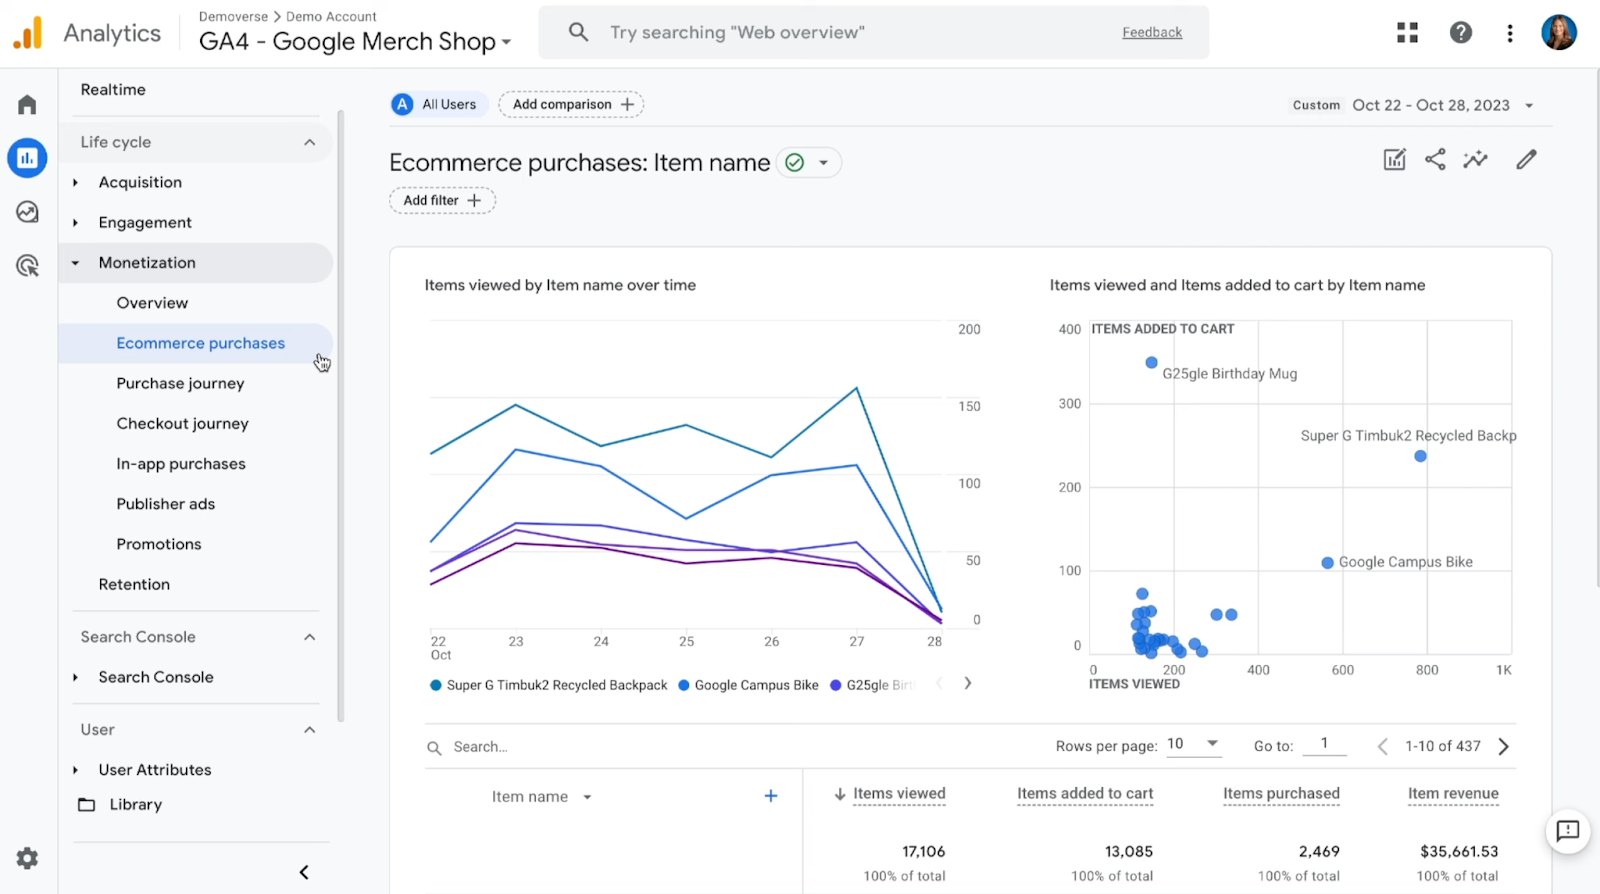
Google Analytics 4 (GA4) is a powerful tool for tracking and analyzing ecommerce performance. Its event-based tracking system provides deep insights into user behavior across websites and apps, helping brands understand their customer journey, optimize conversions, and maximize ROI.
GA4’ ecommerce-specific features:
- Event-Based Tracking: GA4’s event-driven model tracks specific user interactions, such as product views, add-to-cart events, and purchases, providing a more precise and comprehensive view of customer behavior compared to session-based tracking.
- GA4 Ecommerce Tracking: Offers dedicated ecommerce tracking capabilities, allowing businesses to monitor product impressions, promotions, checkout steps, and transactions, making it easier to identify areas for improvement in the sales funnel.
- Enhanced Ecommerce Reporting: Includes pre-configured reports on product performance, customer purchase behavior, and sales funnels, helping brands identify bottlenecks and optimize conversions.
- Cross-Platform Insights: Tracks user journeys seamlessly across devices and platforms, providing a unified view of customer behavior, critical for multi-channel ecommerce strategies.
- Predictive Analytics: Uses machine learning to generate predictive metrics like purchase probability and expected revenue, enabling businesses to anticipate customer actions and allocate resources effectively.
- Audience Segmentation: Allows ecommerce brands to create highly detailed audience segments based on purchase behavior and other interactions, enabling precise retargeting and personalization.
- Integration with Ads Platforms: Connects seamlessly with Google Ads, enabling brands to measure ad performance directly against ecommerce outcomes, such as sales and ROI.
2. Improvado
Best for: Simplifying data management, improving performance visibility, and maximizing the efficiency of their ecommerce marketing efforts.
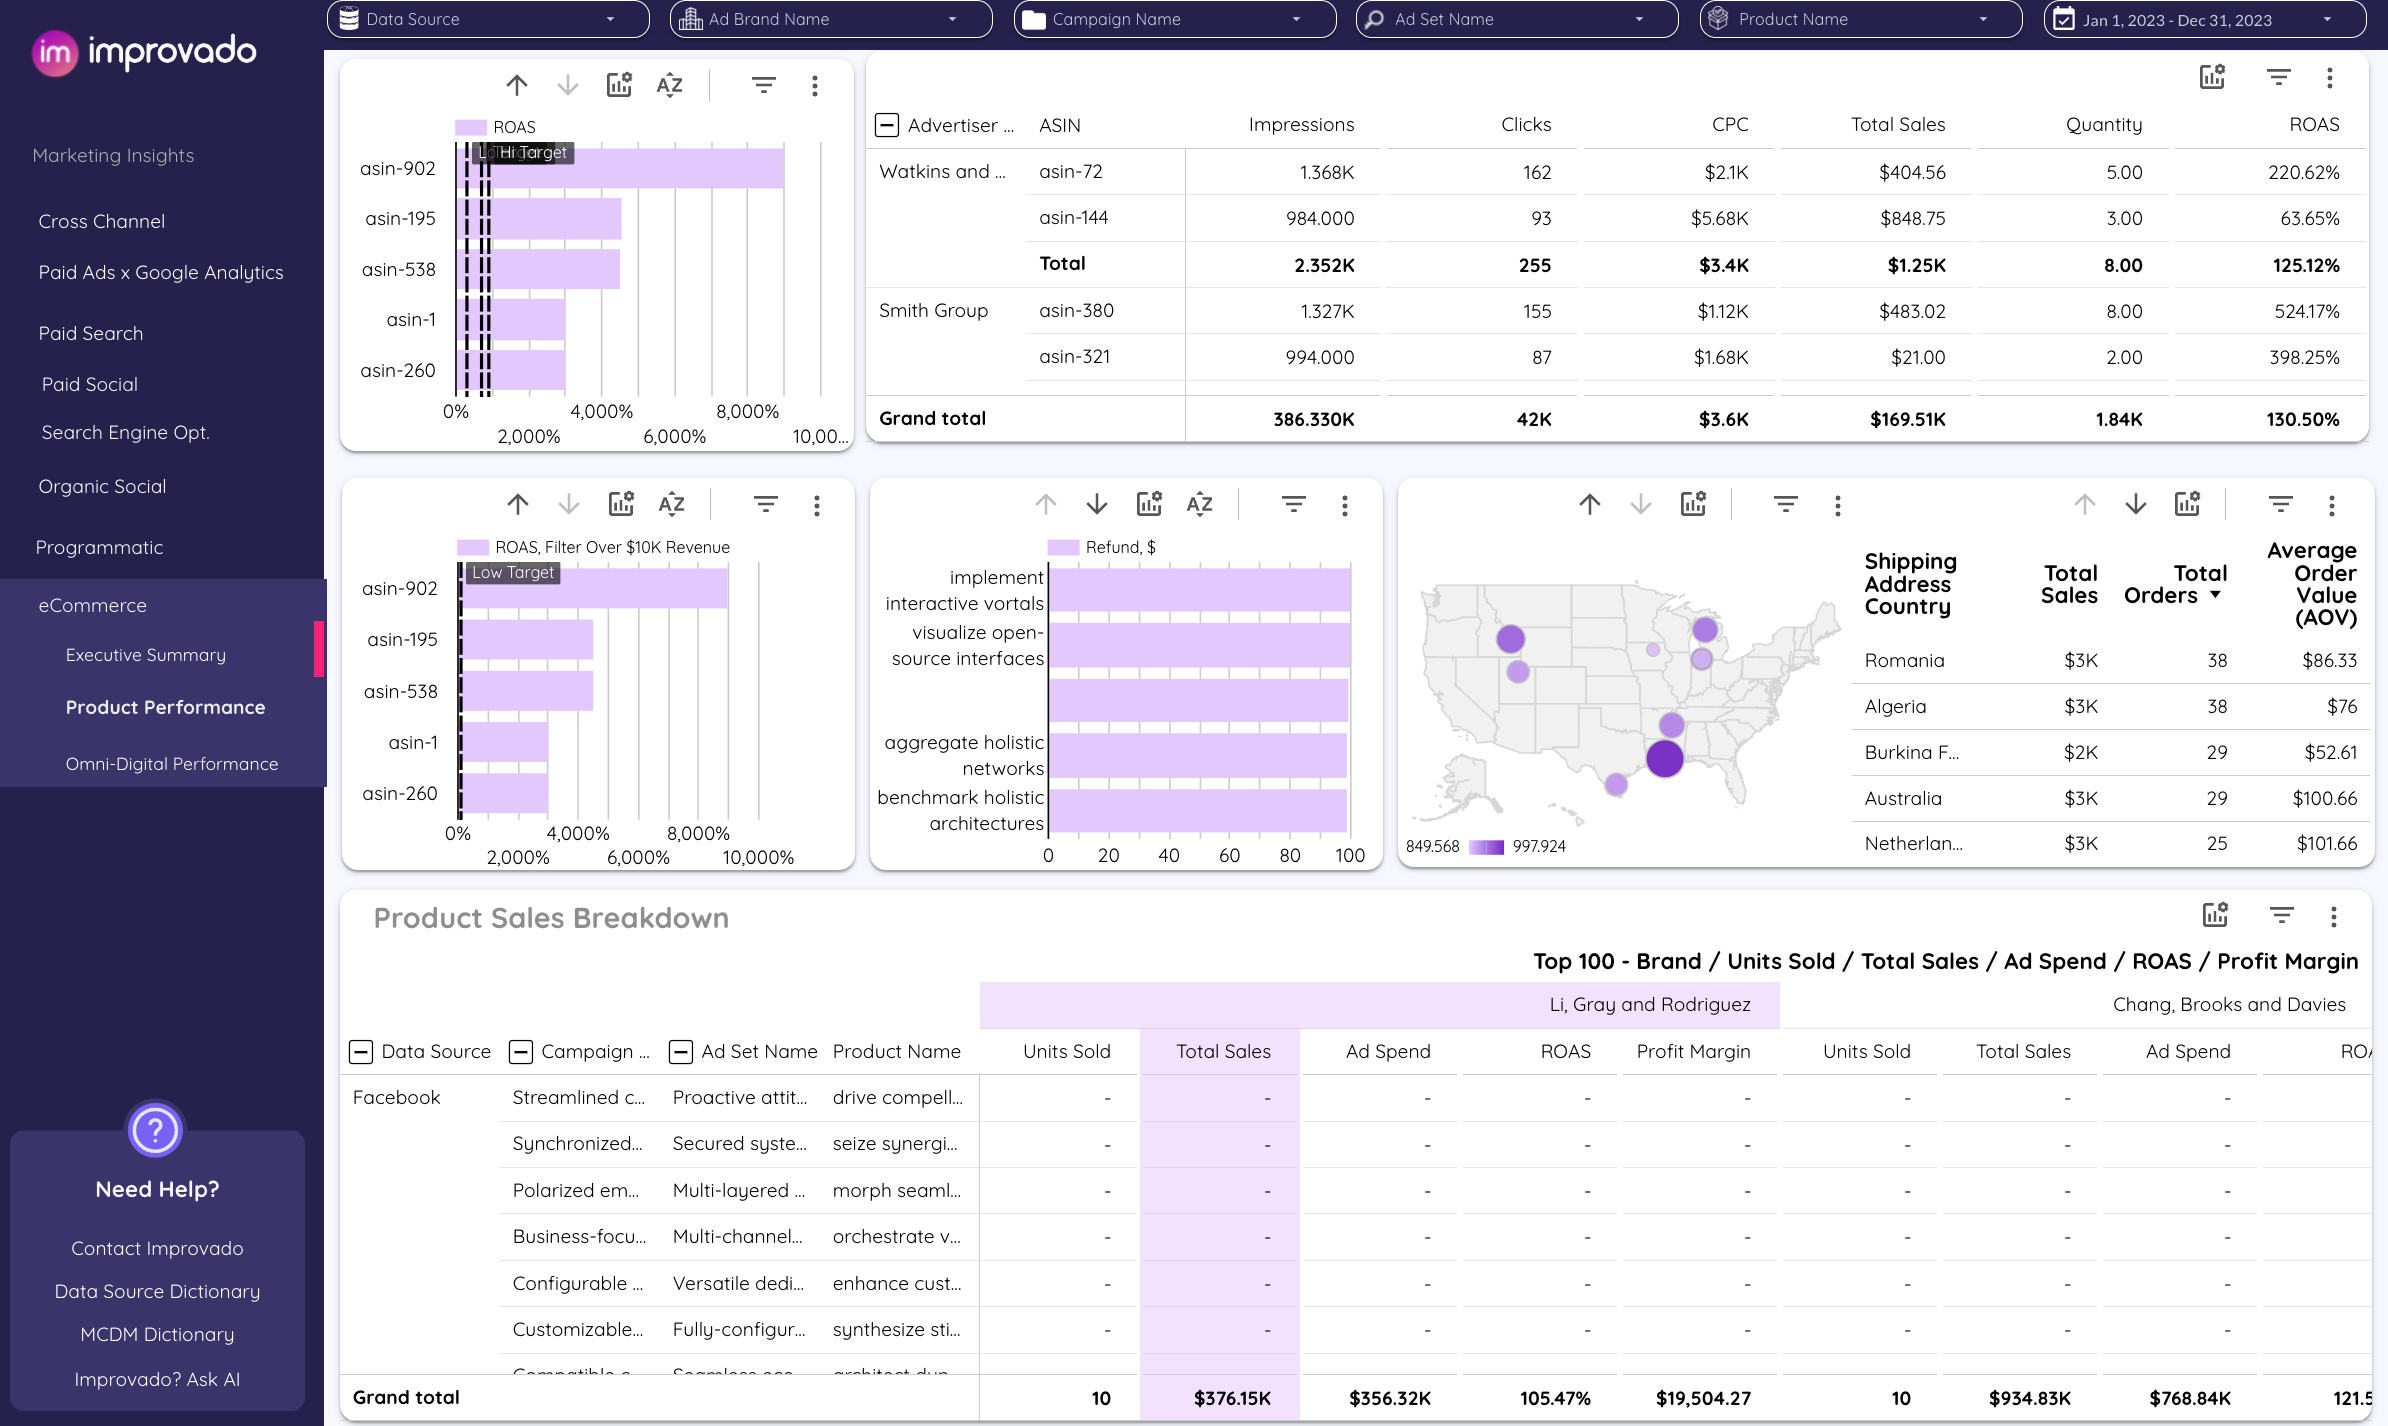
Improvado is a marketing analytics solution tailored to meet the specific needs of ecommerce businesses. The platform streamlines data collection, harmonization, and visualization, helping brands gain a holistic view of performance and optimize strategies.
Key features:
- Comprehensive Data Integration: Improvado seamlessly integrates with 500+ platforms, including major ecommerce tools like Amazon Analytics, Walmart Connect, Shopify, eBay, Awin, and custom online and offline solutions, ensuring seamless data aggregation for a complete view of performance.
- Scalable Data Harmonization: Harmonizes marketing and sales data from multiple sources into a standardized format, eliminating inconsistencies and ensuring accurate reporting across campaigns and platforms.
- Customizable Dashboards: Improvado provides pre-made dashboard templates or builds tailored dashboards to monitor key ecommerce metrics and KPIs in a setup that works specifically for your business.
- Real-Time Performance Tracking: Improvado provides a robust solution for marketing campaigns performance, brand safety, and data compliance tracking. It monitors adherence to pre-defined rules, paces metrics, and issues alerts for any anomalies, problems, or metrics drips. This solution enables ecommerce brands to adjust strategies quickly in response to market trends.
- Cross-Channel Attribution: Improvado establishes a unified tracking infrastructure that captures every customer interaction across all campaigns and channels, including granular conversion and event tracking. Using common single-touch and multi-touch attribution models and custom ones, Improvado analyzes the impact of various touchpoints, helping businesses allocate ad spend effectively and maximize ROI.
3. Glew
Best for: Analyzing ecommerce product data and customer behavior to optimize operations and increase revenue.
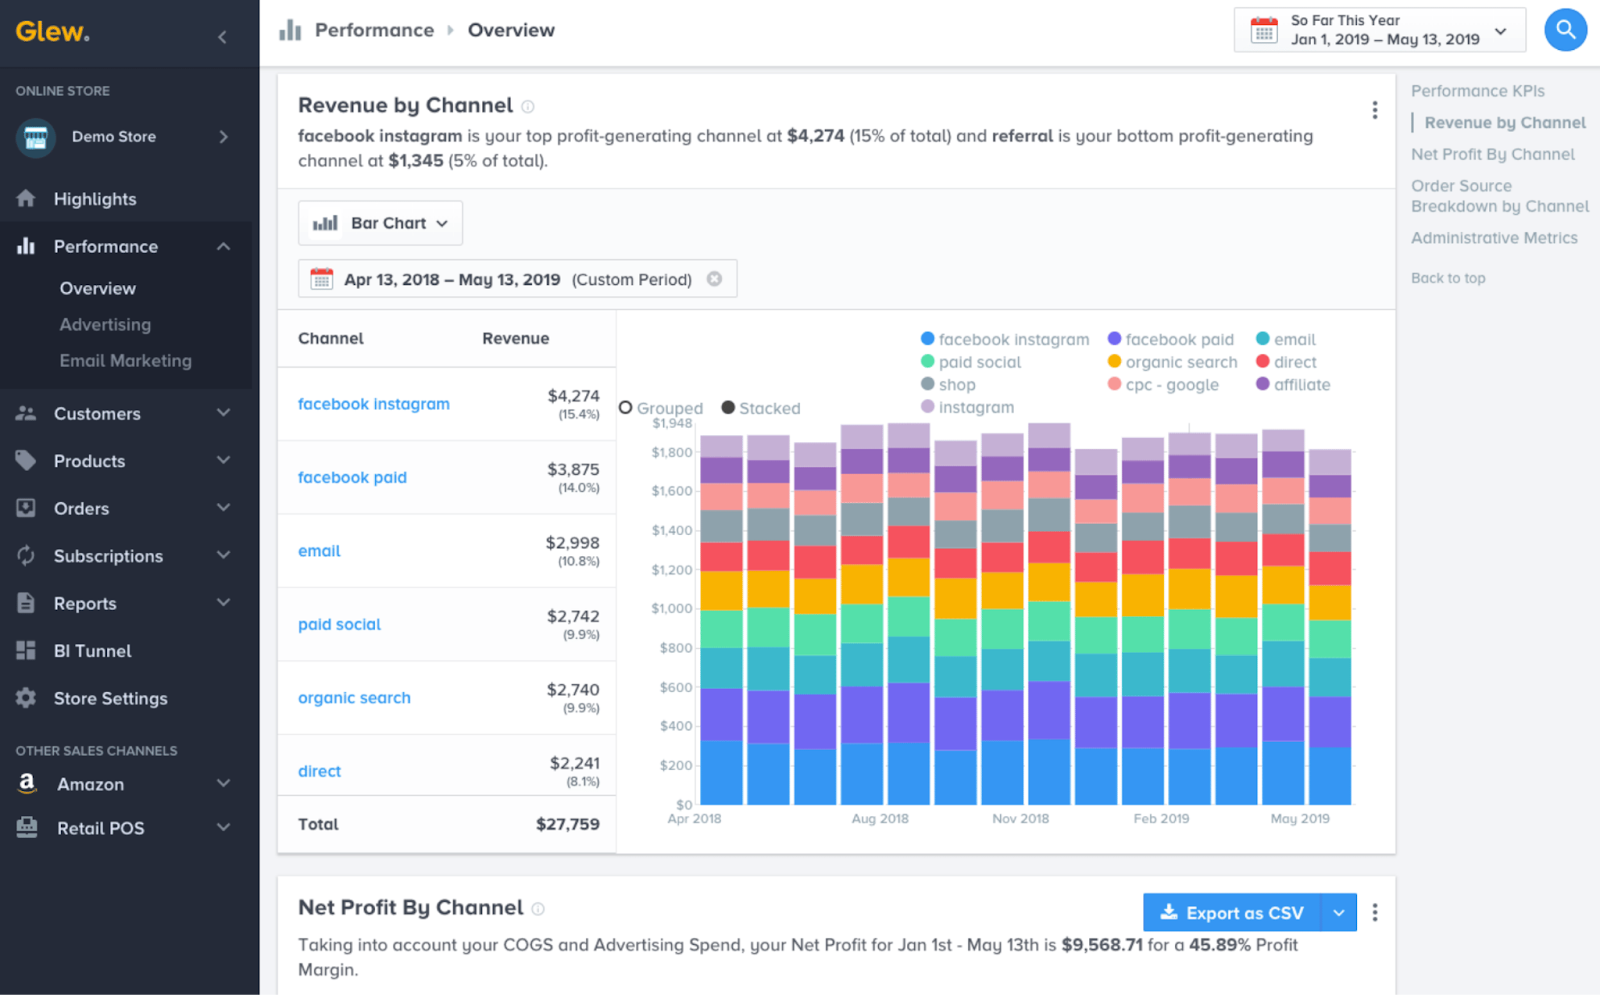
Glew is an ecommerce business intelligence and analytics platform. With industry-tailored features, it provides in-depth ecommerce insights on product performance, customer behavior, and marketing effectiveness.
Key features:
- Customer Insights: Glew offers detailed reports on customer behavior, segmentation, and lifetime value (LTV), helping brands focus on their most profitable audiences.
- Product Performance Analytics: Tracks sales, margins, and inventory for each product, enabling an ecommerce store to identify top-performing items and optimize inventory management.
- Marketing Performance Metrics: Glew provides insights into marketing ROI, campaign effectiveness, and customer acquisition costs, helping refine strategies across channels.
- Integrations with Ecommerce Reporting Software: Seamlessly connects with platforms like Shopify, BigCommerce, and WooCommerce, unifying data for easier analysis.
- Profitability Analysis: Glew breaks down profitability by product, channel, or customer segment, giving a clear picture of what drives the most value for the business.
- Automated Reporting: Generates customizable reports that highlight key metrics, ensuring teams stay informed without manual effort.
4. Mixpanel
Best for: Advanced real-time event-based analytics of the purchase journey.
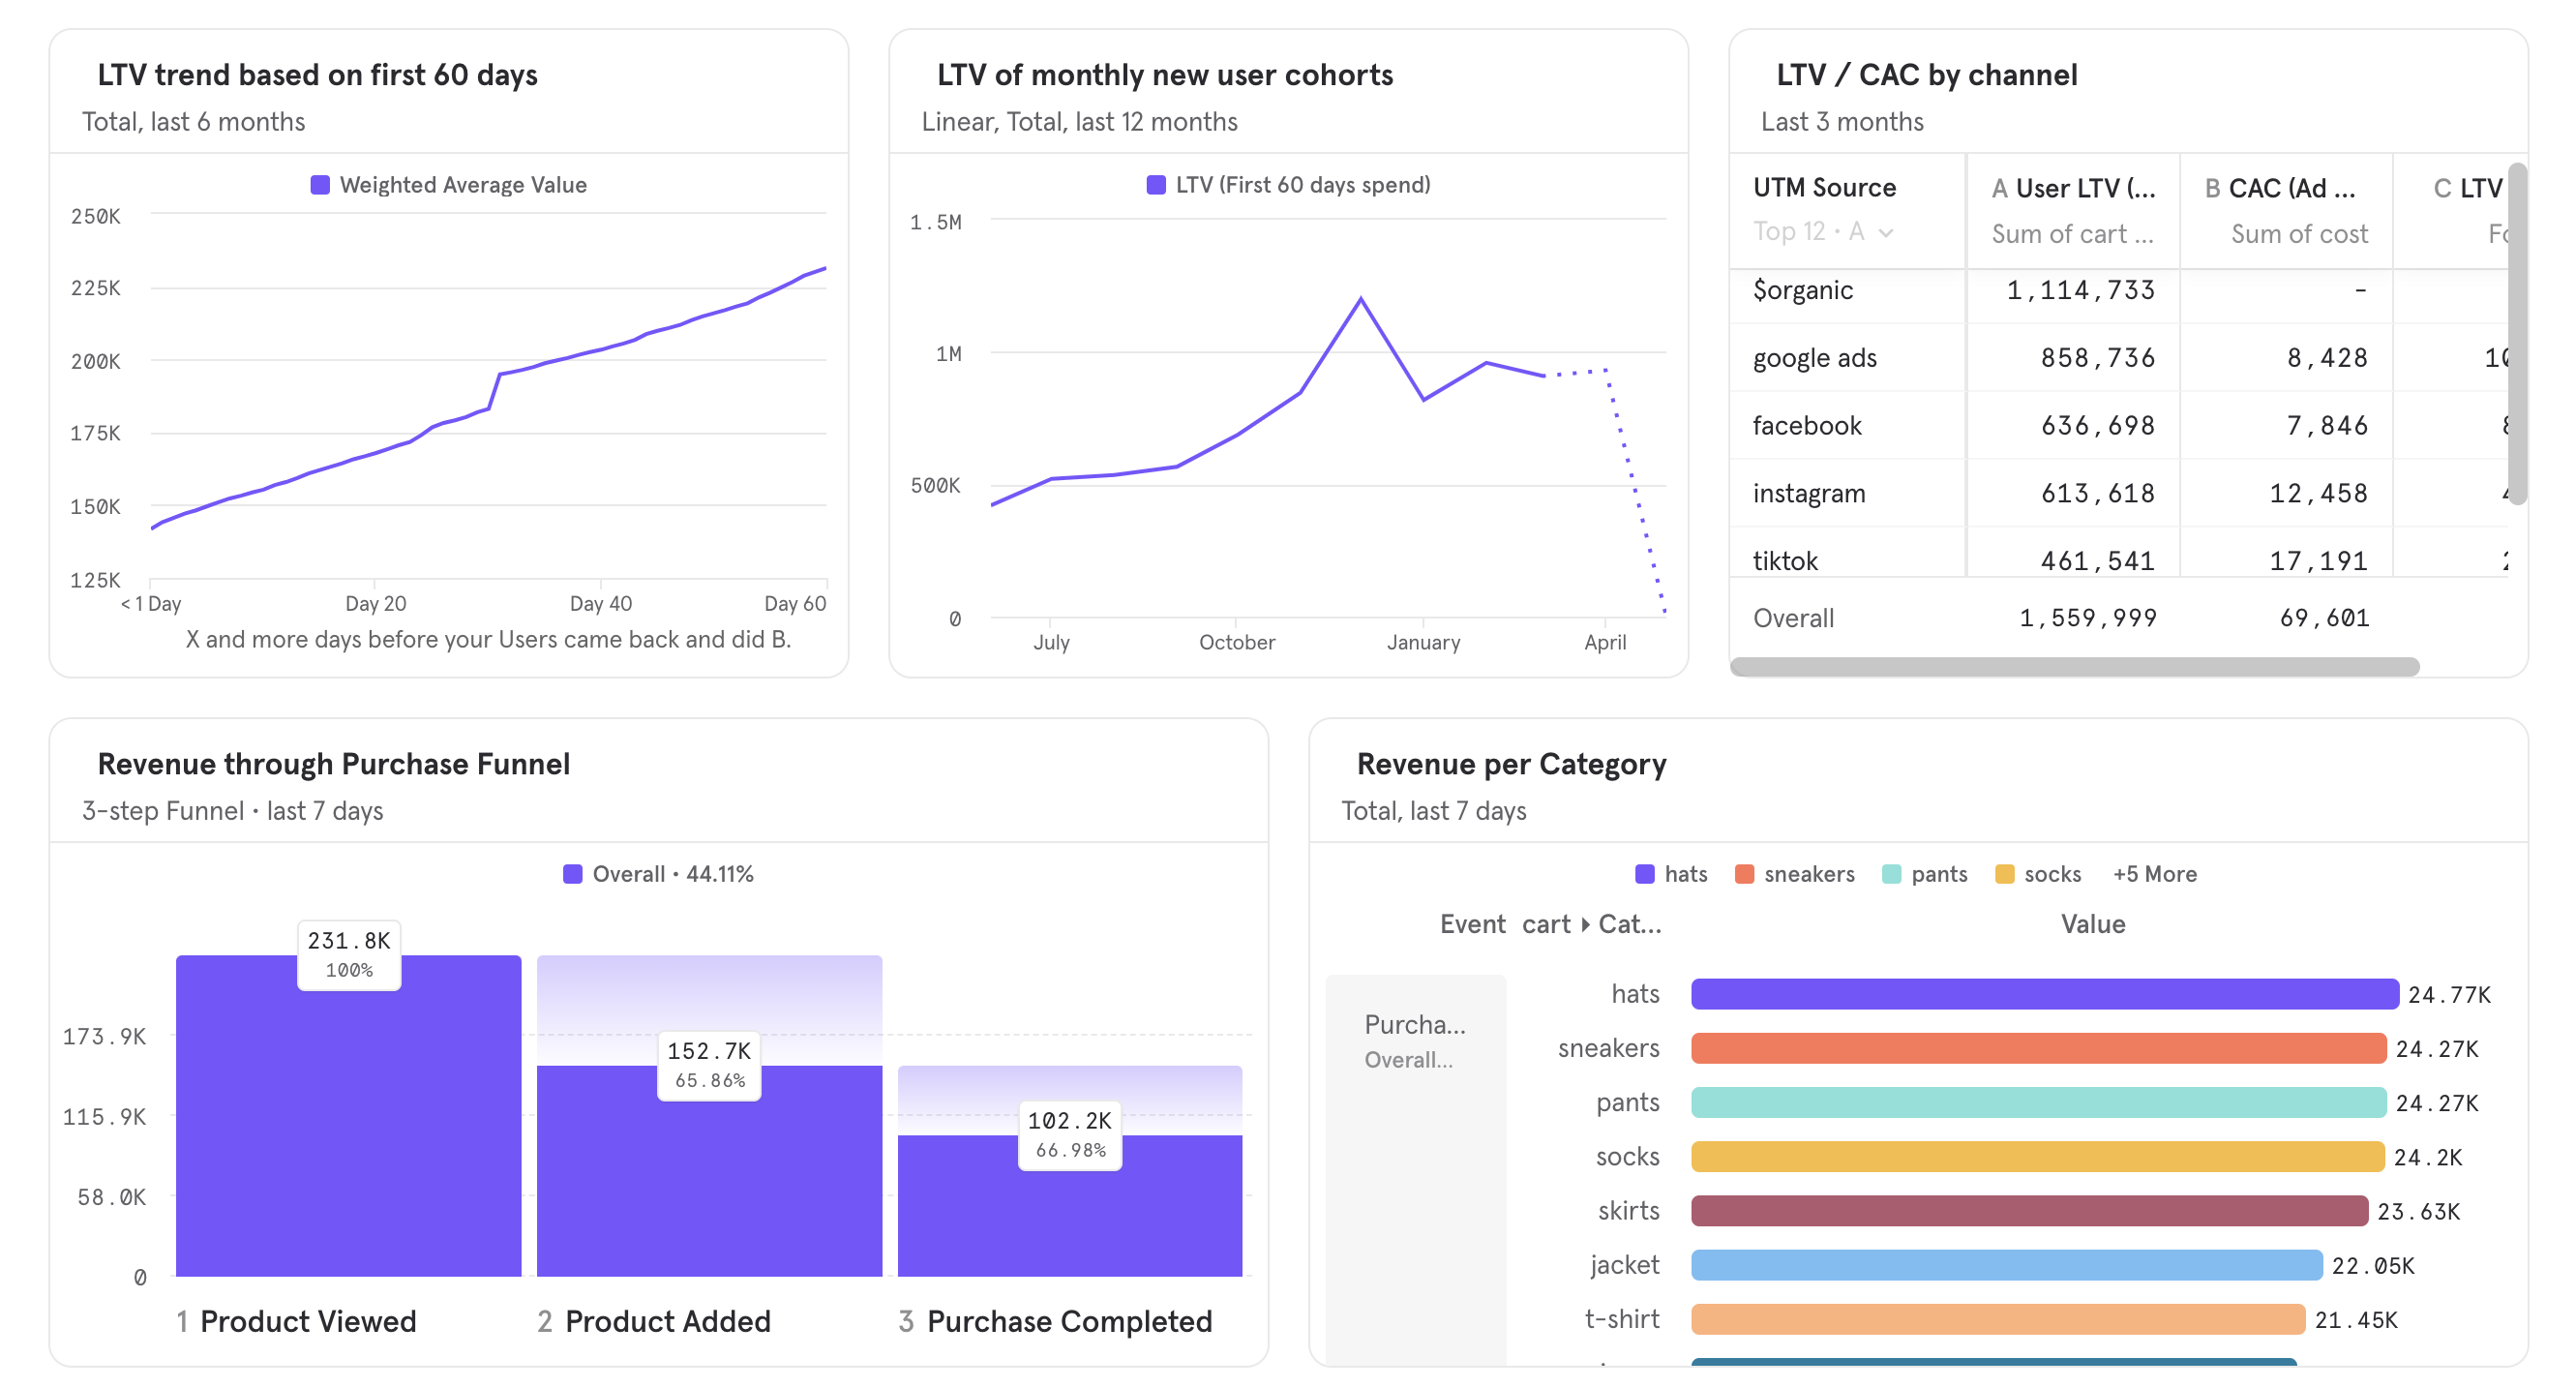
Mixpanel is a robust ecommerce analytics software solution designed to provide deep insights into ecommerce website user behavior and engagement.
Mixpanel excels in tracking and analyzing website traffic and customer actions at every stage of the purchase journey, offering granular ecommerce insights that drive data-informed decisions. Its ability to track and analyze customer cohorts and retention makes it an invaluable tool for improving lifetime value (LTV) and reducing churn.
Key features:
- Cart Analysis: Mixpanel allows businesses to examine the contents of users' carts at various stages—such as product views, additions to cart, and purchases. By analyzing details like item category, brand, and price, ecommerce brands can understand purchasing behaviors, identify popular product combinations, and strategize on upselling or bundling opportunities.
- User Journey Tracking: Mixpanel tracks detailed user actions, including product views, search behavior, cart additions, and completed purchases. This helps ecommerce brands understand how users interact with their store, identify pain points, and optimize navigation.
- Cohort Analysis: Mixpanel enables businesses to group customers based on shared behaviors, such as frequent purchases or high cart abandonment rates. This segmentation helps target high-value users with personalized offers and campaigns.
- Funnel Analysis: Offers precise visualization of user behavior through sales funnels, showing exactly where customers drop off in the journey—from browsing to checkout—enabling strategic optimizations to reduce cart abandonment.
- Customer Retention Tracking: Mixpanel tracks how often customers return to your store, offering insights into repeat purchase behavior and customer loyalty.
- Custom Dashboards and Reports: Mixpanel provides highly customizable dashboards that can display real-time metrics like average order value (AOV), customer engagement rates, and purchase trends. These intuitive dashboards are tailored to ecommerce-specific key performance indicators (KPIs) for maximum relevance.
- Event-Based Analytics: Mixpanel allows tracking of custom events such as coupon usage, failed transactions, and cart removals, offering actionable data to refine marketing strategies and improve operational efficiency.
- Ecommerce Template: Mixpanel provides a customizable template to track essential ecommerce metrics, including revenue breakdowns by product category, brand, or individual items.
5. Woopra
Best for: Analyzing customer behavior to optimize user journeys, enhance retention, and maximize revenue.
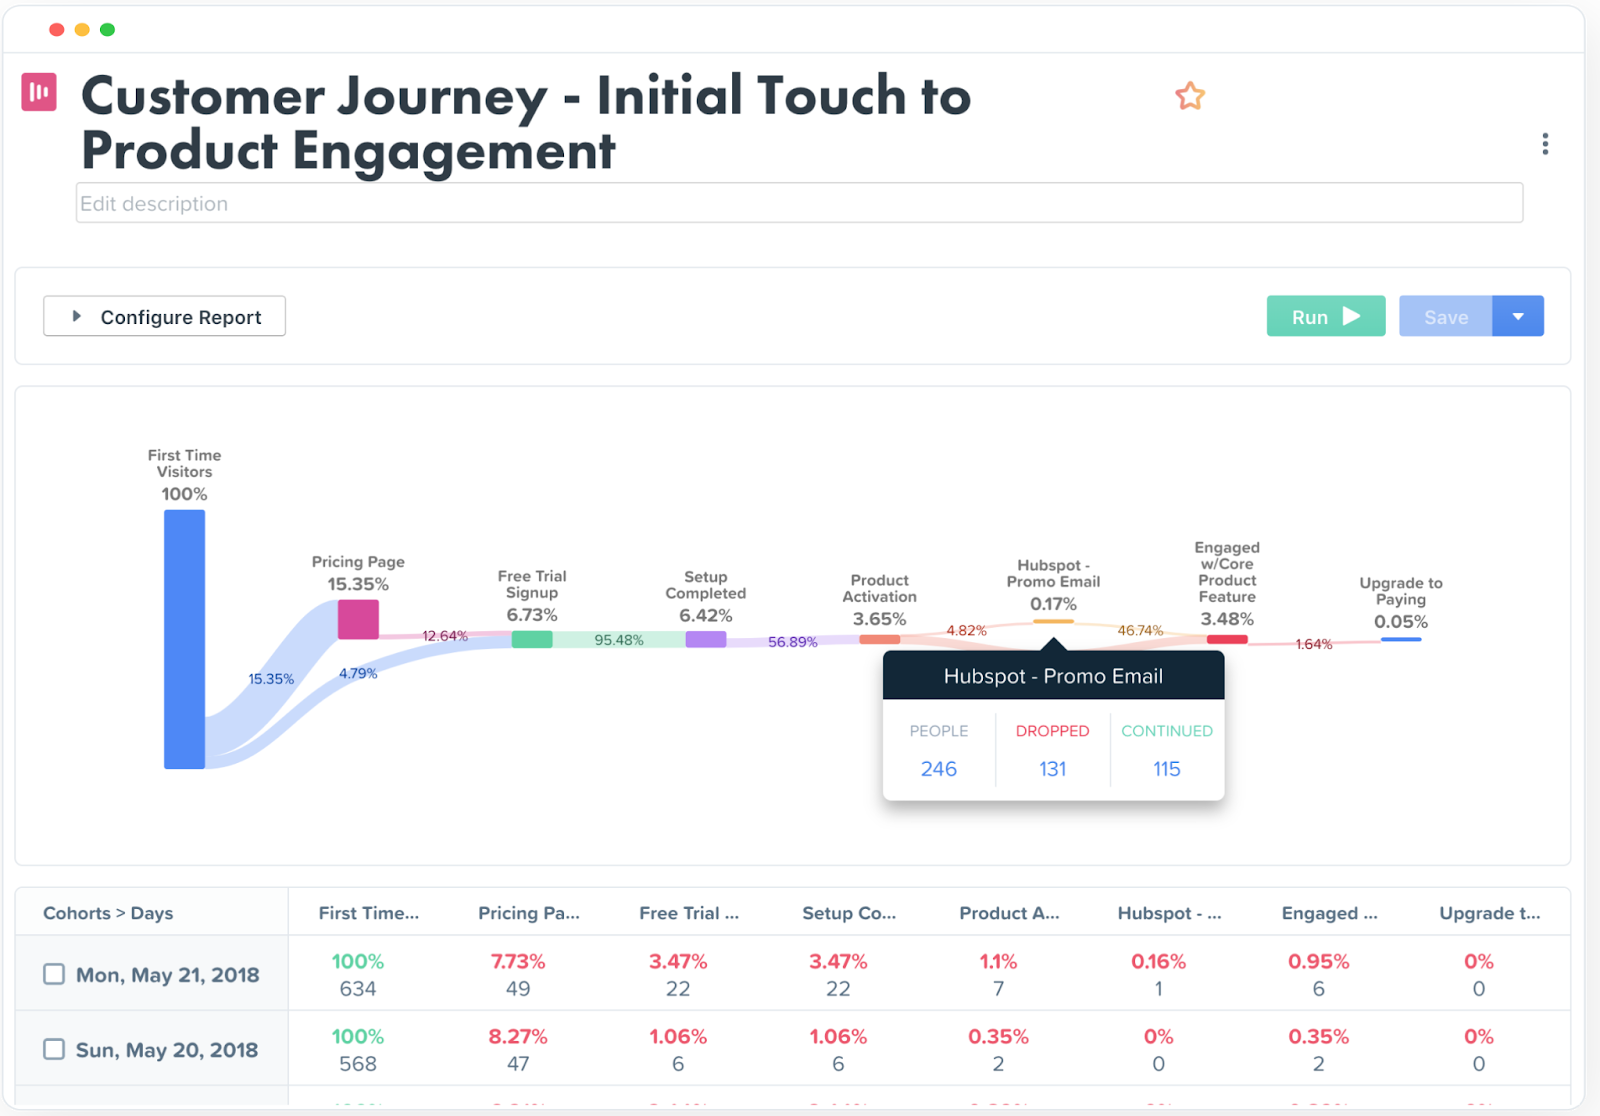
Woopra is a customer journey analytics platform that provides ecommerce businesses with real-time insights into user behavior across touchpoints. Its focus on customer journeys, segmentation, customer demographics, and retention analysis helps retailers optimize engagement, personalize experiences, and drive conversions.
Ecommerce-specific features:
- Customer Journey Mapping: Tracks user interactions across your website, email campaigns, and apps, providing a complete view of the customer lifecycle and highlighting key drop-off points.
- Real-Time Analytics: Delivers instant insights into user behavior, such as product views and cart additions, enabling timely adjustments to campaigns or website design.
- Behavioral Segmentation: Allows ecommerce brands to create detailed customer segments based on specific behaviors, such as frequent purchases or cart abandonment, for targeted marketing efforts.
- Retention and Lifecycle Analysis: Woopra tracks metrics like repeat purchase rates and customer lifetime value (LTV), helping brands identify opportunities to boost loyalty and retention.
- Integration with Marketing Tools: Seamlessly connects with Google Ads, Facebook Ads and other ecommerce analytics platforms to unify data and measure campaign performance alongside user engagement.
- Event-Based Tracking: Woopra tracks custom events, such as promo code usage or wishlist updates, providing granular insights into user interactions that inform better decision-making.
6. Optimizely
Best for: Continually testing, analyzing, and optimizing customer digital experiences.
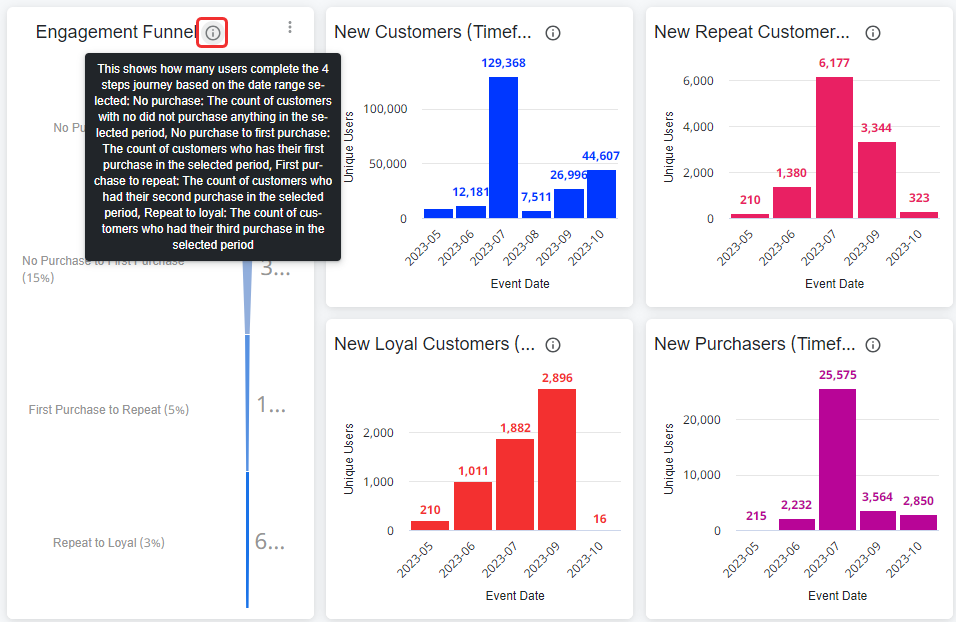
Optimizely is a leading experimentation and optimization platform that empowers ecommerce businesses to test and refine their websites, product pages, and customer experiences.
By leveraging A/B testing and personalization tools, Optimizely helps brands make data-driven improvements that increase conversions and enhance user satisfaction.
Key features:
- A/B and Multivariate Testing: Enables ecommerce businesses to test variations of product pages, CTAs, and layouts to identify designs and messaging that drive the highest conversions.
- Personalization Tools: Optimizely provides dynamic content delivery tailored to user segments, such as first-time visitors or repeat customers, ensuring more engaging shopping experiences.
- Audience Segmentation: Allows detailed segmentation based on behaviors, geography, or device usage to optimize experiences for different customer groups.
- Behavioral Insights: Tracks user interactions and identifies patterns, such as where users drop off or engage most, offering actionable data to refine site performance.
- Integrations with Analytics Tools: Seamlessly connects with other top ecommerce analytics tools like Google Analytics and CRM systems to unify testing data with broader marketing insights.
- Performance Metrics: Offers advanced analytics on experiment results, helping ecommerce brands assess the impact of changes on KPIs like conversion rate and average order value (AOV).
7. Hotjar
Best for: Uncovering usability challenges, improving site design, and creating an optimized customer journey.
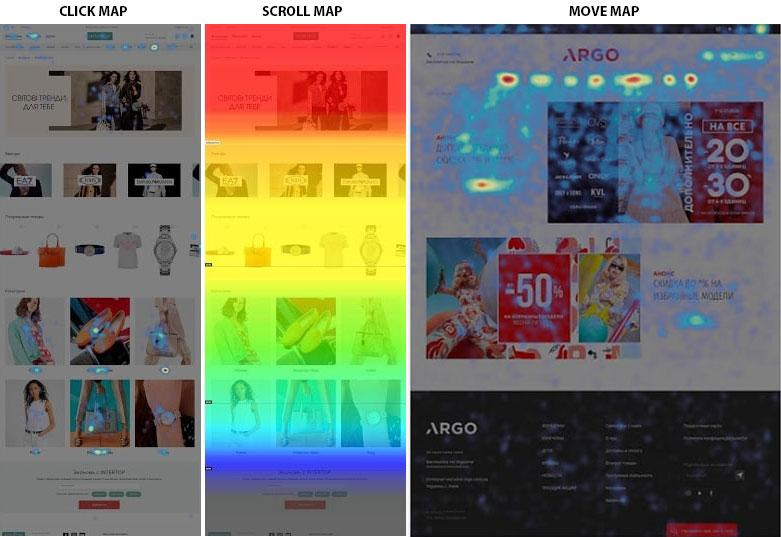
Hotjar is an ecommerce web analytics and user behavior platform designed to help ecommerce businesses gain a deeper understanding of how customers interact with their websites.
By providing qualitative insights through tools like heatmaps, session recordings, and surveys, this ecommerce analytics tool enables brands to identify usability issues, optimize site performance, and improve the customer journey to drive conversions and enhance engagement.
Key features:
- Heatmaps: Visualize user interactions, such as clicks, scrolls, and hovers, on different pages of your site. Heatmaps help pinpoint which elements attract the most attention or are ignored, offering critical insights for optimizing product pages and calls-to-action.
- Session Recordings: Hotjar allows users to replay individual user sessions to analyze navigation patterns, friction points, and unexpected behaviors during browsing and checkout. This helps detect specific issues like confusing layouts or broken links that could be deterring purchases.
- Surveys and Feedback Widgets: Deploy targeted surveys or feedback forms to gather real-time customer opinions on their experience, from product search frustrations to checkout challenges.
- Conversion Funnels: Hotjar tracks user progression through the purchase funnel to identify exact steps where drop-offs occur, such as abandoned carts or stalled form submissions.
- Form Analysis: Gain insights into how users interact with forms during checkout, including fields that cause confusion or delays. This data helps streamline the form design and reduce abandonment rates.
- Behavior-Based Triggers: Use triggers based on user actions, such as prolonged inactivity or cart abandonment, to display surveys or offers. These triggers allow brands to capture valuable feedback or re-engage users before they leave.
8. Kissmetrics
Best for: Leveraging deep customer insights to enhance user experiences, increase retention.
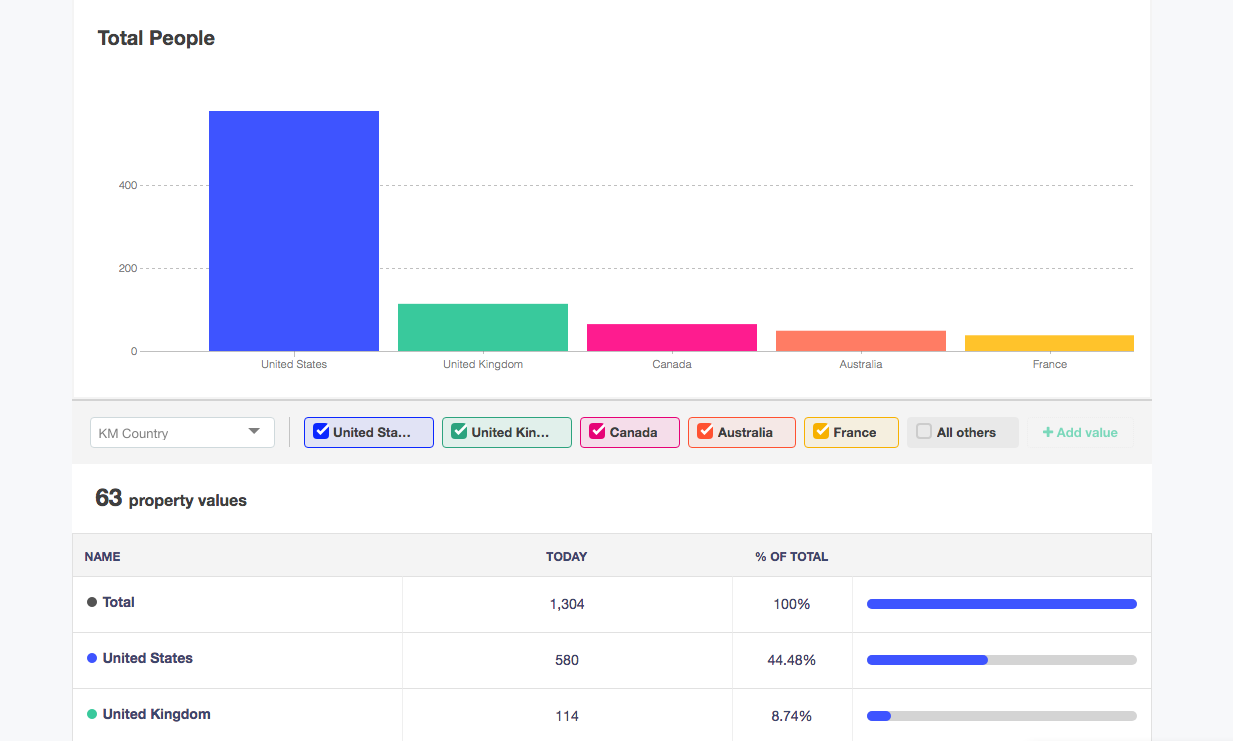
Kissmetrics is one of the best tools for ecommerce customer analytics. With a focus on funnel analysis, cohort tracking, and detailed customer insights, Kissmetrics enables brands to identify trends, reduce churn, and improve conversions.
Key features:
- Customer Journey Analysis: Tracks individual user paths, from first interaction to purchase, helping ecommerce companiesidentify bottlenecks in the sales funnel.
- Funnel Reports: Provides clear visibility into where customers drop off in the conversion process, enabling targeted optimizations to improve performance.
- Cohort Analysis: Analyzes customer behavior over time, helping brands understand retention patterns and design strategies to improve lifetime value (LTV).
- Revenue Tracking: Links user actions to revenue generation, offering insights into the most profitable customer segments and campaigns.
- Segmentation Tools: Enables online businesses to segment users by behavior, demographics, or purchase history, ensuring more personalized marketing efforts.
- Integrations: Connects seamlessly with ecommerce platforms, CRMs, and marketing tools for unified data analysis and streamlined reporting.
9. Crazy Egg
Best for: Diagnosing usability issues, implementing effective design changes, and delivering seamless customer experiences

Crazy Egg is a website optimization and user behavior analytics tool that provides ecommerce businesses with detailed insights to enhance website performance. Crazy Egg enables brands to identify friction points, test design variations, and make data-driven improvements to optimize the shopping experience and boost conversion rates.
Key features:
- Heatmaps: Provide detailed visualization of where users click, scroll, and hover, highlighting high-performing areas and overlooked elements on product and checkout pages.
- Session Recordings: Crazy Egg allows businesses to replay real user sessions to understand navigation patterns, pinpoint barriers like confusing interfaces or broken elements, and identify opportunities for smoother customer journeys.
- A/B Testing: Offers tools to test variations of page designs, including product descriptions, CTAs, or image placements, enabling brands to determine the most effective layout for driving conversions.
- Scroll Maps: Crazy Egg highlights how far users scroll on key pages, such as category or product pages, ensuring that important content and CTAs are strategically positioned for maximum visibility.
- Error Tracking and Diagnostics: Detects broken links, non-responsive elements, or slow-loading pages that disrupt the user experience. Fixing these issues can reduce bounce rates and improve overall site performance.
- Customizable Reports and Insights: Generates actionable ecommerce insights that brands can use to continuously refine their website, including identifying underperforming pages or content.
- Visitor Segmentation: Analyzes user behavior by segment, such as first-time visitors versus repeat buyers, helping tailor experiences to different customer types.
10. HubSpot
Best for: Brands looking for a single solution for ecommerce analytics and automation capabilities.
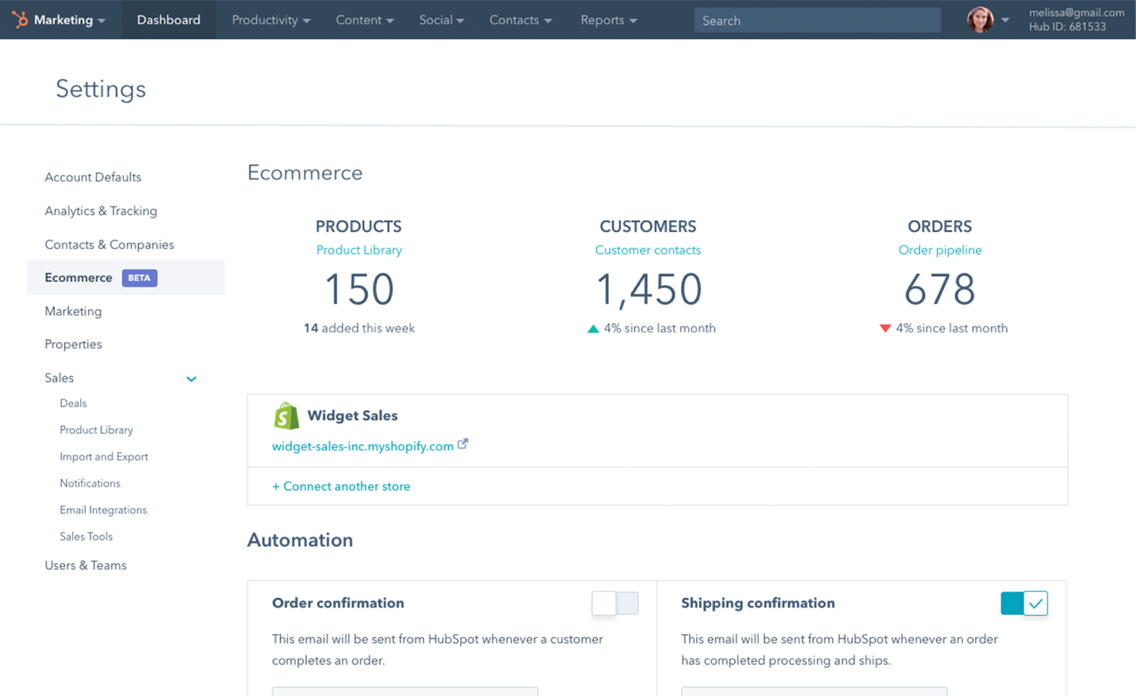
HubSpot offers a comprehensive suite of solutions, including ecommerce performance analytics tools to track and analyze customer interactions across the entire buyer’s journey.
Ecommerce-specific features:
- CRM and Ecommerce Integration: HubSpot syncs seamlessly with ecommerce analytics platforms like Shopify, allowing businesses to track customer interactions, purchase history, and lifecycle stages within a user-friendly dashboard.
- Attribution Reporting: Hubspot provides detailed insights into which marketing efforts, from email campaigns to paid ads, drive the most revenue, helping optimize ad spend and marketing strategies.
- Customer Behavior Analytics: Tracks user behavior such as email engagement, website visits, and cart activity, enabling ecommerce brands to personalize marketing and improve customer experiences.
- Marketing Automation: Automates workflows like cart abandonment emails and follow-up communications, improving conversion rates without manual effort.
- Sales Performance Tracking: Hubspot is also a sales analytics tool and helps monitor sales metrics like deal size, revenue generated, and pipeline progress.
- Customizable Dashboards: Builds tailored reports for tracking ecommerce-specific KPIs such as average order value (AOV), customer lifetime value (LTV), and purchase frequency.
11. Adobe Analytics
Best for: Ecommerce business analytics in large brands.
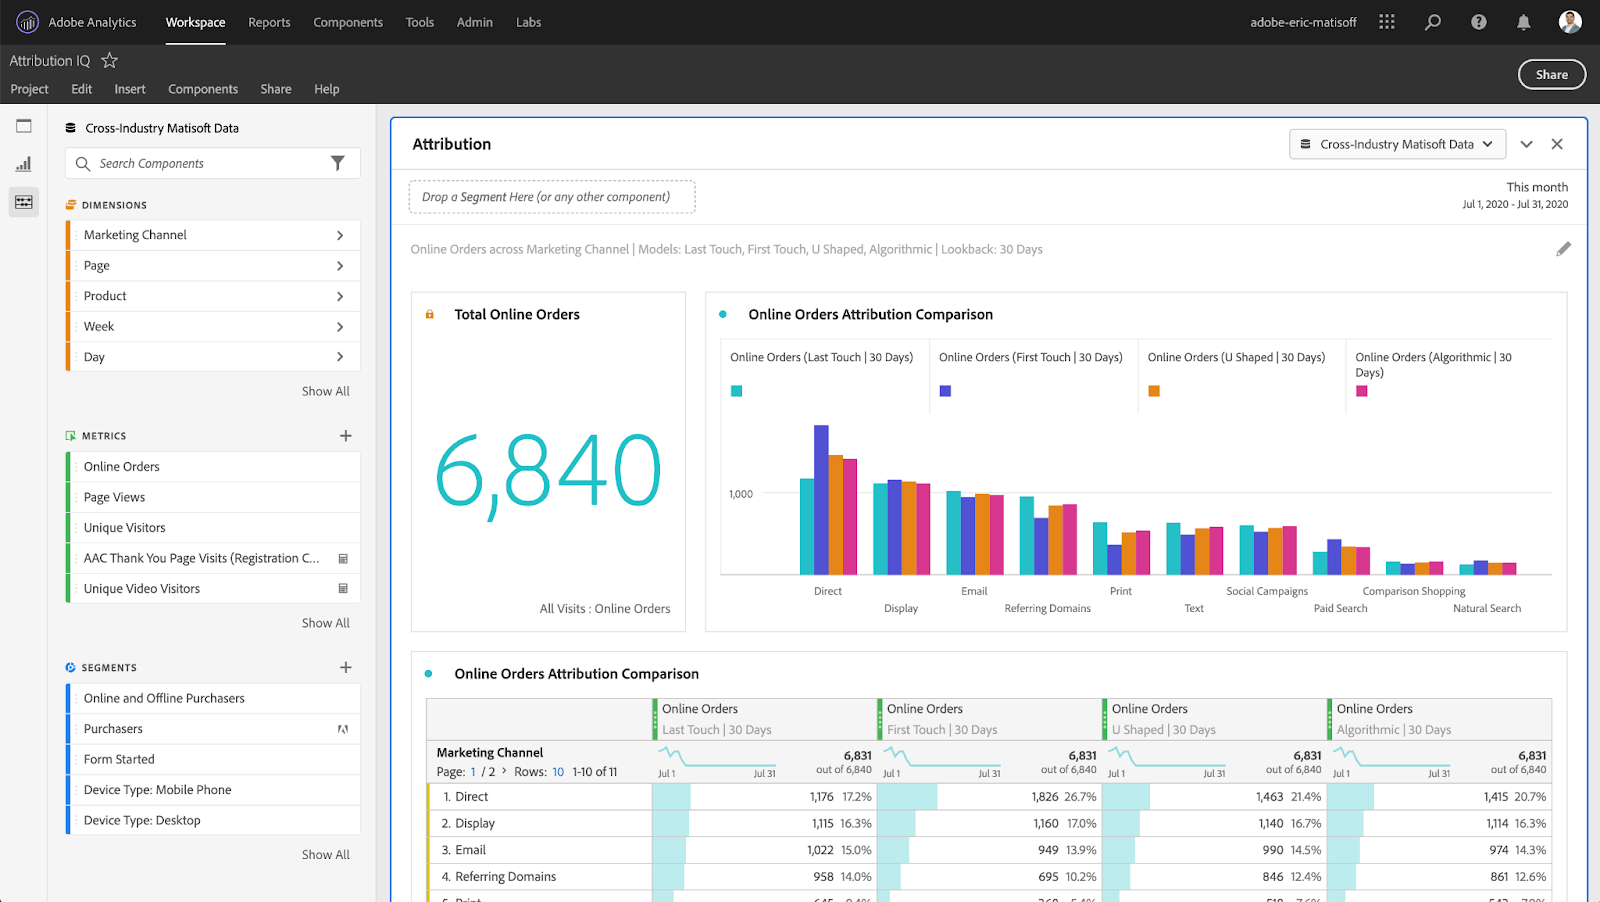
Adobe Analytics is a general-purpose solution that also excels as an ecommerce data analytics tool. Its advanced capabilities provide deep insights into customer behavior, enabling brands to understand the complete customer journey and optimize performance across all digital touchpoints.
Adobe Analytics ecommerce-specific features:
- Comprehensive Customer Journey Analysis: Tracks interactions across websites, apps, and other channels, providing a unified view of customer behavior to optimize touchpoints and boost conversions.
- Real-Time Data Processing: Adobe Analytics delivers instant ecommerce insights into visitor activity, such as cart additions, product views, and purchases, allowing businesses to respond quickly to emerging trends or issues.
- Advanced Segmentation: Enables detailed segmentation of customers based on behavior, demographics, or purchase history, supporting targeted marketing efforts and personalized experiences.
- Attribution Modeling: Provides customizable models to understand which channels and campaigns contribute the most to conversions, helping allocate ad spend effectively.
- Predictive Analytics: Adobe Analytics uses AI to forecast customer behavior and revenue trends, enabling proactive decision-making to capitalize on growth opportunities.
- Customizable Dashboards and Reporting: Offers flexible reporting options tailored to ecommerce KPIs like conversion rates, average order value (AOV), and customer lifetime value (LTV).
12. Shopify Analytics
Best for: Essential analytics tool for ecommerce brands present on Shopify, helping refine strategies, improve online shopping experiences, and boost overall store performance.
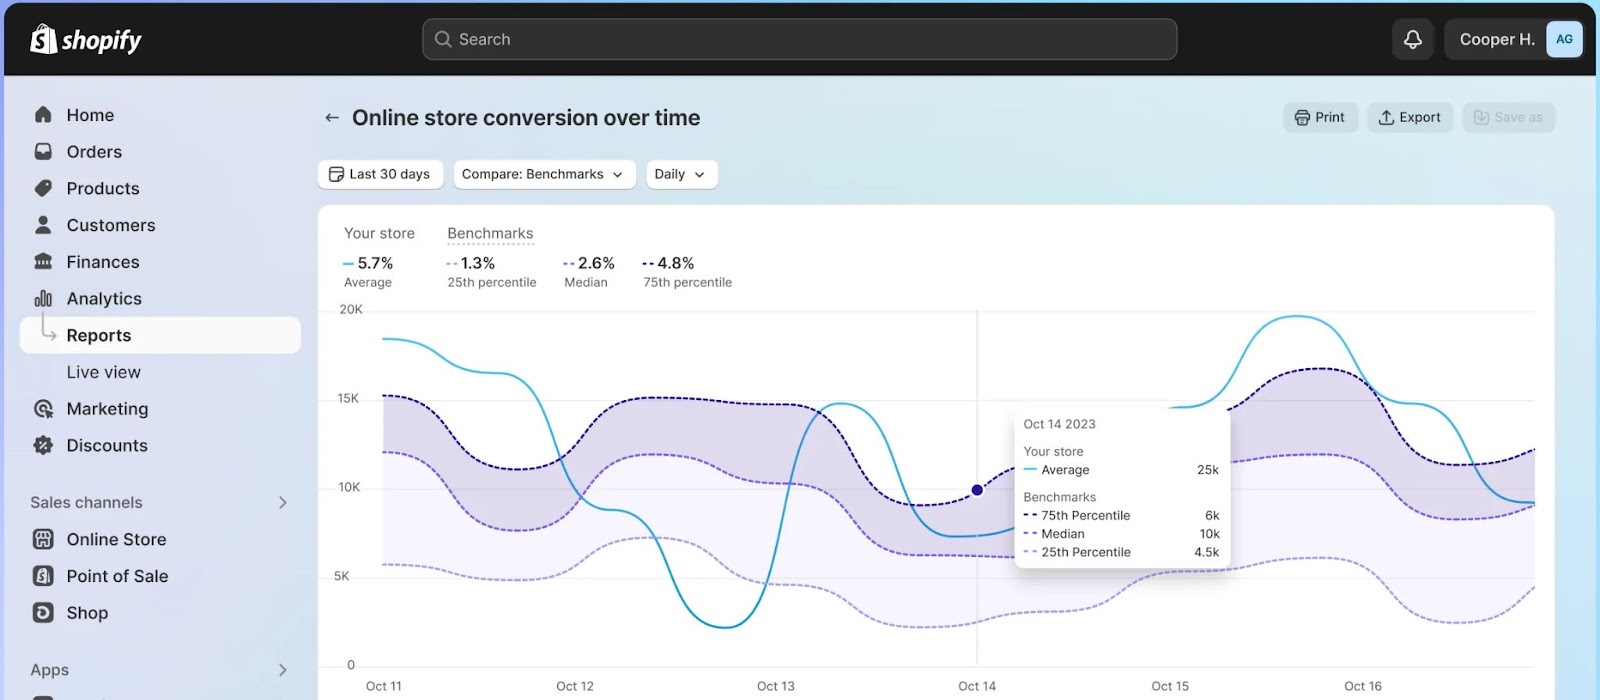
Shopify Analytics is an integrated ecommerce analytic tool designed specifically for businesses using the Shopify platform. It provides detailed insights into sales performance, customer behavior, and store operations, enabling merchants to optimize their ecommerce strategies and drive growth.
Key features:
- Sales Reports: Shopify Analytics offers detailed reports on sales by product, location, and time period, helping businesses identify top-performing items and optimize inventory management.
- Customer Behavior Insights: Tracks metrics like returning customer rate, average order value (AOV), and lifetime value (LTV), providing a deeper understanding of customer engagement and retention.
- Marketing Analytics: Shopify Analytics measures the impact of campaigns, including referral traffic, conversion rates, and sales generated, enabling more effective allocation of marketing budgets.
- Real-Time Reporting: Provides up-to-the-minute data on store performance, including live views of customer activity and sales trends.
- Custom Reports: Allows merchants to create tailored reports based on specific KPIs, offering flexibility to monitor what matters most.
- Financial Reports: Shopify Analytics tracks metrics like gross profit, taxes, and refunds, helping online stores stay on top of their finances.
13. Daasity
Best for: Data orchestration and analytics tailored for mid-market DTC ecommerce brands.
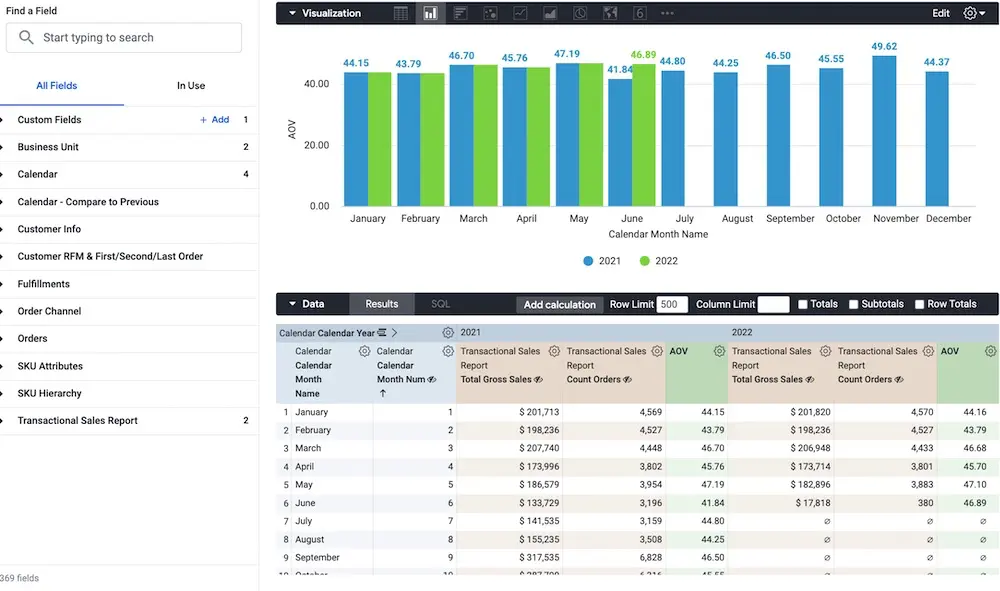
Daasity is a data analytics platform specifically designed for ecommerce brands, enabling seamless integration of data from various sales channels, marketing platforms, and operational tools.
Key features:
- Centralized Data Integration: Daasity consolidates data from ecommerce platforms like Shopify, Magento, SPINS, and BigCommerce, as well as marketing tools and ad platforms, into a single platform for unified analysis.
- Customer Segmentation: Advanced segmentation tools help brands identify high-value customers, track churn risk, and create targeted campaigns to maximize engagement and retention.
- Performance Benchmarking: Daasity helps brands compare key metrics like average order value (AOV), customer acquisition cost (CAC), and revenue across multiple channels to identify opportunities for growth and efficiency.
- Automated Reporting: Schedule and generate reports tailored to multiple ecommerce use cases, including customer retention, demand forecasting, inventory optimization, and others.
- Multi-Channel Attribution: Provides clear visibility into the performance of marketing campaigns across different channels, ensuring accurate ROAS calculations and better budget allocation.
14. Triple Whale
Best for: Consolidating advertising and profitability data for Shopify-based small to medium DTC brands.
Key features:
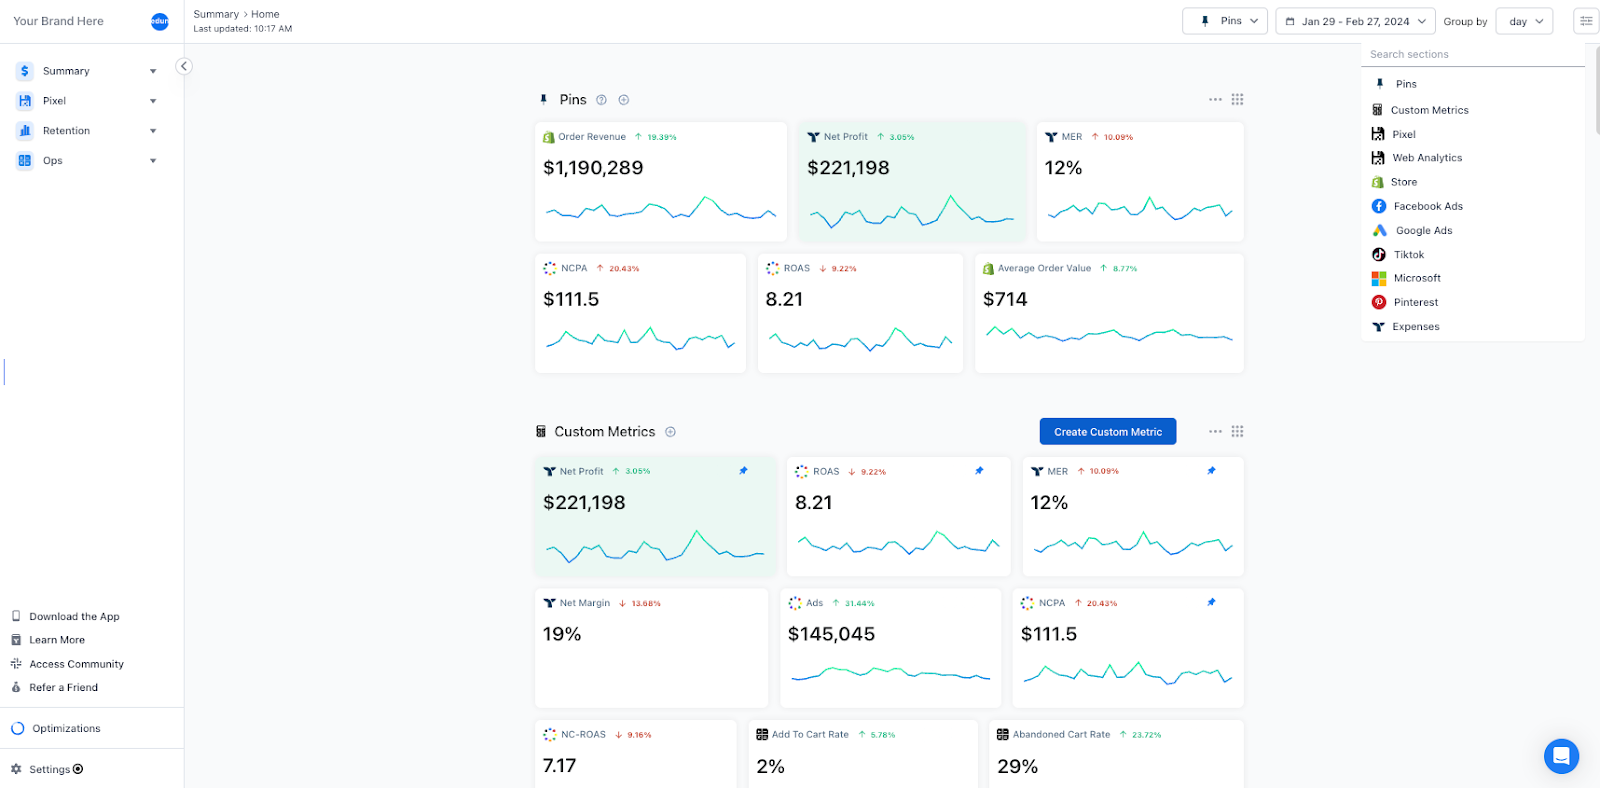
- Centralized Dashboard: Triple Whale offers over 30 pre-built integrations and combines key metrics like ad spend, ROAS, AOV, and customer retention rates from multiple marketing channels into a single interface, eliminating the need for manual reporting.
- Customer Lifetime Value (CLV) Insights: Uses advanced algorithms to predict future customer behavior and CLV based on historical purchasing patterns, enabling precise segmentation and retention strategies.
- Attribution Tracking: Offers multi-touch attribution models to identify the most impactful marketing channels, campaigns, and touchpoints, ensuring optimal budget allocation.
- Profitability Analytics: Breaks down profitability by campaign, product, or customer segment, integrating data on ad costs, operational expenses, and taxes to provide a full financial picture.
- Customizable Alerts and Automation: Triggers alerts for significant fluctuations in KPIs like CAC, ROAS, or inventory levels, allowing immediate corrective action to safeguard profitability and performance.
- Ad Creative Performance Monitoring: Analyzes ad creatives at a granular level, identifying which visuals, headlines, or offers drive the highest engagement and conversions.
Top Ecommerce Analytics Platforms at a Glance
| Tool | Best for | Core function | Key features | ||
|---|---|---|---|---|---|
| Google Analytics (GA4) | Tracking user behavior across web/apps | Web and ecommerce performance analytics | Event-based tracking; ecommerce reporting; audience segmentation; predictive metrics; cross-platform insights | ||
| Improvado | Unified marketing and ecommerce data insights | Data aggregation, normalization, and analytics enablement | 1,000+ integrations; automated ingestion; transformation and standardization; governance and monitoring; BI-ready datasets and dashboards | ||
| Glew | Product and customer behavior optimization | Ecommerce BI and analytics | Customer segmentation; product performance; profitability analysis; automated reporting; multi-platform integrations | ||
| Mixpanel | Behavioral funnels and retention analytics | Product and user journey analytics | Funnels and cohorts; retention tracking; event analytics; user segmentation; customizable dashboards | ||
| Woopra | Customer journey and retention analysis | Real-time customer analytics | Journey mapping; real-time analytics; behavioral segmentation; retention analysis; integrations with marketing tools | ||
| Optimizely | Testing and personalization to improve conversion | Experimentation and optimization | A/B and multivariate testing; audience targeting; experimentation analytics; personalization workflows; integrations | ||
| Hotjar | Qualitative UX insights | User behavior visualization and feedback | Heatmaps; session recordings; on-site surveys; funnel and form analysis; feedback widgets | ||
| Kissmetrics | Customer lifecycle and revenue analytics | Customer behavior and funnel analytics | Journey tracking; cohort analysis; funnel reports; segmentation; revenue attribution | ||
| Crazy Egg | UX diagnostics for conversion improvements | Visual behavior analytics and testing | Heatmaps; scroll maps; session recordings; A/B testing; page-level insights | ||
| HubSpot | CRM-led marketing and sales reporting | CRM analytics and automation reporting | Attribution reporting; lifecycle tracking; campaign reporting; marketing automation analytics; sales performance dashboards | ||
| Adobe Analytics | Enterprise-grade customer and commerce analytics | Advanced digital analytics and journey reporting | Advanced segmentation; real-time reporting; customizable workspaces; cross-channel analysis; predictive insights | ||
| Shopify Analytics | Shopify store performance tracking | Native ecommerce reporting | Sales and conversion reports; customer reports; product performance; real-time dashboards; custom reporting (plan-dependent) | ||
| Daasity | DTC performance reporting across tools | Data integration and ecommerce reporting | Centralized data connectors; KPI reporting; segmentation; benchmarking; automated reporting | ||
| Triple Whale | Shopify-focused attribution and profitability visibility | Attribution and profit analytics | Unified performance dashboard; attribution views; LTV and cohort reporting; profitability tracking; alerts | Web, app (experimentation focus) | 1-2 months | Lift measurement | A/B testing, personalization |
| DataHawk | Custom (enterprise tiers) | Amazon, Walmart marketplaces | 1-2 weeks | Marketplace native | Marketplace sellers |
| Triple | Entry/Mid tier | Server-side tracking (ads, ecommerce) | 1-2 weeks | Server-side attribution | Privacy-first attribution |
| Matomo | Free / $19/mo+ | Web, app (self-hosted or cloud) | 1-3 weeks | Standard models | GDPR compliance |
| Supermetrics | $69/mo | 100+ marketing/ads platforms | Days | N/A (data layer only) | Data aggregation to BI |
| Heap | Mid-market pricing | Auto-capture (web, mobile) | 1-2 weeks | Retroactive analysis | Auto-capture, no tagging |
| Kissmetrics | Mid-tier | Subscription/SaaS focus | 2-3 weeks | Cohort-based | Subscription analytics |
| Piwik PRO | Enterprise | Web, app (compliance focus) | 2-4 weeks | Standard models | Healthcare, finance compliance |
1. Google Analytics 4
Best for: Event-based tracking and analysis of user behavior across websites and apps.
Google Analytics 4 (GA4) is the baseline digital analytics platform for ecommerce businesses in 2026. Its event-based tracking system provides deep insights into user behavior across websites and apps, helping brands understand customer journeys, optimize conversions, and measure marketing effectiveness.
GA4's ecommerce-specific features:
• Event-Based Tracking: GA4's event-driven model tracks specific user interactions such as product views, add-to-cart events, and purchases, providing more precise and comprehensive behavior data than legacy session-based tracking.
• GA4 Ecommerce Tracking: Dedicated ecommerce tracking capabilities monitor product impressions, promotions, checkout steps, and transactions, making it easier to identify bottlenecks in the sales funnel.
• Enhanced Ecommerce Reporting: Pre-configured reports on product performance, customer purchase behavior, and sales funnels help brands identify conversion optimization opportunities.
• Cross-Platform Insights: Tracks user journeys seamlessly across devices and platforms, providing a unified view of customer behavior critical for multi-channel ecommerce strategies.
• Predictive Analytics: Machine learning generates predictive metrics like purchase probability and expected revenue, enabling businesses to anticipate customer actions and allocate resources effectively.
• Audience Segmentation: Create highly detailed audience segments based on purchase behavior and interactions for precise retargeting and personalization.
• Integration with Google Ads: Connects seamlessly with Google Ads to measure ad performance directly against ecommerce outcomes such as sales and ROI.
Pricing:
• Standard GA4: Free for most businesses.
• Analytics 360: Enterprise version starting around $150,000 per year, offering unsampled reporting, advanced features, BigQuery integration, and dedicated support.
Pros:
• Free tier is comprehensive and suitable for businesses up to mid-market scale.
• Deep integration with Google ecosystem (Ads, Search Console, BigQuery).
• Event-based architecture is more flexible than legacy session-based models.
Cons:
• Steep learning curve for teams migrating from Universal Analytics.
• Sampling becomes problematic above 10 million hits per day on free tier, making data unreliable at scale without Analytics 360.
• Attribution model limitations: GA4's data-driven attribution struggles with long B2B sales cycles and offline touchpoints.
When NOT to Use Google Analytics 4:
• You need sub-daily attribution refresh (GA4 attribution data updates daily, not real-time).
• Your site exceeds 200 million hits per month and requires unsampled reporting (forces custom pricing Analytics 360 upgrade).
• You require raw event-level export for data science and custom modeling (free GA4 only exports to BigQuery with 14-month retention, older data requires paid BigQuery storage at $200-$2,000/month depending on volume).
• You need multi-year unsampled historical trend analysis (sampling kicks in retroactively on free tier).
2. Improvado
Best for: Mid-market and enterprise teams ($10M+ revenue) needing unified cross-channel analytics and managed data pipeline.
Improvado is a marketing analytics solution built specifically for ecommerce businesses that need to unify data from dozens of sources into a single source of truth. The platform eliminates manual reporting, resolves metric discrepancies across tools, and provides governance capabilities that enterprise teams require for reliable decision-making.
Key features:
• 1,000+ Data Source Connectors: Improvado integrates with 1,000+ marketing, ecommerce, CRM, and analytics platforms including Shopify, BigCommerce, Amazon, Walmart Connect, Meta, Google Ads, TikTok, Klaviyo, Salesforce, and all major data warehouses. When a required source is not available out of the box, custom connectors can be built in days (not weeks or months, a key competitive advantage).
• Automated ETL/ELT Pipeline: Data extraction is fully automated on scheduled refresh cycles. APIs are ingested, raw data is cleaned and standardized, then loaded into a unified data model before reporting. This removes manual CSV exports and prevents broken pipelines when platform APIs change.
• Marketing Cloud Data Model (MCDM): Pre-built, marketing-specific data models that map 46,000+ metrics and dimensions into consistent naming conventions, eliminating metric definition conflicts between platforms (e.g., "conversion rate" calculated differently in GA4, Shopify, and ad platforms).
• Improvado AI Agent: Natural-language interface for data extraction and dashboard generation. Marketing analysts can configure data pulls, transformations, and visualizations without SQL or engineering support. The Agent connects to all data sources and builds reports based on conversational requests.
• Data Governance and Monitoring: 250+ pre-built data quality rules, anomaly detection, data lineage tracking, and pre-launch budget validation. Marketing teams can set thresholds (e.g., "alert if daily ad spend deviates >15% from plan") and receive automated alerts when data quality issues arise.
• BI Tool Compatibility: Push clean, unified data into any BI tool (Looker, Tableau, Power BI) or use Improvado's native dashboards. Supports both self-serve visualization and white-glove dashboard builds by Improvado's team.
• Dedicated CSM and Professional Services: Every customer gets a dedicated Customer Success Manager and access to professional services for custom connector builds, data modeling, and dashboard development, included in the subscription, not an add-on.
• Enterprise Security and Compliance: SOC 2 Type II, examined by BARR Advisory, signs Business Associate Agreements, and supports GDPR and CCPA obligations. Role-based access controls and data encryption at rest and in transit.
Pricing:
Custom pricing based on data volumes, number of connectors, and feature requirements. Mid-market pricing starts in the low four-figure monthly range, enterprise deployments scale with company size. Contact sales for specific quotes.
Pros:
• Eliminates 2-3 FTE data engineer positions (saves $300K-$500K annual loaded cost) by replacing DIY ETL stacks with managed pipeline.
• Implementation timeline is days, not months: Week 1-2 connector setup, Week 3-4 data modeling, Week 5-8 dashboard deployment.
• Governance layer provides data quality assurance that DIY stacks and basic aggregation tools lack.
• Custom connector builds in days vs. weeks or months with other vendors.
• No API overage fees or hidden costs (fixed subscription includes connector maintenance and updates).
Cons:
• Pricing is custom and not transparent on the website (requires sales engagement for quotes).
• Overkill for businesses below $5M revenue with fewer than 5 data sources.
When NOT to Use Improvado:
• Your business is under $5M annual revenue and you have fewer than 5 data sources (GA4 + Glew or Supermetrics will be more cost-effective).
• You have no BI tool in place and no plan to implement one (Improvado is a data pipeline; you need a destination for the data).
• Your primary need is purely SMB self-serve with zero managed services (tools like Supermetrics or Glew are better fits).
• You need a point solution for a single use case (e.g., only marketplace analytics, only attribution) rather than unified cross-channel infrastructure.
Implementation Timeline:
• Week 1-2: Connector setup and initial data extraction. Improvado team configures API connections to all required sources, validates data flows, and confirms schema mapping.
• Week 3-4: Data modeling and transformation. Map source data into unified schema, configure metric calculations, set up governance rules and anomaly detection thresholds.
• Week 5-8: Dashboard deployment and training. Build dashboards in target BI tool or Improvado native interface, train team on reporting workflows, establish ongoing refresh schedules.
• Common blockers: Delayed API credentials from platform owners, conflicting customer ID schemas between CRM and ecommerce platforms (requires 20-40 hours data modeling to reconcile), stakeholder alignment on KPI definitions.
3. Glew
Best for: Mid-market brands ($1M-$10M revenue) needing fast-start product and customer analytics without heavy BI infrastructure.
Glew is an ecommerce-focused BI platform that provides pre-built dashboards for product performance, customer segmentation, and profitability analysis. It's designed for resource-constrained teams that need insights quickly without building custom data warehouses or hiring data engineers.
Key features:
• Pre-Built Ecommerce Dashboards: Out-of-the-box views for product profitability, customer lifetime value, cohort analysis, and channel performance. Eliminates 80% of custom dashboard work.
• Customer Segmentation: Automatic segmentation by RFM (recency, frequency, monetary value), new vs. repeat customers, high-value vs. churn-risk cohorts.
• Product Performance Analytics: Track sales, margins, and profitability by SKU, category, and brand. Identify slow-moving inventory and bestsellers.
• Multi-Channel Integration: Connects to 50+ platforms including Shopify, WooCommerce, BigCommerce, Amazon, Google Ads, Facebook Ads, Klaviyo, and Mailchimp.
• Automated Profitability Reporting: Calculates true profitability by factoring in CAC, COGS, shipping, and returns, not just top-line revenue.
Pricing:
• Free tier: Up to 20 metrics.
• Paid plans: Start around $199/month for single-store deployments, scale with store count and feature access. Multi-store plans reach $799/month+.
Pros:
• Fast implementation (typically 1 week from signup to live dashboards).
• No technical skills required (fully self-serve for non-technical marketers).
• Strong product and customer analytics out of the box.
Cons:
• Limited custom data modeling (pre-built schemas work well for standard ecommerce but can't handle complex multi-brand or B2B use cases).
• Scalability ceiling around $10M revenue: above that threshold, warehouse-based stacks (Improvado, Saras, or DIY) become more cost-effective.
• No advanced attribution modeling (relies on platform-native attribution from connected sources).
When NOT to Use Glew:
• You operate a multi-brand portfolio requiring consolidated cross-brand reporting with custom data models.
• You have more than 50 data sources (Glew's connector library is ecommerce-focused, not enterprise-scale).
• You need advanced multi-touch attribution beyond platform-native models.
• Your business exceeds $10M revenue and data volumes strain Glew's infrastructure (dashboard load times increase, report generation slows).
Total Cost of Ownership:
At $2M revenue with 2-3 stores, expect $2,400/year (base subscription). At $8M revenue with 5+ stores and full feature set, expect $9,600/year. Above $10M, warehouse-based stacks provide better performance per dollar.
4. Saras Analytics
Best for: B2B and B2C data teams ($5M+ revenue) needing full-funnel ecommerce analytics with embedded analytics services.
Saras Analytics provides ecommerce analytics with a focus on customer lifetime value, cohort analysis, and churn prediction. Unlike pure SaaS platforms, Saras embeds an analytics team that acts as an extension of your internal data function, accelerating time-to-insight without hiring full-time analysts.
Key features:
• Customer 360 and Advanced Cohorts: Map CLTV by segment, channel, product, and acquisition source. Cohort dashboards track retention, repeat purchase rate, and churn in real-time.
• Churn Prediction and Win-Back Campaigns: Identify high-value customers at risk of churn and trigger automated win-back campaigns through integrated marketing platforms.
• Omnichannel Sales Visibility: Unified view across Shopify, Amazon, and other sales channels with SKU-level performance tracking.
• Predictive Analytics and Forecasting: Revenue forecasting, inventory demand prediction, and growth scenario modeling powered by machine learning.
• Embedded Analytics Team: Saras provides dedicated analysts who act as an extension of your team, building custom dashboards, running ad-hoc analyses, and providing strategic recommendations, not just software access.
Pricing:
Custom pricing with tiered SaaS + services model. Mid-market deployments typically range $50K-$80K annually; enterprise accounts with complex multi-channel needs reach $100K-$180K.
Pros:
• Pre-built CLTV, cohort, and churn dashboards eliminate months of custom development.
• Embedded analytics team accelerates insights without hiring full-time data analysts.
• Strong focus on actionable metrics (CLTV, churn, profitability) rather than vanity metrics.
Cons:
• Pricing is not transparent (requires sales engagement for quotes).
• Implementation timeline is longer than self-serve tools (2-4 weeks typical).
• Best suited for businesses with $5M+ revenue; smaller businesses may not justify the cost vs. simpler tools like Glew.
When NOT to Use Saras Analytics:
• Your business is under $5M revenue (cost per insight is too high at small scale).
• You need pure self-serve analytics with zero human interaction (Saras is a managed service model).
• Your primary need is ad attribution and campaign optimization rather than customer behavior and retention analytics.
5. Adobe Analytics
Best for: Large enterprise organizations ($50M+ revenue) needing deep customization and advanced attribution modeling.
Adobe Analytics is a comprehensive enterprise analytics platform that provides highly customizable event tracking, advanced segmentation, and algorithmic attribution modeling. It's part of the Adobe Experience Cloud ecosystem, making it ideal for organizations already using Adobe tools for marketing automation, content management, and personalization.
Key features:
• Flexible Event and Dimension Modeling: Fully customizable event taxonomy and dimension structures tailored to complex digital journeys and multi-brand portfolios.
• Advanced Segmentation and Attribution: Algorithmic attribution, path analysis, and contribution modeling for multi-touch journeys across channels and devices.
• Predictive Analytics: Machine learning-powered predictions for conversion, churn, and customer lifetime value, integrated with Adobe Experience Platform.
• Enterprise Governance: Role-based access controls, audit logs, data lineage, and compliance features for regulated industries.
• Adobe Experience Cloud Integration: Native integration with Adobe Experience Manager, Marketo Engage, Adobe Target, and Adobe Customer Journey Analytics.
Pricing:
Enterprise contracts typically start around $100,000+ per year depending on traffic volume, modules, and services. Implementation partner fees add $50K-$150K, and ongoing consulting/training adds $10K-$30K annually.
Pros:
• Highly customizable event model supports complex B2B and multi-brand use cases that simpler tools cannot handle.
• Algorithmic attribution provides more accurate credit assignment than rule-based models for long, multi-touch journeys.
• Deep integration with Adobe Experience Cloud creates unified customer experience and activation workflows.
Cons:
• Steep learning curve requires dedicated analyst headcount and ongoing training investment.
• High total cost of ownership: $250K+ year-1 TCO including software, implementation, training, and analyst time.
• Server call overages are common and can significantly increase costs above base contract.
• Implementation timelines are long (3-6 months typical from contract to production dashboards).
When NOT to Use Adobe Analytics:
• Your organization has fewer than 2-3 dedicated analysts (tool complexity requires full-time attention).
• Your annual revenue is below $50M (cost per insight is prohibitive at smaller scale).
• You need fast time-to-value (Adobe implementations take months, not weeks).
• You're not already using Adobe Experience Cloud (standalone Adobe Analytics is harder to justify without ecosystem benefits).
6. Mixpanel
Best for: Product-led businesses ($1M+ revenue) needing deep funnel, cohort, and retention analysis.
Mixpanel is an event-based product analytics platform that tracks user interactions at the event level, enabling detailed funnel analysis, cohort tracking, and retention measurement. It's designed for teams that need to understand how users interact with products and optimize feature adoption, not just marketing performance.
Key features:
• Funnels and Cohorts: Build multi-step funnels (e.g., sign-up → first purchase → repeat purchase) and track cohort behavior over time to identify drop-off points and retention patterns.
• Retention Tracking: Measure retention by any event (e.g., repeat purchases, feature usage) and compare cohorts to understand what drives long-term engagement.
• Event-Based Analytics: Track any user action as a custom event and analyze it without predefined reports. Full flexibility for product-specific metrics.
• Spark AI Query Builder: Natural-language query interface that generates event queries and insights conversationally, reducing SQL and technical barriers.
• Data Pipelines: Push and pull data from warehouses and other tools, enabling cross-platform analysis and custom data science workflows.
Pricing:
• Free tier: Up to 1 million events per month.
• Paid plans: Usage-based pricing scales with event volume. Typical mid-market pricing is low three figures per month, but high-volume brands above $5M revenue often hit $3,000+ per month after overage fees.
Pros:
• Best-in-class funnel and cohort analysis for product teams.
• Event-level granularity enables highly customized analysis that session-based tools cannot match.
• Free tier is generous (1M events/month supports many early-stage businesses).
Cons:
• Requires engineering time for event instrumentation (40-80 hours typical to instrument core ecommerce events like product views, cart adds, purchases).
• Event volume overages can significantly increase costs: brands above $5M revenue often exceed free tier and face usage-based pricing that scales quickly.
• Not designed for ad attribution or marketing channel analysis (use GA4 or Improvado for that; Mixpanel is product-focused).
When NOT to Use Mixpanel:
• You have fewer than 500 monthly orders and limited engineering resources (event instrumentation overhead is too high for small volume).
• Your primary goal is ad spend ROAS and marketing attribution rather than product optimization (GA4 or Improvado are better fits).
• You need plug-and-play analytics without custom event instrumentation (Glew or GA4 are simpler).
7. Optimizely
Best for: Experimentation-focused teams ($10M+ revenue) running 20+ A/B tests per quarter.
Optimizely is a dedicated experimentation and personalization platform that provides statistical rigor, audience targeting, and multi-variate testing workflows far beyond the basic A/B modules included in analytics tools. It's designed for teams that treat experimentation as a core growth lever, not an occasional tactic.
Key features:
• A/B and Multivariate Testing: Test page layouts, flows, features, and pricing across web and mobile with full statistical confidence calculations.
• Audience Targeting and Personalization: Deliver different experiences to different audience segments based on behavioral, contextual, and demographic data.
• Experimentation Analytics: Measure lift, statistical significance, and segment-level performance. Built-in sequential testing and Bayesian statistics reduce false positives.
• Integration with CMS, CDPs, and Analytics Tools: Works with major content management systems, customer data platforms, and analytics tools to orchestrate tests without heavy engineering work.
Pricing:
Enterprise-style pricing with contracts typically in the mid-five-figure range annually and up, depending on traffic volume and feature modules. Exact pricing is quote-based.
Pros:
• Best-in-class statistical rigor eliminates false positives that plague simpler A/B tools.
• Personalization workflows enable 1:1 experiences that drive significant conversion lift (10-30% typical for well-executed programs).
• Integrations reduce engineering burden vs. building custom experimentation infrastructure.
Cons:
• High cost makes it prohibitive for businesses below $10M revenue or those running fewer than 10-20 experiments per quarter.
• Requires experimentation program design expertise (many teams hire consultants for initial setup and training, adding $20K-$50K to year-1 costs).
• Not an analytics platform (provides experimentation measurement but not general ecommerce analytics; pair with GA4 or Improvado).
When NOT to Use Optimizely:
• You run fewer than 10 experiments per quarter (cost per test is too high at low volume).
• You lack a dedicated experimentation lead or growth team (tool complexity requires focused ownership).
• Your primary need is analytics rather than testing (GA4 or Adobe Analytics A/B modules may suffice).
8. DataHawk
Best for: Marketplace sellers ($5M+ revenue on Amazon/Walmart) needing dedicated marketplace analytics.
DataHawk is a marketplace-focused analytics platform that provides executive dashboards, sales estimates, and competitive intelligence specifically for Amazon and Walmart sellers. It's designed for brands, agencies, and sellers who need marketplace-specific metrics that general ecommerce tools miss entirely.
Key features:
• Executive-Ready Dashboards: Pre-built views for marketplace performance reporting covering sales, advertising, SEO rankings, and inventory health.
• Daily Performance Alerts with AI Insights: Automated alerts when sales, rankings, or ad performance deviate from expected patterns, with AI-generated root cause analysis.
• Sales Estimates and Market Share Reports: Competitive sales estimates and market share evolution tracking across Amazon markets.
• White-Label Dashboards and Multi-Account Views: Agency-friendly features including white-label reporting, client-level access controls, and consolidated multi-account views.
• Marketplace-Specific Metrics: Buy Box percentage, search rank by keyword, competitor pricing, and review velocity, metrics that Shopify-focused tools do not track.
Pricing:
SaaS with enterprise tiers; pricing is quote-based and scales with number of marketplaces, SKUs, and feature access. Typical mid-market pricing starts in low four figures per month.
Pros:
• Purpose-built for marketplace sellers (covers metrics like Buy Box % and search rank that general tools ignore).
• Competitive intelligence provides market share and sales estimates that inform pricing and positioning strategies.
• White-label features make it ideal for agencies managing multiple seller accounts.
Cons:
• Only covers Amazon and Walmart (not useful for DTC-only brands or multi-channel sellers with significant Shopify/BigCommerce revenue).
• Does not integrate with non-marketplace data sources like email, CRM, or DTC platforms (pair with Improvado or GA4 for unified view).
When NOT to Use DataHawk:
• Your business is primarily DTC with minimal marketplace presence (less than 20% of revenue from Amazon/Walmart).
• You need unified cross-channel analytics including DTC, ads, email, and CRM (DataHawk is marketplace-only; use Improvado for full-stack).
• You're an early-stage seller with fewer than 50 SKUs and under $1M annual marketplace revenue (cost per insight is too high at small scale).
9. Triple
Best for: Privacy-conscious brands ($1M+ revenue) needing server-side attribution in a post-cookie world.
Triple is a server-side attribution platform that tracks user behavior and conversions without relying on third-party cookies or client-side tracking. This makes it ideal for brands operating in privacy-strict regions or targeting privacy-conscious audiences where traditional browser-based tracking is unreliable.
Key features:
• Server-Side Tracking: All tracking happens server-to-server, bypassing browser ad blockers and cookie restrictions that degrade client-side tracking accuracy.
• Attribution Models: Supports multiple attribution models with data captured at the server level, providing more complete view of customer journey than browser-based tools affected by iOS tracking restrictions.
• Privacy-First Architecture: Compliant with GDPR, CCPA, and other privacy regulations by design. Does not rely on third-party cookies or device fingerprinting.
• Integration with Ads and Ecommerce Platforms: Connects to major ad platforms (Meta, Google, TikTok) and ecommerce systems (Shopify, WooCommerce) to track conversions server-side.
Pricing:
Entry to mid-tier SaaS pricing; exact pricing is quote-based and scales with conversion volume and number of integrations.
Pros:
• Server-side tracking recovers 20-40% of conversions lost to ad blockers and iOS restrictions in client-side tools.
• Privacy-first design eliminates compliance risk in strict privacy jurisdictions.
• More accurate attribution data feeds better ad optimization decisions.
Cons:
• Server-side setup requires more technical implementation than client-side tag managers.
• Does not replace general analytics tools (provides attribution data but not product analytics, customer segmentation, or BI dashboards).
• Requires ongoing maintenance as ad platform APIs evolve.
When NOT to Use Triple:
• Your audience is primarily US-based and not using ad blockers at high rates (client-side tracking via GA4 or ad pixels may suffice).
• You lack engineering resources to implement and maintain server-side infrastructure (client-side tools like GA4 are simpler).
• Your primary need is general ecommerce analytics rather than ad attribution (use Improvado or Glew for broader coverage).
10. Matomo
Best for: Privacy-first organizations needing GDPR-compliant, self-hosted analytics.
Matomo is an open-source analytics platform that provides web and app tracking with full data ownership and privacy compliance. It's designed for organizations in strict privacy jurisdictions (EU, healthcare, finance) or those with ethical commitments to user privacy that preclude sending data to third-party analytics vendors.
Key features:
• Self-Hosted or Cloud Options: Run Matomo on your own infrastructure for complete data control, or use Matomo Cloud for managed hosting.
• GDPR, CCPA, and HIPAA Compliance: Built-in features for consent management, data anonymization, and user data deletion requests.
• Full Data Ownership: All analytics data stays on your servers (self-hosted) or in Matomo-controlled infrastructure (cloud), never shared with third parties.
• Standard Analytics Features: Ecommerce tracking, goal conversions, funnel analysis, custom reports, and standard attribution models.
• No Data Sampling: Unlike GA4 free tier, Matomo never samples data regardless of traffic volume.
Pricing:
• Self-Hosted: Free (open-source software), but requires server infrastructure and DevOps time (20+ hours initial setup, 5 hours per month ongoing maintenance).
• Matomo Cloud: Starts at $19/month and scales with traffic volume. Mid-market sites with significant traffic pay $100-$300/month.
Pros:
• Full data ownership and privacy compliance eliminates GDPR/CCPA risk.
• No data sampling at any scale (unlike GA4 free tier).
• Self-hosted option is free for organizations with DevOps capacity.
Cons:
• Self-hosted requires ongoing server management, security patching, and database optimization (not suitable for teams without DevOps resources).
• Feature set is narrower than GA4 or Adobe Analytics (basic attribution models, limited predictive analytics, smaller integration ecosystem).
• Cloud pricing scales with traffic, making it expensive for high-traffic sites (comparable to GA4 360 at enterprise scale).
When NOT to Use Matomo:
• Privacy compliance is not a primary concern and you're comfortable with cloud analytics (GA4 is more feature-rich).
• You lack DevOps resources to manage self-hosted infrastructure (Matomo Cloud eliminates this but adds cost).
• You need advanced attribution modeling or predictive analytics (Matomo's models are basic compared to Adobe or GA4).
11. Supermetrics
Best for: Teams needing fast data aggregation into Google Sheets or existing BI tools.
Supermetrics is a data aggregation tool that pulls data from 100+ marketing and advertising platforms into Google Sheets, Excel, or BI tools like Looker, Tableau, and Power BI. It's designed for teams that want to centralize reporting without building ETL pipelines or hiring data engineers.
Key features:
• 100+ Data Source Connectors: Pulls data from major ad platforms (Google, Meta, LinkedIn, TikTok), analytics tools (GA4, Adobe), ecommerce platforms, and CRMs.
• Google Sheets and Excel Integration: Push data directly into spreadsheets for quick analysis and reporting without BI tool infrastructure.
• BI Tool Connectors: Send data to Looker, Tableau, Power BI, or Data Studio for visualization and dashboarding.
Step 1: Assess Your Business Size & Stage
Your company's maturity plays a huge role:
- A startup on Shopify may only need Shopify Analytics and a free GA4 account to get started.
- A mid-market DTC brand might need a more robust solution like Glew or Triple Whale.
- A large enterprise with a dedicated analytics team will require the power and flexibility of Adobe Analytics or a custom solution built with Improvado.
Step 2: Define Your Key Business Questions
Don't start by looking at features. Start by listing the most important questions you need to answer.
Are you trying to fix a low conversion rate?
Do you need to understand customer lifetime value?
Is proving marketing ROI your top priority?
Your questions will point you toward the right category of tool. For example, if conversion rate is the problem, a tool like Hotjar or Optimizely is a great place to start.
Step 3: Evaluate Your Technical Resources
Be realistic about your team's technical skills. Some tools, like Adobe Analytics, require significant expertise to implement and manage.
Others, like Glew or Triple Whale, are designed to be more plug-and-play. If you don't have an analyst on staff, look for tools with pre-built reports and intuitive dashboards.
Step 4: Consider Your Existing Tech Stack
Your analytics tool must integrate with the platforms you already use. Make a list of your essential tools: ecommerce platform, ad networks, email provider, helpdesk, etc.
Check the integration library of any tool you're considering to ensure it can connect to your critical data sources seamlessly.
Implementing Your Analytics Tool for Maximum Impact
Buying a tool is just the first step. True value comes from proper implementation and consistent use. To get the most out of your investment, focus on creating a data-driven culture within your organization.
Setting Up Accurate Tracking
The old adage "garbage in, garbage out" is especially true in analytics. Ensure your tracking is set up correctly from day one.
This means implementing tracking codes properly, setting up conversion events, and ensuring data consistency across platforms. Work with a developer or implementation specialist if needed to get this right.
Creating Actionable KPI Dashboards
Don't get lost in a sea of metrics. Work with your team to identify the Key Performance Indicators (KPIs) that matter most for each department. Then, build dedicated KPI dashboards that display this information clearly.
The goal is to provide at-a-glance insights that anyone in the company can understand and act upon.
Fostering a Data-Driven Culture
Data should be part of everyone's job. Encourage teams to use data to support their decisions. Start meetings by reviewing relevant dashboards. Celebrate wins that were achieved through data-backed insights. When data becomes a shared language, the entire organization becomes smarter and more agile.
The Future of Ecommerce Analytics: AI and Automation
The world of ecommerce analytics is constantly evolving. The next frontier is driven by artificial intelligence and automation, which are transforming how brands use data to gain a competitive edge.
Predictive Analytics for Demand and Revenue Planning
Historical sales data is no longer used only for trend reporting. AI models now forecast product-level demand, revenue trajectories, and promotion impact before campaigns launch. Predictions account for seasonality, price changes, competitor activity, and media pressure.
These forecasts drive inventory allocation, fulfillment planning, and budget distribution. Overstock and stockout risk can be identified weeks in advance. Marketing calendars align with projected buying windows, not past behavior.
Predictive scoring is also applied at customer level. Models estimate repurchase probability, churn risk, and future order value. This guides retention campaigns, loyalty incentives, and audience prioritization in paid media.
AI-Powered Insights and Anomaly Detection
Manual analysis does not scale with modern ecommerce data volumes. AI now monitors performance across products, channels, and regions continuously.
When anomalies occur, such as a sudden drop in checkout conversion or a spike in refund rates, systems generate alerts with context. The underlying drivers are explained, not just flagged. This reduces time spent diagnosing issues and prevents revenue leakage.
AI also uncovers non-obvious relationships. For example, identifying product combinations that drive higher lifetime value, or promotion patterns that increase basket size. These insights feed merchandising, bundling, and cross-sell strategies.
Automated Reporting as a Continuous Intelligence Layer
Reporting is shifting from static dashboards to automated intelligence delivery. Instead of building reports manually, teams receive scheduled performance summaries tailored to role and responsibility.
Executives receive revenue and margin views. Growth teams receive channel efficiency and conversion funnels. Merchandising teams receive product-level demand signals. All reports run on the same governed dataset.
This eliminates repetitive report building and version conflicts. Analysts focus on strategic modeling and experimentation, not data assembly. Everyone operates from current data without logging into multiple platforms.
Conclusion
Ecommerce growth now depends on how quickly teams can turn data into action. Fragmented platforms, manual reporting, and inconsistent metrics slow decision-making and hide profit opportunities. Modern ecommerce analytics requires unified data, automated pipelines, and real-time insight delivery.
Improvado provides the data foundation to make this possible. It connects ecommerce, advertising, analytics, and revenue systems into a single governed dataset, automates reporting, and powers AI-driven analysis through natural-language interaction. This allows teams to focus on optimization and growth instead of data assembly.
To see how Improvado can modernize your ecommerce analytics stack, get your demo.
Related reading: 10 Best Prescriptive Analytics Tools 2026 | Expert Review, 10 Best Social Media Analytics Tools for 2026 | Improvado