
In 2026, data aggregation sits at the core of every high-performing marketing and analytics operation. Without effective aggregation, even the most advanced analytics stack becomes fragmented, slow, and unreliable.
This article explores what data aggregation truly entails, how the process works from ingestion to analysis, and why it’s essential for modern organizations operating at scale. It also covers key methods, governance considerations, and the technologies reshaping how businesses unify and leverage their data for faster, more accurate decision-making.
Key Takeaways:
- Data aggregation consolidates raw data from multiple sources into structured, summarized formats that reveal patterns, trends, and actionable insights for better decision-making.
- Core process includes: Data collection from different sources, cleaning and validation, transformation and summarization, storage in data warehouses, and delivery through analytics tools.
- Data aggregation improves decision-making through unified views, time and cost efficiency via automation, scalability for large volumes of data, and enhanced data quality through validation.
- Common types: Temporal aggregation (time-based summaries), spatial aggregation (geographic grouping), categorical aggregation (grouping by attributes), and statistical aggregation (calculations like sum, average, count).
- Best for: Business intelligence, marketing analytics, financial reporting, e-commerce optimization, and any scenario requiring insights from disparate data sources.
Quick answer
Data aggregation is the process of collecting raw data from multiple sources and combining it into a summarized, structured format for statistical analysis and reporting. It transforms fragmented information into unified datasets that provide high-level insights into business performance, customer behavior, market trends, and operational efficiency.
What Is Data Aggregation?
In its simplest form, data aggregation meaning refers to compiling typically large amounts of information from a given database or multiple data sources and organizing it into a more manageable, meaningful format.
For example, instead of viewing thousands of individual website visitor sessions, aggregated data might show total visitors per day, average session duration, conversion rates by traffic source, and top-performing pages, all summarized metrics derived from raw granular data.
Why is Data Aggregation Important?
Modern businesses generate vast amounts of data across dozens or hundreds of systems: CRM platforms, marketing tools, e-commerce systems, financial software, IoT devices, social media, and more. Without data aggregation, this information remains siloed, each system holding pieces of the puzzle but no single source providing the complete picture.
Data aggregation solves this fragmentation problem by creating unified datasets that enable:
- Comprehensive Analysis: See relationships and patterns across different data sources that would be invisible when examining systems in isolation.
- Faster Decision-Making: Access pre-aggregated summaries and real-time dashboards instead of manually compiling reports from multiple sources.
- Consistent Metrics: Ensure everyone in the organization works from the same aggregated data, eliminating discrepancies from different calculation methods.
- Scalability: Handle large volumes of raw data by summarizing them into manageable datasets without losing critical insights.
- Predictive Analytics: Feed clean, aggregated datasets into machine learning models for forecasting, anomaly detection, and optimization.
The Data Aggregation Process
Understanding how data aggregation works reveals the systematic approach that transforms raw, scattered information into valuable business intelligence. The data aggregation process typically follows five core stages.
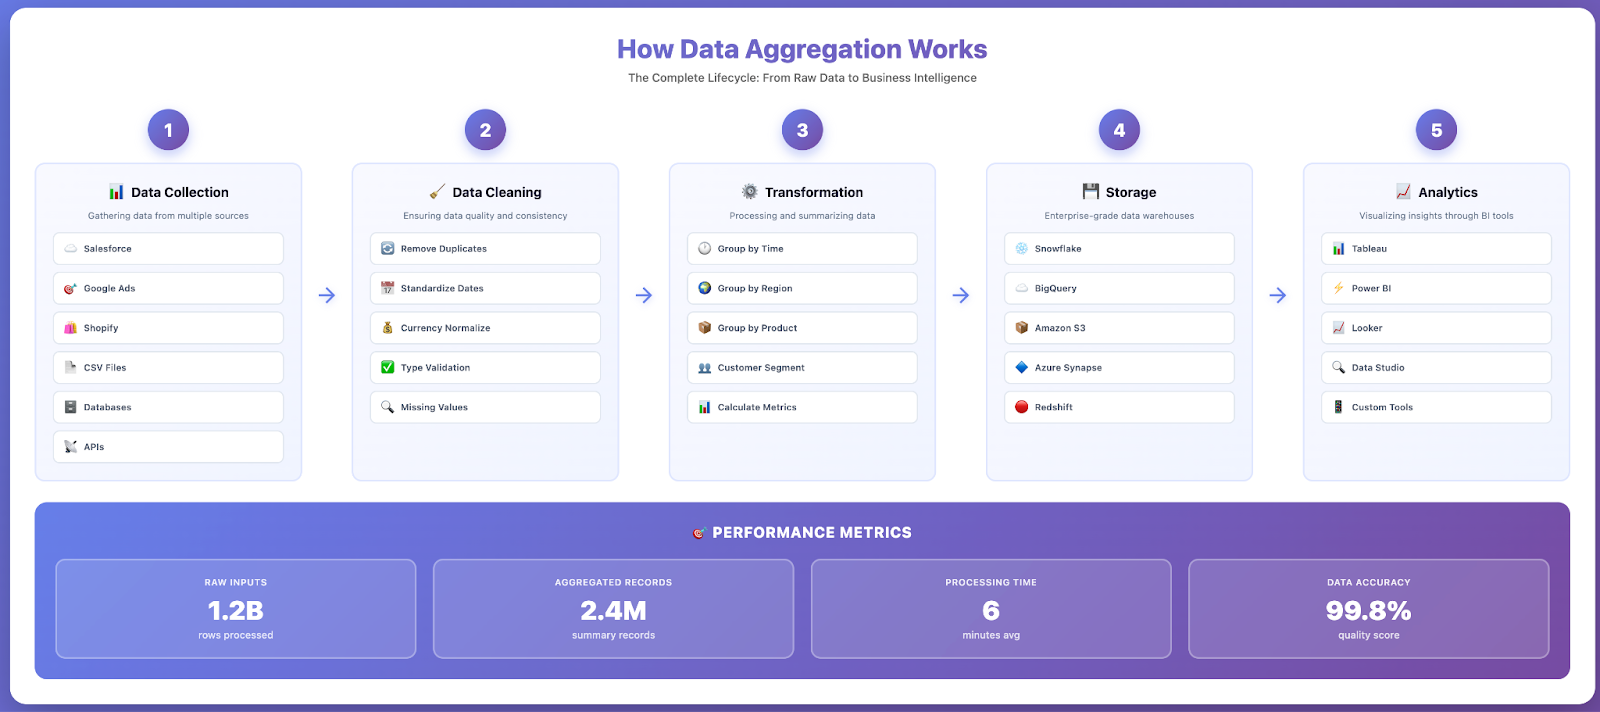
1. Data Collection from Multiple Sources
The first step involves identifying and connecting to all relevant data sources. These sources can include:
- Databases: SQL databases (PostgreSQL, MySQL, SQL Server), NoSQL databases (MongoDB, Cassandra), cloud data warehouses (Snowflake, BigQuery, Redshift)
- Applications: CRM systems (Salesforce, HubSpot), marketing platforms (Google Ads, Facebook Ads, email tools), analytics tools (Google Analytics, Adobe Analytics)
- Files: CSV/Excel files, JSON/XML data feeds, log files, semi-structured data from various systems
- APIs: Third-party services, public records, financial institutions, weather data, social media APIs
- Real-Time Streams: IoT sensors, clickstream data, transactional systems, event logs
Modern data aggregation tools use APIs, database connectors, file uploads, and webhooks to extract data from these disparate sources automatically on scheduled intervals or in real-time.
2. Data Cleaning and Validation
Raw data from different sources often contains inconsistencies, duplicates, missing values, and formatting variations. The data aggregation process includes cleaning steps to ensure data quality:
- Deduplication: Remove duplicate records that appear across multiple sources
- Standardization: Convert dates, currencies, units, and naming conventions to consistent formats
- Validation: Check for errors, outliers, and missing values that could skew analysis
- Enrichment: Add context, categories, or derived fields that enhance analytical value
3. Data Transformation and Aggregation
This is where raw data becomes aggregated data. Transformation involves applying mathematical operations, grouping logic, and summarization rules:
- Grouping: Organize data by dimensions like time period, geographic region, customer segment, product category
- Calculation: Apply aggregation functions – SUM (total sales), AVG (average order value), COUNT (number of transactions), MIN/MAX (range bounds)
- Joining: Combine related datasets using common keys (e.g., matching customer IDs across CRM and sales data)
- Filtering: Focus on relevant subsets (e.g., transactions in last quarter, customers in specific region)
4. Storage in Data Warehouses or Data Lakes
Aggregated data is stored in centralized repositories optimized for analysis. A Forrester Data & Analytics Survey shows enterprises store 62% of their data in the cloud on average.
Storage options include:
- Data Warehouses: Structured storage optimized for SQL queries and business intelligence (Snowflake, Google BigQuery, Amazon Redshift)
- Data Lakes: Store raw and aggregated data in various formats for flexible analysis (AWS S3, Azure Data Lake, Google Cloud Storage)
- OLAP Cubes: Pre-aggregated multidimensional datasets enabling fast querying across different dimensions
5. Delivery Through Analytics and Visualization
The final stage makes aggregated data accessible to business users through dashboards, reports, and analytical tools. Data aggregation platforms integrate with marketing analytics tools, business intelligence software, and custom applications to deliver insights where decision-makers need them.
Types of Data Aggregation
Different analytical needs require different aggregation approaches. Understanding the main types of data aggregation helps organizations choose the right methods for specific use cases.
Temporal Aggregation (Time-Based)
Temporal aggregation groups data by time intervals – daily, weekly, monthly, quarterly, or custom periods. This is one of the most common types of data aggregation for tracking trends, seasonal patterns, and performance over time.
Examples:
- Daily website traffic summarized into weekly totals
- Hourly sales transactions aggregated into monthly revenue reports
- Real-time server metrics rolled up into 5-minute averages
- Quarterly financial results summing transactions from three months
Time-based aggregation enables year-over-year comparisons, trend analysis, and forecasting by consolidating granular time-stamped data points into meaningful periods.
Spatial Aggregation (Geographic)
Spatial aggregation groups data by geographic dimensions like country, state, city, postal code, or custom territories. This type is essential for location-based analysis and regional performance tracking.
Examples:
- Store sales aggregated by region to identify top-performing markets
- Website visitors grouped by country for international expansion planning
- Delivery times averaged by postal code to optimize logistics
- Weather data summarized by climate zones for agricultural analysis
Categorical Aggregation (Grouping by Attributes)
Categorical aggregation groups data based on shared attributes or characteristics – product categories, customer segments, channels, campaigns, or any dimensional attribute.
Examples:
- Revenue grouped by product category to identify best sellers
- Customer count segmented by acquisition channel (organic, paid, referral)
- Support tickets categorized by issue type to allocate resources
- Campaign performance aggregated by audience segment for optimization
Statistical Aggregation
Statistical aggregation applies mathematical functions to dataset subsets, calculating summary statistics that describe distributions, central tendencies, and variability.
Common aggregation functions:
- SUM: Total of all values (total revenue, total units sold)
- AVG (AVERAGE): Mean value (average order value, average session duration)
- COUNT: Number of records (total transactions, number of customers)
- MIN/MAX: Lowest and highest values (price range, peak traffic)
- MEDIAN: Middle value in sorted dataset (median household income)
- STDDEV: Standard deviation measuring variability
- PERCENTILE: Values at specific distribution points (95th percentile response time)
Benefits of Data Aggregation
Implementing effective data aggregation delivers transformative advantages across organizations, from operational efficiency to strategic decision-making capabilities.
Improved Decision-Making Through Unified Data Views
The primary benefit of data aggregation is enabling better, faster decisions by providing complete context. When decision-makers view aggregated data from all relevant sources instead of fragmented reports, they gain comprehensive insights into business performance.
According to McKinsey, organizations intensive in customer analytics are 23 times more likely to outperform in new-customer acquisition and nearly 19 times more likely to achieve above-average profitability compared to less-analytical peers.
Example: A marketing team aggregating data from Google Ads, Facebook Ads, email campaigns, and CRM sees which channels drive not just clicks but actual revenue and customer lifetime value – enabling smarter budget allocation than optimizing each channel in isolation.
Time and Cost Efficiency via Automation
Manual data collection, spreadsheet consolidation, and report creation consume significant analyst time. Automated data aggregation eliminates these time-consuming processes, allowing teams to focus on analysis and strategy rather than data wrangling.
- Reduced Manual Work: Automate repetitive data extraction, transformation, and reporting tasks
- Faster Insights: Real-time or scheduled aggregation provides up-to-date information without waiting for manual updates
- Lower Error Rates: Eliminate human errors from manual data entry, formula mistakes, and copy-paste operations
- Scalability: Handle growing data volumes without proportional increases in headcount
ASUS needed a centralized platform to consolidate global marketing data and deliver comprehensive dashboards and reports for stakeholders.
Improvado, an enterprise-grade marketing analytics platform, seamlessly integrated all of ASUS’s marketing data into a managed BigQuery instance. With a reliable data pipeline in place, ASUS achieved seamless data flow between deployed and in-house solutions, streamlining operational efficiency and the development of marketing strategies.
"Improvado helped us gain full control over our marketing data globally. Previously, we couldn't get reports from different locations on time and in the same format, so it took days to standardize them. Today, we can finally build any report we want in minutes due to the vast number of data connectors and rich granularity provided by Improvado.
Improvado saves us about 90 hours per week and allows us to focus on data analysis rather than routine data aggregation, normalization, and formatting."

Enhanced Data Quality and Consistency
Data aggregation processes include validation, standardization, and deduplication steps that improve overall data quality. When aggregating data from different sources, the ETL (Extract, Transform, Load) pipeline enforces consistent formatting, validates values, and resolves conflicts.
Quality improvements include:
- Standardized naming conventions across systems (e.g., "US" vs "USA" vs "United States")
- Validated data types and ranges (rejecting invalid dates, negative quantities where inappropriate)
- Deduplicated records that appear in multiple sources
- Enriched data with additional context or derived fields
Scalability for Large Volumes of Data
As businesses grow, so does data volume. Data aggregation enables scalability by summarizing raw data into manageable datasets without losing analytical value. Instead of querying millions of individual transactions, analysts work with pre-aggregated summaries that maintain statistical accuracy while dramatically improving query performance.
Modern cloud-based data aggregation platforms handle big data volumes efficiently, processing terabytes of raw data from multiple sources and delivering aggregated results in seconds.
Foundation for Advanced Analytics and Predictive Analytics
Clean, aggregated datasets provide the foundation for sophisticated analytical techniques including machine learning, predictive analytics, and artificial intelligence applications. Data scientists require quality aggregated data to train models, identify patterns, and generate forecasts.
Use cases include:
- Customer churn prediction using aggregated behavioral and transactional data
- Demand forecasting based on historical sales aggregated by product and region
- Anomaly detection identifying unusual patterns in aggregated metrics
- Recommendation engines analyzing aggregated user preferences and behaviors
Challenges of Data Aggregation
While data aggregation provides significant benefits, organizations face several challenges when implementing aggregation processes. Understanding these obstacles helps develop strategies to overcome them.
Data Quality and Consistency Issues
Aggregating data from different sources often reveals quality problems: incomplete records, inconsistent formats, duplicate entries, and conflicting values. When one system records "revenue" differently than another, or customer names appear in various formats, aggregation becomes complex.
Common challenges:
- Different date/time formats across systems (MM/DD/YYYY vs DD/MM/YYYY)
- Inconsistent currency handling and conversion rates
- Varying definitions of the same metric (e.g., "active user" defined differently across platforms)
- Missing or null values requiring imputation or filtering decisions
Technical Complexity and Integration Challenges
Connecting to different sources requires understanding various APIs, database protocols, authentication methods, and data formats. Legacy systems may lack modern APIs, requiring custom extraction scripts. Real-time data sources need streaming pipelines distinct from batch processing.
Building robust data aggregation pipelines demands technical expertise in data integration tools, ETL development, database management, and API integration.
AdCellerant provides digital advertising services to a diverse range of clients, from small coffee shops seeking basic metrics to sophisticated car dealerships requiring granular analysis at the ad group level.
AdCellerant needed to expand its platform with more advertising integrations. However, in-house development took over 6 months per integration and approximately $120,000 in costs.
Instead, AdCellerant chose Improvado, which offers 1,000+ pre-built integrations. Improvado’s embedded iframe provided a seamless white-labeled experience, allowing end-users to connect accounts directly through the AdCellerant web application.
"It's very expensive for us to spend engineering time on these integrations. It’s not just the cost of paying engineers, but also the opportunity cost. Every hour spent building connectors is an hour we don’t spend deepening our data analysis or working on truly meaningful things in the market."

Performance and Scalability Concerns
Aggregating large volumes of data can be time-consuming and resource-intensive. Processing millions of records, performing complex joins, and calculating aggregate functions requires significant computational power and optimized queries.
As data volumes grow, aggregation processes can become bottlenecks, requiring:
- Incremental aggregation strategies (processing only new data rather than full refreshes)
- Distributed processing using frameworks like Apache Spark or cloud data warehouses
- Pre-aggregation and caching strategies to serve common queries faster
- Query optimization to reduce processing time and costs
Data Security and Privacy Compliance
Aggregating data from multiple sources raises security and privacy concerns, especially when dealing with personally identifiable information (PII), financial data, or health records. Organizations must ensure compliance with regulations like GDPR, CCPA, HIPAA, and industry-specific requirements.
Security considerations:
- Encryption in transit and at rest for sensitive aggregated data
- Access controls ensuring only authorized users view aggregated datasets
- Data anonymization and pseudonymization when aggregating personal information
- Audit trails tracking who accessed or modified aggregated data
- Compliance with data retention and deletion policies
Maintaining Data Governance
As aggregated datasets combine information from multiple sources, maintaining data governance becomes critical. Organizations need clear policies on data ownership, quality standards, access permissions, and update frequencies to prevent aggregated data from becoming unreliable or misused.
Data Aggregation Tools and Platforms
Choosing the right data aggregation tools significantly impacts implementation success, performance, and scalability. Modern data aggregation solutions range from specialized marketing platforms to enterprise data integration suites.
Cloud-Based Data Aggregation Platforms
Cloud-based data aggregation platforms offer scalability, managed infrastructure, and broad connectivity without requiring on-premises hardware. These platforms handle the technical complexity of data aggregation while providing user-friendly interfaces for non-technical users.
Top cloud platforms include:
- Improvado: Marketing-specific data aggregation platform connecting 1,000+ marketing and sales data sources. Automates extraction, transformation, and loading of marketing data into warehouses and BI tools. Ideal for marketing teams needing unified cross-channel analytics.
- Fivetran: General-purpose data connector platform with 300+ pre-built connectors. Handles automated data aggregation to cloud warehouses like Snowflake and BigQuery.
- Stitch Data: Open-source-based data integration platform for aggregating data into cloud warehouses. Developer-friendly with extensive API support.
Enterprise Data Integration and ETL Tools
Enterprise-grade tools provide comprehensive data integration capabilities beyond simple aggregation, including complex transformations, data quality management, and governance features.
Leading enterprise tools:
- Informatica PowerCenter: Enterprise data integration platform handling large-scale data aggregation, transformation, and quality management across on-premises and cloud systems.
- Talend: Open-source and commercial data integration suite supporting batch and real-time data aggregation with extensive transformation capabilities.
- Microsoft SSIS (SQL Server Integration Services): Part of Microsoft SQL Server ecosystem, widely used for data aggregation in Microsoft-centric environments.
- Alteryx: Self-service data analytics platform combining data aggregation, transformation, and advanced analytics in visual workflows for business users.
Open-Source Data Aggregation Frameworks
For organizations with development resources, open-source frameworks provide flexibility and customization options for building tailored data aggregation pipelines.
Popular frameworks:
- Apache Spark: Distributed processing framework excellent for aggregating big data at scale with support for batch and stream processing.
- Apache Kafka: Distributed streaming platform enabling real-time data aggregation from multiple sources with high throughput and fault tolerance.
- Apache Airflow: Workflow orchestration platform for scheduling and monitoring data aggregation pipelines with rich task dependencies.
- dbt (data build tool): SQL-based transformation framework that sits atop data warehouses, enabling analysts to aggregate and transform data using version-controlled SQL.
Business Intelligence Tools with Built-In Aggregation
Modern BI and visualization tools include data aggregation capabilities, allowing users to connect to multiple sources and aggregate data within the BI platform itself.
- Tableau: Leading visualization platform with data blending capabilities to aggregate different sources within dashboards.
- Power BI: Microsoft's BI platform with Power Query for data aggregation and transformation before visualization.
- Looker (Google Cloud): Cloud-native BI tool with modeling layer enabling consistent aggregated metrics across the organization.
Data Aggregation Use Cases and Examples
Understanding real-world applications demonstrates how data aggregation creates business value across industries and functions. Here are common examples of data aggregation in action.
Marketing Analytics and Cross-Channel Attribution
Marketing teams aggregate data from numerous platforms – Google Ads, Facebook Ads, LinkedIn Ads, email marketing, CRM, website analytics, and more – to understand the complete customer journey and optimize budget allocation.
Example of aggregated data: A marketing director needs to understand true ROI across channels. The data aggregation process combines:
- Ad spend from each platform (Google Ads, Facebook, LinkedIn)
- Impressions, clicks, and conversions from advertising tools
- Website behavior from Google Analytics
- Lead data from CRM (Salesforce, HubSpot)
- Revenue data from e-commerce or sales systems
Aggregating this data reveals which channels drive not just clicks but actual revenue, enabling marketing ROI calculation and smarter budget decisions. Without aggregation, each platform shows its own metrics but lacks visibility into downstream business impact.
Financial Reporting and Consolidation
Financial institutions and enterprises aggregate transactional data from multiple accounts, systems, and subsidiaries to create consolidated financial statements, regulatory reports, and management dashboards.
What is an example of aggregated data in finance? A multinational corporation aggregates:
- Revenue and expenses from regional accounting systems
- Bank account balances from multiple financial institutions
- Currency exchange rates for consolidation into reporting currency
- Inventory values from supply chain systems
The aggregated data produces quarterly earnings reports, board presentations, and regulatory filings – all requiring consistent, validated data from different sources unified into standard formats.
E-Commerce and Customer Analytics
E-commerce businesses aggregate customer behavior data from websites, mobile apps, customer service interactions, purchase history, and third-party reviews to understand customer preferences and optimize experiences.
Use cases include:
- Customer lifetime value (CLV) calculated by aggregating all purchases over time
- Product recommendations based on aggregated browsing and purchase patterns
- Inventory optimization using aggregated sales data by product, region, and season
- Personalized marketing using aggregated demographic and behavioral segments
IoT and Sensor Data Aggregation
Internet of Things applications generate massive volumes of sensor data requiring aggregation for meaningful analysis. Individual sensor readings provide limited value; aggregated trends and patterns enable actionable insights.
Examples:
- Smart buildings aggregate temperature, occupancy, and energy sensors to optimize HVAC efficiency
- Manufacturing equipment monitors aggregate sensor data to predict maintenance needs
- Smart cities aggregate traffic sensors, weather data, and public transit systems for urban planning
- Wearable health devices aggregate heart rate, steps, and sleep patterns for health insights
Business Intelligence and KPI Dashboards
Organizations aggregate operational metrics from various systems to create executive dashboards and KPI dashboards providing at-a-glance business health visibility.
Common aggregated metrics:
- Sales pipeline aggregated by stage, rep, region, and product
- Customer satisfaction scores aggregated from surveys, reviews, and support tickets
- Operational efficiency metrics aggregated from production, logistics, and quality systems
- Financial KPIs aggregated from accounting, sales, and expense systems
Best Practices for Data Aggregation
Implementing effective data aggregation requires following proven best practices that ensure data quality, performance, and long-term scalability.
Define Clear Aggregation Requirements
Before building aggregation pipelines, clearly define what questions the aggregated data needs to answer, which sources contain the required information, and what granularity and freshness are needed. Document:
- Business objectives: What decisions will aggregated data support?
- Required metrics: Which KPIs and dimensions are needed?
- Data sources: Where does source data reside?
- Update frequency: Real-time, hourly, daily, weekly aggregation?
- Historical needs: How much historical data should be aggregated and retained?
Implement Data Quality Checks
Build validation into aggregation pipelines to catch quality issues early. Monitor for anomalies, missing data, unexpected spikes or drops, and inconsistencies across sources that might indicate upstream problems.
Quality checks include:
- Validation rules ensuring data types, ranges, and formats meet expectations
- Completeness checks verifying all expected sources contributed data
- Consistency checks comparing related metrics for logical coherence
- Anomaly detection flagging unusual patterns requiring investigation
Optimize for Performance and Scalability
Design aggregation processes with growth in mind. Use incremental aggregation (processing only new/changed data) rather than full refreshes when possible. Partition large datasets by time or other dimensions to improve query performance.
Leverage cloud-based tools that scale automatically as data volumes grow, avoiding infrastructure bottlenecks. For real-time use cases, implement stream processing rather than batch aggregation to minimize latency.
Maintain Documentation and Data Lineage
Document how aggregated data is created, which sources contribute, what transformations are applied, and who owns each dataset. Data lineage tracking shows the complete path from raw data sources through transformations to final aggregated outputs.
This documentation proves critical for troubleshooting discrepancies, ensuring compliance, and enabling new team members to understand existing aggregation logic.
Establish Data Governance Policies
Implement governance frameworks covering data ownership, access controls, update processes, and quality standards for aggregated datasets. Define clear responsibilities for maintaining aggregation pipelines and resolving issues when they arise.
Establish processes for requesting new aggregations, modifying existing ones, and deprecating outdated datasets to prevent proliferation of inconsistent or unmaintained aggregated data.
Real-Time Data Aggregation
Real-time data aggregation processes streaming data continuously as it arrives, providing up-to-the-second insights rather than periodic batch updates. This is essential for use cases requiring immediate action based on current conditions.
When Real-Time Aggregation is Needed
Real-time aggregation suits scenarios where delays between data generation and availability impact decision quality:
- Fraud Detection: Financial transactions aggregated in real-time to identify suspicious patterns immediately
- Dynamic Pricing: E-commerce and travel sites aggregating demand signals to adjust pricing instantly
- Operational Monitoring: IT systems aggregating logs and metrics to detect and alert on issues as they occur
- Personalization: Websites aggregating user behavior in real-time to customize content and recommendations
- Supply Chain: Logistics companies aggregating location and inventory data for real-time tracking
Technologies for Real-Time Aggregation
Real-time aggregation requires different technical approaches than batch processing:
- Stream Processing Frameworks: Apache Kafka, Apache Flink, Apache Storm for high-throughput real-time data processing
- Cloud Services: AWS Kinesis, Google Cloud Dataflow, Azure Stream Analytics for managed real-time aggregation
- In-Memory Databases: Redis, Memcached for caching frequently accessed aggregated data with microsecond latency
- Time-Series Databases: InfluxDB, TimescaleDB optimized for time-based aggregation queries
Challenges and Trade-Offs
Real-time aggregation introduces complexity compared to batch processing. Streaming systems must handle out-of-order data, late-arriving events, and maintain state across distributed nodes. Real-time infrastructure typically costs more than batch processing and requires specialized expertise.
Organizations should evaluate whether real-time aggregation provides sufficient business value to justify the additional complexity and cost, or if near-real-time (aggregation every few minutes) or periodic batch aggregation suffices.
Data Aggregation vs Data Integration
While related, data aggregation and data integration serve different purposes and involve distinct processes.
| Aspect | Data Aggregation | Data Integration |
|---|---|---|
| Core Purpose | Combines and summarizes data from multiple sources for analysis and reporting. | Connects and unifies data from disparate systems into a single, consistent environment. |
| Focus | Consolidation and aggregation of metrics and dimensions. | End-to-end connection, transformation, and synchronization of data pipelines. |
| Data Handling | Merges data of similar types (e.g., campaign metrics) to produce rolled-up datasets. | Harmonizes diverse data structures and schemas across multiple domains. |
| Processing Approach | Often performed post-ingestion to prepare analytics-ready summaries. | Occurs throughout the pipeline—from extraction to loading into the warehouse or BI tool. |
| Output | Aggregated datasets, dashboards, or summary tables for analysis. | Unified, governed data infrastructure connecting all enterprise data sources. |
| Use Case | Marketing performance reporting, cross-channel analytics, trend analysis. | Enterprise data management, operational reporting, and analytics enablement. |
| Frequency | Batch or scheduled, focused on summarizing large data volumes. | Continuous or real-time, depending on pipeline architecture. |
| Complexity | Moderate—focused on metric consistency and aggregation logic. | High—requires orchestration, transformation logic, and governance enforcement. |
| Tools Typically Used | BI tools, analytics platforms, and data warehouses. | ETL/ELT tools, data integration platforms, middleware, and APIs. |
| End Goal | Deliver analysis-ready datasets. | Enable seamless data flow and interoperability across systems. |
In practice, data integration often precedes aggregation. First, data integration combines disparate sources into a unified dataset. Then, data aggregation summarizes that integrated data into meaningful metrics and reports.
Example: A marketing team first integrates data from Google Ads, Facebook, and CRM into a unified customer journey dataset (data integration). Then they aggregate that integrated data to calculate total ad spend by channel, average customer acquisition cost, and conversion rates (data aggregation).
Conclusion
A strong data aggregation workflow is essential for any organization that wants consistent, accurate, and actionable insights. When every metric is unified and validated automatically, teams can trust their dashboards, eliminate manual work, and make faster, more confident decisions. Proper aggregation ensures that no data is lost, duplicated, or misaligned as it moves through your analytics ecosystem.
Improvado streamlines and governs the entire data aggregation lifecycle with enterprise precision. It automatically collects, validates, and structures marketing and analytics data across hundreds of platforms, ensuring accuracy, consistency, and transparency at every step.
With Improvado, you can:
- Unify fragmented data sources: Aggregate performance metrics from ad, web, CRM, and revenue systems into a single, governed dataset.
- Maintain accuracy and trust: Automatic deduplication, schema validation, and anomaly detection ensure clean, verified data.
- Monitor data health continuously: Real-time alerts identify breaks or inconsistencies before they affect reporting or analysis.
- Control update frequency and lineage: Flexible refresh schedules, version tracking, and complete visibility into source-level data.
- Deliver analytics-ready data: Push validated datasets directly into warehouses or BI tools for instant access and deeper analysis.
Improvado eliminates the inefficiencies of manual aggregation, enabling data teams to move from cleanup to insight.
See how your organization can achieve accurate, governed, and scalable data aggregation — book a demo today.


