Blog
Marketing analytics, data, and AI for modern teams
Playbooks, deep dives, and benchmarks from the Improvado team and customers — 861 posts and counting.

-
 Analytics
Multi-Location Budget Pacing: Why the Network Average Lies
Network pacing can read 97% while some locations overspend and others starve. The per-location pacing formula, alert thresholds, naming taxonomy, and first-week plan, all open.

-
 Big Data
Marketing Data Integration: The Complete Guide for Marketing Leaders
Marketing data integration connects ad, CRM, and web sources into one automated flow. Compare architecture patterns, build vs buy, and how to evaluate.

-
 AI
AIAI Agent Traffic: The Buyers Your Analytics Cannot See
94% of business buyers used AI in their most recent purchase, and their agents leave no UTMs, no cookies, and no referrers. How to see, segment, and report AI agent traffic.
-
 Big Data
Marketing Data Unification: The Complete Guide for Marketing Leaders
Marketing data unification turns siloed ad, CRM, web, and offline data into one governed source of truth. Learn how it works, build vs buy, and a readiness checklist for marketing leaders.
-
 MarTech
Best AI Agents for Marketing Analytics in 2026
A practical comparison of AI agents for marketing analytics - ThoughtSpot Spotter, Zenlytic, Databricks Genie, Cortex Analyst, and more - and why the data layer underneath decides if any of them are trustworthy.
.jpeg)
-
 AI
AIThe Hidden Costs of AI Agents: You Pay for Statelessness Three Times
A stateless AI agent gets paid for three times, in tokens, in team hours, and in repeated mistakes. Why organizational memory is the missing cost structure fix.
-
 MarTech
AI Adoption in Marketing: Org Design Decides ROI, Not Procurement
88% of companies now run AI somewhere, but only about 6% see material profit impact. The difference is org design. Three CMO-owned redesigns of the work, the people, and the guardrails.
-
 Analytics
Multi-Location Healthcare Marketing Analytics: Fixing the Multiplication Problem
Why one dashboard per clinic fails multi-state healthcare networks, and the location-first data model that fixes reporting. One taxonomy, one location_id, per-location alerts.
-
 MarTech
The 15 Best MCP Servers for Marketing and Analytics Data, Ranked (2026)
The 15 best MCP servers for marketing and analytics data, ranked by real trailing-28-day search demand rather than opinion, with what each exposes to an AI agent.
-
 Analytics
Healthcare GA4 HIPAA Conversion Tracking After the HHS Bulletin
How healthcare marketers can replace GA4 conversion tracking with a HIPAA-safe measurement plan across ads, CRM, calls, and scheduling data.

-
 Analytics
Healthcare View-Through Attribution After HIPAA Tracking Restrictions
Why healthcare teams lose view-through attribution after HIPAA tracking restrictions and how to rebuild measurement with MMM, CRM, calls, and appointment outcomes.
-
 Analytics
HIPAA-Safe Meta, Google Ads, and Programmatic Attribution
A practical healthcare attribution model for Meta, Google Ads, and programmatic campaigns when pixels, PHI, and platform conversion events cannot be trusted.
-
 Analytics
Appointment Attribution for Healthcare Marketing Teams
Learn how to connect healthcare campaigns, calls, scheduling, CRM, and BI data to measure which marketing efforts create booked appointments.
-
 Analytics
Doceree Measurement Layer for Pharma Marketing
Learn how pharma and healthcare marketers should measure Doceree campaigns beyond platform dashboards using governed data, attribution, and BI reporting.
-
 Analytics
Doximity Measurement Layer for Pharma Marketing
Learn how pharma and healthcare marketers should measure Doximity campaigns beyond platform dashboards using governed data, attribution, and BI reporting.
-
 Analytics
Freshpaint Alternative for Healthcare Marketing Data Teams
Compare Freshpaint with Improvado for healthcare marketing teams that need HIPAA-aware privacy controls plus cross-channel reporting, attribution, and revenue measurement.
-
 Analytics
Freshpaint vs. Improvado for Healthcare Marketing Data
Compare Freshpaint and Improvado for healthcare teams choosing between HIPAA-aware event routing and governed marketing measurement.
-
 Analytics
Healthcare Marketing Measurement Hub
Navigate Improvado healthcare marketing measurement resources by competitor, outcome, HIPAA analytics, HCP, pharma, call tracking, attribution, and BI use case.
-
 Analytics
HIPAA-Compliant CDP vs. Marketing Data Platform
Learn when healthcare marketers need a HIPAA-compliant CDP, when they need a marketing data platform, and why many teams need both layers.
-
 Analytics
Medscape Measurement Layer for Pharma Marketing
Learn how pharma and healthcare marketers should measure Medscape campaigns beyond platform dashboards using governed data, attribution, and BI reporting.
-
 Analytics
Ours Privacy Alternative for Healthcare Marketing Analytics
Compare Ours Privacy and Improvado for healthcare marketing teams choosing between HIPAA-aware CDP/privacy tooling and governed marketing analytics.
-
 Analytics
Ours Privacy vs. Improvado for Healthcare Marketing Analytics
Compare Ours Privacy and Improvado for healthcare teams separating privacy/CDP workflows from governed marketing analytics.
-
 Analytics
PulsePoint Measurement Layer for Pharma Marketing
Learn how pharma and healthcare marketers should measure PulsePoint campaigns beyond platform dashboards using governed data, attribution, and BI reporting.
-
 AI
AIAI Agent Orchestration: A Complete Guide for Marketing Ops Leaders (2026)
Master AI agent orchestration for marketing operations. Learn proven frameworks for coordinating autonomous agents across data pipelines, analytics, and campaign execution.
-
 Analytics
Human-in-the-Loop AI: How Marketing Teams Balance Automation with Oversight in 2026
Discover how human-in-the-loop AI combines automation with human oversight for better marketing decisions. Learn implementation strategies, benefits, and real use cases.
-
 Analytics
Datadog Dashboard: Complete Setup Guide for Marketing Analytics in 2026
Learn how to build Datadog dashboards that monitor marketing infrastructure health, API performance, and data pipeline reliability. Step-by-step guide with templates.
-
 Analytics
How to Build a Snowflake Dashboard: Complete Guide for 2026
Learn how to build dashboards in Snowflake that connect marketing data, transform raw tables into insights, and scale with your team. Step-by-step guide with tools, SQL examples, and real workflows.
-
 Analytics
HubSpot Dashboard: How to Build One That Drives Decisions in 2026
Learn how to build HubSpot dashboards that unify marketing, sales, and service data. Step-by-step guide with templates, best practices, and real examples.
-
 Analytics
Power BI Dashboard: Complete Guide for Marketing Data Analysts (2026)
Build powerful Power BI dashboards that unify marketing data from 1,000+ sources. Step-by-step guide with automation strategies, common mistakes, and proven templates.
-
 Analytics
Jira Dashboard: A Complete Guide for Marketing Data Analysts in 2026
Learn how to build, customize, and optimize Jira dashboards for marketing data analysis. Step-by-step guide with templates, best practices, and tool comparisons.
-
 Analytics
CTV Measurement: Complete Guide for Performance Marketers (2026)
Master CTV measurement: track impressions, attribute conversions, optimize campaigns. Learn metrics, attribution models, and tools that connect CTV performance to revenue.
-
 Analytics
6sense vs Demandbase: 2026 Feature Comparison for Marketing Ops Leaders
Compare 6sense and Demandbase side-by-side: account intelligence, intent data, orchestration, and pricing. Find the right ABM platform for your marketing ops stack in 2026.
-
 Analytics
Hospitality Identity Resolution: A Complete Guide for 2026
Learn how hospitality brands use identity resolution to connect guest touchpoints, personalize experiences, and drive loyalty. Step-by-step guide with tools and best practices.
-
 Analytics
Northbeam vs Triple Whale: Which E-Commerce Attribution Tool Is Right for You in 2026?
Compare Northbeam and Triple Whale for e-commerce attribution. Detailed breakdown of pricing, features, MMM vs MTA, and when to choose each tool for DTC brands.
-
 Analytics
Porter Metrics: What It Is, How It Works, and Better Alternatives in 2026
Porter Metrics connects marketing data to Looker Studio at $15/month. But is it enough for enterprise teams? Compare features, pricing, and scalable alternatives.
-
 Analytics
FINRA 2210: A Complete Guide to Marketing Communications Compliance in 2026
Navigate FINRA Rule 2210 with confidence. Learn the approval requirements, prohibited content, and documentation workflows that keep broker-dealer marketing compliant.
-
 Analytics
Roku Ad Manager: Self-Serve CTV Advertising for Performance Marketers (2026)
Learn how Roku Ad Manager enables self-serve CTV advertising with audience targeting, budget control, and performance tracking—plus how to scale campaigns with unified data.
-
 Analytics
CallRail HIPAA Compliance: A Complete Guide for Healthcare Marketers (2026)
Is CallRail HIPAA compliant? Learn what healthcare marketers need to know about CallRail's security features, BAA requirements, and how to track calls while protecting PHI.
-
 Analytics
Circana Data: What It Is, How It Works, and Why Marketers Need It in 2026
Circana is a consumer intelligence platform tracking 290M+ households across CPG, retail, and restaurants. See how it works and pricing for 2026.
-
 Analytics
What Is Salesforce Financial Services Cloud? Features, Benefits & Use Cases (2026)
Salesforce Financial Services Cloud is an industry-specific CRM built for wealth managers, advisors, and banking teams. Learn how FSC centralizes client data, automates workflows, and drives personalized engagement at scale.
-
 Analytics
MLR Review Process: A Complete Guide for Life Sciences Marketing in 2026
Learn how to streamline your MLR review process with proven workflows, compliance frameworks, and automation tools that reduce approval times by up to 60%.
-
 Analytics
What Is Veeva PromoMats? A Complete Guide for Marketing Ops Teams in 2026
Veeva PromoMats is a compliant promotional content platform for life sciences marketers. Learn how it streamlines review, approval, and distribution workflows.
-
 Analytics
IRI Data Explained: What It Is, How It Works, and Why It Matters in 2026
IRI data tracks consumer purchases across retail channels, giving CPG and retail marketers granular insight into sales performance, shelf share, and promo effectiveness.
-
 Analytics
What is Flashtalking? Ad Server & Creative Management Explained (2026)
Flashtalking is an enterprise ad server and creative management platform. Learn how it works, key features, pricing, and whether it fits your marketing stack.
-
 Analytics
GitHub API for Marketing Data Analysis: Complete Guide 2026
Learn how to use GitHub API for marketing data workflows. Extract engineering insights, automate reporting, and connect developer activity to campaign performance.
-
 Analytics
HubSpot API: Complete Guide for Marketing Data Analysts (2026)
Master the HubSpot API for marketing analytics. Learn authentication, endpoints, rate limits, and how to extract contacts, deals, campaigns, and attribution data at scale.
-
 Analytics
Shopify API: Complete Guide for Marketing Data Analysts (2026)
Master Shopify API integration for marketing analytics. Learn authentication, data extraction, automation workflows, and how to connect Shopify to your data warehouse.
-
 Analytics
Jira API: Complete Guide to Integration and Automation in 2026
Master the Jira API for marketing data workflows. Step-by-step guide to authentication, endpoints, and automating project tracking with real-world examples.
- Analytics
Human-AI Collaboration in Marketing Analytics: The 2026 Guide for Data-Driven Teams
Marketing analysts trust AI for execution but not strategy. Learn how to build human-AI collaboration workflows that combine automation with strategic control.
-
 Analytics
AI Agent Governance in 2026: How Marketing Teams Control Autonomous Systems
Marketing teams deploy AI agents without governance—and pay with data drift, hallucinated reports, and compliance risk. Here's how to control autonomous systems.
-
 Analytics
AI Agent Security in 2026: How to Protect Data, Prevent Breaches, and Control Access
72% of enterprises pilot AI agents, but only 31% secure them properly. Learn how to protect data, prevent prompt injection, and control access in production environments.
-
 Analytics
Value-Based Pricing in 2026: The Complete Guide for SaaS and B2B
Master value-based pricing for SaaS and B2B. Learn how to align pricing with customer outcomes, calculate willingness to pay, and implement strategies that maximize revenue.
-
 Analytics
How to Use Digital Marketing Analytics to Optimize Campaign Results in 2026
Learn how to turn fragmented campaign data into actionable insights. This guide shows marketing data analysts how to measure, optimize, and prove ROI with analytics.
-
 Analytics
How to Choose a Programmatic Advertising Platform for Digital Marketing Campaigns in 2026
Learn how to evaluate programmatic advertising platforms for your campaigns. Compare DSPs, DMPs, and SSPs. Get decision criteria used by performance marketing teams.
-
 Analytics
Marketing Team Structure: How to Build and Scale High-Performance Teams in 2026
Build a marketing team structure that scales. Complete breakdown of roles, org models, and hiring strategies for VP/Directors managing growing marketing departments.
-
 AI
AIAI Accountability: Who Owns the Miss When the CFO Reads the Wrong Number?
When an AI dashboard hands the CFO a confidently wrong number, who owns the miss? A practical AI accountability framework, RACI matrix, and governance architecture for finance-grade AI reporting.
-
 AI
AIAI Compliance and Corporate Governance: Who Owns the Call When a Model Votes on the Board?
AI compliance is no longer about whether to use AI in regulated decisions, it's about who owns the call when the model is in the chain. Two scenarios, four frameworks, one diagnostic.
-
 AI
AISaaS Is Not Dead: Why Per-Seat SaaS Pricing Models Are Being Replaced by Outcomes
SaaS isn't dead. Per-seat pricing is. Here's why SaaS pricing models are shifting from headcount to outcomes, and how to evaluate any tool's pricing in 2026.
-
 AI
AIAI Job Loss in 2026: What the Historical Record Actually Says About AI and Employment
AI job loss is real in the short run: NBER projects 502,000 cuts in 2026. But every prior tech revolution ended with more work, higher wages, and shorter hours. Here's the long-run shape.
-
 AI
AIAI Agent Memory Is Not Search: Why Your LLM Context Window Is an Archive, Not a Brain
AI agent memory and search are not the same thing. Here's why a bigger context window doesn't give your agent a brain — and what the missing layer actually looks like.
-
 AI
AISecure Agents or Shadow Ones: How Prompt Injection, Shared Keys, and Tool Sprawl Quietly Compromise Your Stack
Prompt injection, shared credentials, and tool sprawl turn shadow AI agents into data leaks. Here's the architectural pattern that makes the dangerous things structurally impossible.
-
 AI
AIWhat Actually Works When You're Running 70+ Autonomous Agents
Most AI agent governance frameworks are committee-shaped. The marketing failure mode is architectural. Here's the 4-dimension runtime pattern that holds at 70+ agents.
-
 AI
AIMarketing Data Integrations Are the Real AI Moat: Why 1000+ Connectors Beat a Smarter Model
Everyone's racing to build smarter agents. We spent 8 years building boring pipes. Here's why marketing data integrations are the unsexy infrastructure that decides whether your AI stack survives the next API change.
-
 AI
AIWhy Pharma Marketing AI Needs an Industry-Specific Knowledge Graph (And Why Generic Agents Are a Compliance Liability)
A generic AI marketing agent in pharma is a lawsuit waiting to happen. Here's why regulated industries need an industry-specific knowledge graph — and what one actually encodes.
-
 AI
AIConversational UI vs Buttons: AI Agents Don't Kill the Click. They Compress It.
Bret Taylor said AI agents will kill button-clicking. The more accurate read: agents absorb navigation clicks and compress UI down to the few clicks that actually own a decision.
-
 AI
AIThe AI-Native Marketing Team Is a Hiring Trap
Every CEO wants an AI-native marketing team. Here's why the best operators of AI agents inside our customers are ten-year veterans, not AI-native juniors — and what to hire for instead.
-
 MarTech
Agent Sprawl in Marketing: Why 14 Disconnected AI Tools Quietly Kill ROI
Marketing teams now run an average of 14 AI tools with zero shared memory. Here's how agent sprawl silently erodes ROI — and the architectural fix.
-
 Analytics
Amazon S3 Analytics: Complete Guide to Storage Insights in 2026
Master Amazon S3 analytics with Storage Class Analysis and Storage Lens. Learn to optimize costs, track usage patterns, and automate data lifecycle decisions.
-
 Analytics
Reddit Analytics: The Complete Guide for Performance Marketers in 2026
Learn how to track Reddit campaigns, analyze user behavior, and measure ROI with Reddit analytics. A step-by-step guide for performance marketers with tools and templates.
-
 Analytics
Braintree Analytics: A Complete Guide for Marketing Data Analysts in 2026
Learn how to extract, analyze, and visualize Braintree payment data for marketing insights. Complete guide with implementation steps, metric frameworks, and automation tools.
-
 Analytics
MailerLite Analytics: Complete Guide to Email Performance Tracking in 2026
Master MailerLite analytics with this complete guide. Learn how to track campaigns, build custom reports, and connect email data to your marketing stack for better ROI.
-
 Analytics
Chargebee Analytics: A Complete Guide for Marketing Data Analysts (2026)
Master Chargebee analytics for subscription revenue reporting. Learn how to extract metrics, build dashboards, and connect billing data to marketing performance.
-
 Analytics
ConvertKit Analytics: A Complete Guide for Performance Marketers in 2026
Learn how to track ConvertKit performance, connect email data to your marketing stack, and measure true ROI. A practical guide for performance marketing teams.
-
 Analytics
ConvertKit Analytics: Complete Guide for Marketing Analysts (2026)
ConvertKit's native analytics fall short for serious marketing analysis. Learn what's missing, how to bridge gaps, and when to adopt enterprise-grade email marketing analytics.
-
 Analytics
Mailgun Analytics: Complete Guide for Marketing Data Analysts (2026)
Master Mailgun analytics: track email performance, monitor deliverability, and centralize campaign data. Step-by-step guide with API integration and dashboard setup.
-
 Analytics
Mandrill Analytics: Complete Guide to Email Metrics in 2026
Learn how to track, analyze, and act on Mandrill email metrics. Discover what analytics Mandrill offers, its limits, and how to unify transactional email data with your marketing stack.
-
 Analytics
Greenhouse Analytics: Complete Guide for Marketing & HR Teams (2026)
Learn how to extract, analyze, and activate Greenhouse recruiting data for cross-functional reporting. Integration patterns, common pitfalls, and tools that help.
-
 Analytics
Ashby Analytics: Complete Guide to Recruiting Data in 2026
Learn how Ashby Analytics transforms recruiting data into strategic decisions. Build reports, track hiring metrics, and connect ATS data to your marketing stack.
-
 Analytics
Outreach Analytics: Complete Guide for Marketing Analysts (2026)
Learn how to measure outreach performance, connect analytics tools, and build dashboards that track what matters. Complete guide with frameworks, tools, and real examples.
- Analytics
Seismic Analytics: The Complete Guide for Marketing Data Analysts (2026)
Learn how to extract, analyze, and act on Seismic content analytics. Step-by-step guide with best practices, common mistakes, and tool comparisons for 2026.
-
 Analytics
SalesLoft Analytics: A Complete Guide for Marketing Data Analysts (2026)
Master SalesLoft analytics: extract sales engagement data, build custom reports, and integrate with your data warehouse. Complete guide with real workflows.
-
 Analytics
Taboola Analytics: Complete Guide to Tracking, Reporting & Attribution in 2026
Learn how to track Taboola campaign performance, integrate analytics across platforms, and solve attribution gaps. Step-by-step guide for performance marketers.
-
 Analytics
Google Business Profile Analytics: Complete Guide for Marketing Data Analysts (2026)
Learn how to extract, analyze, and activate Google Business Profile analytics data at scale. Complete guide for marketing data analysts with pipeline automation strategies.
-
 Analytics
11 Best AI Solutions for Ecommerce in 2026 (with Practical Examples)
Compare 11 AI solutions for ecommerce that improve personalization, inventory, and marketing analytics. Real-world examples, pricing, and implementation guidance.
-
 Analytics
15 Best TikTok Ads Tools to Optimize Your Campaigns in 2026
Compare the top TikTok ads tools for campaign management, analytics, creative testing, and cross-channel reporting. Find the right platform for your ad strategy.
-
 Analytics
10 Best Data Mesh Companies in 2026: Tools, Vendors & Solutions Compared
Compare the top data mesh companies in 2026. Vendor features, pricing, use cases, and implementation guides to help marketing teams choose the right platform.
-
 Analytics
LTV to CAC Ratio: How to Calculate, Interpret, and Improve It in 2026
Learn how to calculate LTV:CAC ratio, interpret benchmarks for your stage, and use unified marketing data to improve it. Includes formulas, examples, and tools.
-
 Analytics
HubSpot Reporting: Complete Guide for Marketing Analysts (2026)
Master HubSpot reporting with this comprehensive guide. Learn to build custom dashboards, automate data workflows, and unlock marketing insights in 2026.
-
 Analytics
Data Quality Checks: The Complete Guide for Marketing Analysts (2026)
Learn how to implement automated data quality checks that catch errors before they reach your dashboards. Step-by-step guide with real validation rules.
-
 Analytics
Self-Service Analytics in 2026: How It Works, Benefits & Implementation Guide
Learn how self-service analytics empowers marketing analysts to explore data independently. Discover key components, implementation steps, and platform comparison for 2026.
-
 Analytics
Skyvia vs Integrate.io: Which Data Integration Tool Fits Your Stack in 2026?
Compare Skyvia and Integrate.io head-to-head: connectors, pricing, real-time sync, and which tool fits marketing data teams. Find the right platform for your needs.
-
 Analytics
8 Data Integration Tools Like Improvado to Unify Marketing Data in 2026
Compare 8 enterprise data integration platforms built for marketing teams. Learn which tools handle multi-touch attribution, schema changes, and 1,000+ data sources.
-
 Analytics
Talend vs Fivetran: Which Data Integration Tool is Right for You in 2026?
Compare Talend and Fivetran for marketing data integration. Features, pricing, connectors, and limitations—plus why analysts choose purpose-built alternatives.
-
 Analytics
Hevo vs Skyvia: Which ETL Tool is Best for Marketing Analytics in 2026?
Compare Hevo and Skyvia for marketing data integration. Explore pricing, connectors, transformations, and why marketing teams need purpose-built solutions in 2026.
-
 Analytics
Agency Analytics vs TapClicks: 2026 Comparison for Marketing Data Analysts
Marketing data analysts compare Agency Analytics vs TapClicks: connectors, pricing, white-label options, and which platform handles 100+ client reporting at scale.
-
 Analytics
Dell Boomi vs Talend: Which Data Integration Platform Fits Your Marketing Stack in 2026?
Compare Dell Boomi and Talend for marketing data integration. Which platform handles your ad platforms, CRMs, and analytics tools without breaking the budget?
-
 Analytics
WorkFusion vs UiPath: 2026 Comparison for Marketing Automation Teams
Compare WorkFusion and UiPath for marketing automation. Discover features, pricing, use cases, and why marketing teams need specialized tools beyond general RPA platforms.
-
 Analytics
Matillion vs MuleSoft: Which Integration Platform Fits Your Marketing Stack in 2026?
Matillion vs MuleSoft for marketing data integration: compare connectors, pricing, transformation capabilities, and marketing-specific features to choose the right platform.
-
 Analytics
Informatica vs Skyvia: 2026 Comparison for Marketing Data Integration
Compare Informatica and Skyvia for marketing data integration. Detailed breakdown of pricing, connectors, scalability, and support to help analysts choose the right platform.
-
 Analytics
Matillion vs Skyvia: Which Data Integration Platform Is Right for You in 2026?
Compare Matillion and Skyvia for data integration: features, pricing, and use cases. See which platform fits your team's needs — plus a third option built for marketing data.
-
 Analytics
Instagram Hashtag Analytics: Complete Guide for Marketing Data Analysts (2026)
Learn how to track, analyze, and optimize Instagram hashtag performance. Step-by-step guide with metrics, tools, and measurement frameworks for data-driven analysts.
-
 Analytics
Denodo vs Tableau: Which Tool Should You Use in 2026?
Denodo and Tableau solve different problems. Compare data virtualization vs visualization, learn when to use each, and discover a unified alternative.
-
 Analytics
Matillion vs Talend: In-Depth Comparison for Marketing Data Analysts (2026)
Compare Matillion and Talend for marketing data integration. Architecture, connectors, pricing, and which tool fits your analytics stack—plus a third option built for marketing.
-
 Analytics
AppsFlyer Analytics: The Complete Guide for Performance Marketing Managers (2026)
Master AppsFlyer analytics for mobile attribution, cohort analysis, and LTV tracking. Learn how to connect AppsFlyer data with your marketing warehouse in 2026.
-
 Analytics
BigCommerce Analytics: Complete Guide to Tracking, Reporting & Optimization (2026)
Master BigCommerce analytics with our complete guide. Learn to set up tracking, build dashboards, and connect data from GA4, Meta, and Google Ads for better ROI.
-
 Analytics
Mode Analytics: Complete Guide for Marketing Data Analysts in 2026
Mode Analytics offers SQL-based analysis for technical teams. Learn capabilities, limitations, and when embedded BI fits marketing data workflows in 2026.
-
 Analytics
Magento Analytics: A Complete Guide for Marketing Data Analysts (2026)
Learn how to set up Magento analytics, integrate Google Analytics 4, automate reporting, and scale data operations. A complete 2026 guide for marketing data analysts.
-
 Analytics
Braze Analytics: Complete Guide for Marketing Data Analysts in 2026
Learn how to set up, analyze, and optimize Braze analytics for customer engagement campaigns. Covers reports, segment tracking, event analytics, and data export best practices.
-
 Analytics
WooCommerce Analytics: A Complete Guide for Data-Driven E-commerce in 2026
Master WooCommerce analytics in 2026. Learn to track sales, customer behavior, and marketing ROI with native reports, integrations, and advanced platforms.
-
 Analytics
Adobe Marketing Cloud Analytics: Complete Implementation Guide for 2026
Learn how to implement Adobe Analytics within Adobe Experience Cloud. Complete guide covering setup, integration, reporting, and optimization for marketing data analysts.
-
 Analytics
Plausible Analytics: Complete Guide for Marketing Teams in 2026
Plausible Analytics offers lightweight, privacy-first web tracking—but lacks multi-touch attribution and data integration. See when it works and when teams need more.
-
 Analytics
Zoho CRM Analytics: Complete Guide for Marketing Data Analysts (2026)
Master Zoho CRM analytics: dashboards, reports, Zia AI insights. Learn to extract pipeline data, connect external sources, and avoid common mistakes in 2026.
-
 Analytics
Ahrefs Analytics: A Complete Guide for Marketing Data Analysts (2026)
Discover how Ahrefs Analytics helps marketing data analysts track website performance, user behavior, and SEO impact—plus how to scale beyond its limits.
-
 Analytics
Matomo Analytics: Complete Guide for Marketing Data Teams in 2026
Master Matomo analytics with this complete guide for data teams. Learn setup, privacy compliance, tracking implementation, and how to integrate Matomo with your marketing stack.
-
 Analytics
SEMrush Analytics: How to Use It for Marketing Data Analysis in 2026
Learn how marketing data analysts use SEMrush Analytics to track website traffic, audit competitors, and export SEO data into centralized dashboards for better reporting.
-
 Analytics
Google Ecommerce Analytics: Complete Implementation Guide (2026)
Set up Google Analytics 4 ecommerce tracking step-by-step. Automate data pipelines, eliminate manual tagging, and get accurate attribution with real-time dashboards.
-
 Analytics
Qlik Analytics: Complete Guide for Marketing Data Analysts (2026)
Learn how Qlik Analytics works, what it offers marketing teams, and when to choose specialized marketing analytics platforms for faster activation.
-
 Analytics
Sisense Analytics: Complete Guide for Marketing Teams in 2026
Complete guide to Sisense analytics: embedded BI capabilities, ElastiCube architecture, pricing, implementation, and how marketing teams use it for campaign reporting.
-
 Analytics
MySQL Analytics: Complete Guide for Marketing Data Teams in 2026
Marketing data analysts: learn how to run analytics on MySQL databases — queries, reporting, integration with BI tools, and when a data connector makes sense.
-
 Analytics
Azure SQL Analytics: Complete Guide for Marketing Data Analysts in 2026
Learn how to implement Azure SQL Analytics for marketing data analysis. Step-by-step guide to setup, optimization, and integration with marketing platforms.
-
 Analytics
PostgreSQL Analytics: Complete Guide for Marketing Data Teams in 2026
Learn how to run PostgreSQL analytics on marketing data — from setup to advanced queries. Includes real-world use cases, best practices, and when to scale beyond Postgres.
-
 Analytics
Amazon Seller Central Analytics: Complete Guide for Data-Driven Sellers (2026)
Master Amazon Seller Central analytics to optimize performance, track KPIs, and scale your business. Learn how to extract insights from native reports and advanced tools.
-
 Analytics
Moz Analytics: Complete Guide to SEO Analytics & Performance Tracking in 2026
See how Moz analytics tracks keyword rankings, backlinks, and site-crawl health inside Moz Pro, and how to connect that data to revenue reporting.
-
 Analytics
SendGrid Analytics: A Complete Guide to Email Performance Tracking in 2026
Learn how to use SendGrid analytics to track email performance, troubleshoot delivery issues, and unify email data with your marketing stack. Includes real setup examples.
-
 Analytics
Twitter Analytics in 2026: Complete Guide for Marketing Data Analysts
Master Twitter (X) analytics in 2026. Learn to track engagement, measure ROI, and connect X data to your marketing stack. Complete guide with metrics, tools, and automation strategies.
-
 Analytics
Spotify Ads Analytics: Complete Guide for Performance Marketers (2026)
Master Spotify Ads Analytics to track campaign performance, measure attribution, and prove ROI. Step-by-step guide with real benchmarks and cross-platform integration.
-
 Analytics
Zendesk Chat Analytics: A Complete Guide to Tracking and Optimizing Support Performance in 2026
Learn how to set up, track, and analyze Zendesk chat metrics that matter. Discover which KPIs drive support performance and how to build dashboards that reduce response time by 29%.
-
 Analytics
Facebook Pages Analytics: Complete Guide for Marketing Data Analysts (2026)
Master Facebook Pages analytics with this complete guide. Learn which metrics matter, how to connect data sources, and automate reporting for accurate insights.
-
 Analytics
Microsoft SQL Server Analytics: Complete Guide for Marketing Data Teams (2026)
Learn how to build marketing analytics on SQL Server Analysis Services (SSAS). Step-by-step guide for marketing data analysts building OLAP cubes, DAX measures, and dashboards.
-
 Analytics
Pipedrive Analytics: Complete Guide to CRM Reporting in 2026
Build powerful Pipedrive analytics workflows that connect CRM data to your marketing stack. Learn how marketing data analysts extract insights from deals, contacts, and campaigns—without manual exports.
-
 Analytics
Stripe Analytics: A Complete Guide for Data-Driven Teams in 2026
Master Stripe analytics in 2026. Learn how to track payment metrics, build dashboards, and connect Stripe data to your BI stack for unified revenue reporting.
-
 Analytics
Adobe Commerce Analytics: Complete Implementation Guide for 2026
Learn how to implement Adobe Commerce Analytics for e-commerce tracking, reporting, and attribution. Step-by-step guide with integration best practices for 2026.
-
 Analytics
ClickHouse Analytics: How to Build Fast, Scalable Marketing Dashboards in 2026
ClickHouse handles billions of marketing events with sub-second query speeds. Learn how to build real-time analytics dashboards that scale without breaking.
-
 Analytics
Zendesk Analytics in 2026: 7 Best Tools + Comparison Guide
Compare the 7 best Zendesk analytics tools in 2026. Learn what Zendesk Explore offers, when to integrate external platforms, and how to choose the right solution.
-
 Analytics
TikTok Business Analytics: Complete Guide for Data-Driven Marketers in 2026
Learn how to track, analyze, and optimize TikTok performance with advanced business analytics. Connect TikTok data to your stack, measure ROI, and scale campaigns.
-
 Analytics
Azure Data Lake Analytics: A Complete Guide for Marketing Data Analysts (2026)
Learn how Azure Data Lake Analytics processes marketing data at scale. Step-by-step guide for analysts: setup, U-SQL optimization, integration, and best practices.
-
 Analytics
Mailchimp Analytics: Complete Guide to Email Performance Tracking in 2026
Master Mailchimp analytics with our complete guide. Learn to track open rates, clicks, conversions, and ROI. Includes limitations, workarounds, and integration strategies.
-
 Analytics
Gong Analytics: A Complete Guide to Revenue Intelligence in 2026
Learn how Gong analytics transforms sales conversations into revenue intelligence. Explore features, use cases, and how to maximize ROI from conversation data.
-
 Analytics
Klaviyo Analytics: 9 Best Practices for Email Marketing Data in 2026
Master Klaviyo analytics with 9 proven practices for Marketing Data Analysts. Extract campaign performance, automate reporting, and integrate email data with your entire marketing stack.
-
 Analytics
Salesforce Marketing Cloud Analytics: A Complete Guide for 2026
Learn how to unlock insights from Salesforce Marketing Cloud analytics. Step-by-step guide covering setup, reporting, and integration for data-driven marketing teams.
-
 Analytics
Amazon Redshift Analytics: 7 Ways to Unlock Your Data Warehouse in 2026
Redshift analytics powers insights for marketing teams managing petabytes of data. Learn how to optimize queries, integrate BI tools, and turn your warehouse into a decision engine.
-
 Analytics
Google Search Console Analytics: Complete Guide for Marketing Data Analysts (2026)
Learn how to extract, analyze, and operationalize Google Search Console data. Complete guide to GSC analytics, API integration, and automated reporting for data teams.
-
 Analytics
Marketing Audit Guide 2026: How to Run a Comprehensive Audit That Drives ROI
Learn how to run a marketing audit that uncovers wasted spend, broken attribution, and missed opportunities. Step-by-step framework with real KPIs and tools.
-
 Analytics
Monthly Marketing Report Template: A Complete Guide for Marketing Analysts (2026)
Build monthly marketing reports that stakeholders actually read. Step-by-step guide with templates, metrics, and automation tips for marketing analysts.
-
 Analytics
Segment vs Amplitude: Which Customer Data Platform Is Right for Your Team in 2026?
Compare Segment and Amplitude for customer data management. Analysis of integrations, analytics capabilities, pricing, and implementation for marketing data teams.
-
 Analytics
Looker vs Sisense: Which BI Platform Is Right for Your Marketing Team in 2026?
Compare Looker and Sisense for marketing analytics. See pricing, dashboards, embedded features, and limitations — plus why teams choose Improvado for multi-source reporting.
-
 Analytics
Google Ad Manager Analytics: Complete Guide for Data Analysts (2026)
Learn how to extract, analyze, and activate Google Ad Manager data. From native GA4 integration to advanced cross-platform attribution workflows.
-
 Analytics
Facebook Business Analytics: Top 9 Tools & Strategies for Marketing Data Analysts in 2026
Compare the 9 best Facebook business analytics tools for 2026. Learn how marketing data analysts centralize campaign data, measure ROI, and automate reporting.
-
 Analytics
Domo Analytics in 2026: Features, Use Cases, and Alternatives for Marketing Teams
Explore Domo's analytics platform: data connectors, AI capabilities, pricing, and real-world use cases. Compare alternatives and find the right solution for your team.
-
 Analytics
CMO Dashboard Template: Build Executive Reporting That Drives Decisions (2026)
Build a CMO dashboard that surfaces the metrics boards care about. Pre-built templates, proven frameworks, and automation strategies that turn fragmented data into executive intelligence.
-
 Analytics
Data Pipeline Automation: A Complete Guide for Marketing Analysts (2026)
Learn how to automate data pipelines for marketing analytics. Step-by-step framework, tools comparison, and real-world implementation patterns for analysts.
-
 Analytics
Data Integration Challenges: A Complete Guide for Marketing Data Analysts (2026)
Marketing data trapped in silos? Learn how to solve the 7 most common data integration challenges—schema conflicts, API limits, data quality issues, and more.
-
 Analytics
Google Data Studio Pros and Cons: A Complete 2026 Evaluation for Analysts
Comprehensive analysis of Google Data Studio (Looker Studio) advantages and limitations for marketing analysts. Compare features, performance, and alternatives.
-
 Analytics
12 Best Data Transformation Software Tools for Marketing Analytics in 2026
Compare the top data transformation software for marketing analytics. Evaluate features, pricing, and capabilities to find the right solution for your team in 2026.
-
 Analytics
Snowflake Analytics: Complete Guide for Marketing Data Teams in 2026
Learn how to build scalable marketing analytics on Snowflake. Connect data sources, transform raw data, and deliver insights that drive growth—without SQL bottlenecks.
-
 Analytics
Databricks Analytics: A Complete Guide for Marketing Teams (2026)
Learn how Databricks analytics works for marketing data teams — what it does, when to use it, common pitfalls, and how to get started without engineering overhead.
-
 Analytics
Power BI Analytics for Marketing: A Complete Guide (2026)
Master Power BI analytics for marketing data. Learn how to connect sources, build dashboards, and avoid common pitfalls. Includes DAX tips, refresh strategies, and automation workflows.
-
 Analytics
Salesforce Analytics: A Complete Guide for Marketing Data Analysts in 2026
Learn how to leverage Salesforce Analytics for marketing insights. Step-by-step guide for data analysts covering setup, reporting, and integration.
-
 Analytics
HubSpot Analytics: The Complete 2026 Guide for Marketing Data Analysts
Master HubSpot analytics in 2026. Learn how marketing data analysts build reports, track attribution, and work around native limitations with proven workarounds.
-
 Analytics
15 Best Market Segmentation Tools for Marketing Data Analysts in 2026
Compare the top 15 market segmentation tools for B2B marketing data analysts. Real pricing, integration reviews, and AI capabilities — plus a framework for choosing the right platform.
-
 Analytics
Piwik PRO Analytics: Complete Guide for Data Analysts in 2026
Complete guide to Piwik PRO Analytics for marketing data analysts. Learn implementation, privacy-first tracking, custom dashboards, and how to scale beyond its limitations.
-
 Analytics
Amazon Vendor Central Analytics: A Complete Guide for 2026
Learn how to extract, analyze, and act on Amazon Vendor Central data. This guide covers every report type, API integration, and automation strategy for 2026.
-
 Analytics
Marketing Funnel Dashboard: A Complete Guide for Data Analysts (2026)
Build marketing funnel dashboards that actually reveal drop-off points, attribution gaps, and conversion blockers. Real-world setup, KPIs, and tool comparisons.
-
 Analytics
Domo vs Sisense: 2026 Comparison Guide for Marketing Data Analysts
Compare Domo and Sisense for marketing analytics. See how each handles connectors, data prep, and real-time dashboards—plus a third option built for marketing teams.
-
 Analytics
Tableau Analytics: Complete Guide for Marketing Data Analysts in 2026
Learn how to build powerful marketing analytics in Tableau. Step-by-step guide covering dashboards, data connections, calculations, and common pitfalls to avoid.
-
 Analytics
Campaign Attribution: A Complete Guide for Performance Marketers (2026)
Learn how to implement campaign attribution that tracks every touchpoint, allocates credit accurately, and proves marketing ROI. Step-by-step guide with real examples.
-
 Analytics
Multi-Channel Marketing Dashboard: Complete Guide for Data Analysts in 2026
Build dashboards that unify campaign data across channels. Connect platforms, automate reporting, and show ROI — complete implementation guide for marketing analysts.
-
 Analytics
ThoughtSpot vs Tableau in 2026: Which BI Tool Fits Your Marketing Analytics Needs?
Compare ThoughtSpot and Tableau for marketing analytics. Feature breakdown, pricing models, AI capabilities, and when each tool works best for data teams in 2026.
-
 Analytics
15 Best BI Tools for Marketing Data Teams in 2026
Compare the top business intelligence tools for marketing analytics. See which BI platforms handle multi-channel data, custom metrics, and real-time dashboards.
-
 Analytics
Marketo Analytics in 2026: Complete Guide for Marketing Data Analysts
Learn how Marketo analytics works, what it tracks, and how marketing data analysts can unify campaign, engagement, and revenue data for complete attribution visibility.
-
 Analytics
Looker vs ThoughtSpot: A Complete Comparison for Marketing Analytics in 2026
Compare Looker and ThoughtSpot for marketing analytics: pricing, SQL requirements, AI search, and integration challenges. See how modern data teams choose between them.
-
 Dashboards
Creative Analytics Dashboard: Build Cross-Platform Ad Insights in 2026
Build a creative analytics dashboard that unifies Meta, Google, TikTok, and 1,000+ sources. Track creative performance across platforms without spreadsheets.

-
 Performance
Salesforce Marketing Attribution: Complete Guide for Performance Marketers (2026)
Learn how to set up Salesforce marketing attribution, overcome multi-touch tracking challenges, and connect cross-channel data for accurate campaign ROI measurement.
.jpeg)
-
 Analytics
Account Based Marketing Metrics That Matter in 2026: 15 KPIs to Track
Track the account based marketing metrics that predict revenue. From engagement scores to pipeline velocity, learn which KPIs separate winning ABM programs from noise.
-
 Analytics
GDPR Fines in 2026: A Complete Guide to Enforcement, Penalties, and Compliance
GDPR fines exceeded €7.1B since 2018. Learn how regulators calculate penalties, what triggers audits, and how marketing teams protect customer data in 2026.
-
 Titan Talks
Podcast Advertising in 2026: The Complete Guide for Performance Marketers
Podcast ad spend exceeds $5B globally in 2026. This guide covers targeting, attribution, measurement, and how to scale podcast campaigns that deliver $4.90+ ROAS.
-
 Analytics
Auto Inventory Ads Keyword Strategy: Comprehensive Guide for 2026
Master auto inventory ads keyword strategy for automotive dealers. Learn feed optimization, bidding tactics, and performance tracking that drive qualified leads at scale.
-
 Analytics
Ad Fraud in 2026: Detection, Prevention, and Protection Strategies
Ad fraud will exceed $100 billion in 2026. Learn how performance marketers detect invalid traffic, prevent click fraud, and protect budgets with real-time data governance.
-
 Analytics
Marketing Lift: The Ultimate Guide to Measuring Campaign Incrementality (2026)
Learn how to measure marketing lift using incrementality testing, control groups, and attribution models. Step-by-step guide with formulas, examples, and real-world strategies.
-
 Analytics
8 Best Lead Scoring Software Tools in 2026 (Compared by Real Teams)
Compare 8 lead scoring software platforms tested by performance marketers. Real-world pricing, integrations, and pros/cons to help you prioritize high-intent leads faster.
-
 Analytics
HIPAA Compliant Direct Mail: How to Secure PHI in Offline Campaigns (2026)
Healthcare direct mail delivers 4.4% response rates—37x email—but one PHI breach costs $9.48M. This guide shows how to run HIPAA-compliant campaigns that convert.
-
 Performance
OTT Attribution: A Complete Guide for Performance Marketers in 2026
OTT attribution remains one of the hardest challenges in performance marketing. This guide shows you how to track OTT ad performance, connect streaming impressions to conversions, and prove ROI without walled-garden restrictions.
-
 Analytics
Marketing Orchestration: The Complete 2026 Guide for Modern Teams
Master marketing orchestration in 2026. Learn how to coordinate channels, automate workflows, and deliver consistent customer experiences across every touchpoint.
-
 MarTech
OTT vs CTV: What's the Difference and Why It Matters in 2026
OTT vs CTV explained: Learn the key differences, how each impacts your ad strategy, and which measurement approach drives better ROAS for performance marketers.
-
 Performance
How to Measure Influencer Marketing ROI in 2026: A Complete Guide
Learn how to track influencer ROI: set up UTM links, promo codes, and GA4 tracking to prove revenue impact across every campaign, no manual spreadsheets.
-
 Analytics
Customer Lifetime Value in Excel: Complete 2026 Guide for Marketing Data Analysts
Learn how to calculate customer lifetime value in Excel with formulas, templates, and best practices. Plus: when spreadsheets break and what to use instead.
-
 Performance
What Is First Touch Attribution? A Complete Guide for Marketing Analysts (2026)
First touch attribution credits the first customer interaction with 100% of a conversion. Learn when to use it, how it works, and why B2B teams need multi-touch models instead.
-
 Analytics
10 Best Omni Channel Retail Solutions for Performance Marketers in 2026
Compare the top omni channel retail solutions for unified customer data, inventory sync, and cross-channel attribution. Built for performance marketing teams managing complex retail ecosystems.
-
 Analytics
What Is Conversation Analytics Software? A 2026 Guide for Marketing Data Analysts
Learn what conversation analytics software is, how it works, and why marketing data analysts use it to extract insights from customer interactions across channels.
-
 Analytics
What Is a Knowledge Graph? Components, Use Cases & Implementation (2026 Guide)
Learn how knowledge graphs connect marketing data, automate insights, and power AI-driven analytics. Practical guide for marketing data analysts in 2026.
-
 Analytics
DOOH: What It Is, How It Works, and Why It Matters in 2026
DOOH (digital out-of-home) advertising transforms static billboards into data-driven, programmatic screens. Learn how performance marketers measure ROI across DOOH campaigns.
-
 Analytics
Voice of the Customer Program: What It Is and How to Build One in 2026
Learn how to build a voice of the customer program that collects, analyzes, and acts on feedback. Step-by-step implementation guide for marketing data analysts.
-
 Performance
Marketing Anomaly Detection & Automated Alerts: 2026 Guide
Learn how automated marketing anomaly detection catches spend spikes, CPA drift, and data breaks before they cost you. Thresholds vs ML, implementation guide, tools.

-
 Analytics
Marketing Campaign Taxonomy: The Complete Guide for Data-Driven Teams (2026)
Build a marketing campaign taxonomy that eliminates fragmentation, reclaims 20-30% analyst time, and fixes multi-touch attribution. Includes SQL audits, governance playbooks, and migration strategies.
-
 Dashboards
CMO Dashboard Examples, Metrics & Templates (2026 Guide)
Build a board-ready CMO dashboard: 14 metrics, 4 archetypes, governance playbook, readiness diagnostic, and templates. Gartner: 83% of execs demand ROI proof.

- Analytics
Healthcare Marketing Analytics for Health Systems: Attribution, Infrastructure, and ROI in 2026
Build marketing analytics infrastructure for multi-location health systems. Attribution models, data integration priorities, HIPAA compliance, and ROI frameworks.
- Analytics
Is Google Analytics HIPAA Compliant in 2026? Enforcement Record & Risk Assessment
Google Analytics is not HIPAA compliant in 2026. Analyze settlement forensics, assess page-level risk, and explore warehouse-first alternatives for healthcare marketing.
-
 Analytics
Best Ad Fraud Detection Software in 2026: A Neutral Guide to Click Fraud Protection Platforms
A neutral, alphabetical guide to 10 ad fraud detection and click fraud protection platforms in 2026. How they work, what they're designed for, and how to choose.
-
 Performance
Marketing Mix Modeling vs Multi-Touch Attribution: When to Use Each in 2026
75% of companies use multi-touch attribution, but 40-60% of tracking data is lost to privacy restrictions. This guide maps 12 scenarios to the method that works.
-
 Analytics
What Is Marketing Mix Modeling? Complete Guide for 2026
Marketing mix modeling (MMM) uses aggregated data to measure channel ROI without tracking users. Learn statistical foundations, validation, and implementation.
-
 Analytics
HCP Targeting & Segmentation in Pharma: The 2026 Practitioner's Guide
Master NPI-keyed HCP targeting: failure diagnostics, vendor selection, AI predictive scoring, and field-vs-digital allocation—with 2026 benchmarks.
-
 Analytics
Pharma CMO Board Report Template 2026 — Structure, Metrics & HIPAA-Compliant Attribution
The 2026 pharma CMO board report template: 5-slide structure, 10 metrics, Rx-lift attribution methods, manufacturing readiness tracking, and HIPAA-compliant data architectures.
-
 Analytics
Ad Fraud Detection for HCP Programmatic — A Pharma Guide
Ad fraud in HCP programmatic costs 5-10x more than consumer fraud. Learn detection signals, prevention tactics, and how to surface fraud data across endemic publishers.
-
 Analytics
Consent Management Platform for Pharma: 2026 Compliance Guide
How pharma CMPs handle HIPAA + GDPR dual compliance, MHMDA opt-in, server-side gating, and consent-aware analytics. Includes vendor comparison and audit checklist.
-
 MarTech
SFTP Automation for HCP Publishers — Integrating Doximity, Medscape, and Endemic Pharma Data Feeds
Automated file transfer playbook for pharma HCP publishers. Integrate Doximity, Medscape, and endemic feeds via SFTP automation — schema drift, monitoring, and DWH delivery.
-
 Analytics
HIPAA Compliance Audit Checklist for Marketing Teams (2026 Playbook)
A marketing-team HIPAA compliance audit checklist: scope, OCR audit protocol, 30 action points, and remediation patterns for pixels, tag managers, ESPs, and ad audiences.
-
 Analytics
What Is a BAA? Business Associate Agreements for Pharma Marketing Vendors (2026 Guide)
What is a BAA? A plain-English guide to the business associate agreement every pharma marketing vendor — ad platforms, CRMs, ETL tools — should sign before touching PHI. Covers the 7 required provisions per §164.504(e), red flags, and a pre-signature checklist.
-
 Analytics
Health Insurance Marketing: Complete Guide for Data-Driven Growth in 2026
Master health insurance marketing with data-driven strategies that convert. Learn campaign measurement, attribution modeling, and compliance-ready reporting for 2026.
-
 Analytics
EHR Marketing Integration: How Healthcare Marketers Connect Patient Data in 2026
Learn how healthcare marketers integrate EHR data with campaign platforms to personalize outreach, measure attribution, and prove ROI in HIPAA-compliant workflows.
-
 Analytics
HCP Marketing: Essential Strategies & Tactics for 2026
Discover proven HCP marketing strategies that connect pharma brands with healthcare professionals. From digital channels to compliance—actionable tactics for 2026.
-
 Analytics
Medical Practice Marketing: A Complete Guide for 2026
Medical practice marketing framework: set budgets by revenue, pick channels, calculate acquisition cost, and prove ROI while staying HIPAA-compliant.
-
 Analytics
Patient Acquisition Cost: A Complete Guide for Healthcare Marketing Teams in 2026
Learn how to calculate, track, and reduce patient acquisition cost (PAC). A complete guide with formulas, benchmarks, and marketing strategies for healthcare organizations.
-
 MarTech
Claude Marketing Skills: How to Build Custom AI Tools for Campaign Analysis in 2026
Learn how to build custom Claude marketing skills for campaign analysis, attribution modeling, and data governance. Step-by-step guide with real examples and deployment patterns.
-
 Analytics
17 Best Healthcare Marketing Agencies to Grow Your Brand in 2026
Learn how healthcare marketing agencies can prove patient acquisition, service-line ROI, and campaign performance with governed data.
-
 Analytics
Salesforce Advertising Studio Retirement 2026: Migration Guide for Marketing Ops
Salesforce Advertising Studio retires August 15, 2026. This guide shows marketing ops teams how to migrate audiences, rebuild workflows, and preserve campaign data.
-
 Analytics
Healthcare Social Media Marketing: Compliant Strategy Guide for 2026
Build HIPAA-compliant social campaigns. FDA warning letters cost $15K+. Learn targeting, consent workflows, and governance automation for healthcare marketers.
-
 Analytics
11 Best HIPAA-Compliant Call Tracking Platforms for Healthcare Marketing in 2026
Compare Patient Prism (96% score), Invoca (76%), CallRail (64%) and 8 more healthcare call tracking platforms. BAA requirements, pricing, and attribution capabilities.
-
 Analytics
Best HIPAA-Compliant CRM Platforms Compared for Healthcare Marketing in 2026
Compare HubSpot, Salesforce, Zoho, and 4 more HIPAA-compliant CRMs. See BAA coverage, hidden costs, advertising gaps, and total TCO for healthcare marketing teams.
-
 Performance
Lead-to-Procedure Attribution for Medical Device Marketing: Implementation Guide (2026)
Build attribution systems that track medical device marketing from first touch through procedures. Implementation guide with formulas, schemas, and API integration.
-
 Performance
Wellness Brand Marketing Strategy: HIPAA-Adjacent Attribution Infrastructure for 2026
Build compliant marketing attribution for wellness brands collecting health data. Server-side tracking, first-party measurement, and governance frameworks.
-
 Analytics
Telehealth Marketing Without Pixels: The 2026 HIPAA-Compliant Playbook for DTC Health
Complete playbook for post-pixel telehealth marketing: server-side APIs, first-party data capture, HIPAA compliance, and measurement strategies for DTC health brands.
-
 Analytics
Pharma Ad Compliance 2026: FDA & FTC Requirements for Fair Balance and ISI in DTC Campaigns
FDA & FTC pharma ad compliance guide for 2026: fair balance requirements, ISI standards, dual modality rules, warning letter trends, and compliance automation.
-
 Analytics
Pharma Marketing Strategy 2026: DTC and HCP Blueprint
Learn how pharma marketers connect DTC and HCP campaigns, compliance workflows, CRM, launch KPIs, and executive reporting.
-
 Analytics
Multi-Location Medical Practice Marketing Strategy: How to Scale Patient Acquisition Across Sites (2026 Guide)
Build marketing infrastructure that scales across 3-30 locations. Attribution, budget allocation, HIPAA-compliant tracking, and capacity-based campaigns.
-
 Analytics
DSO Marketing at 800+ Practices: 2026 Growth Playbook for Dental Service Organizations
Scale dental service organization marketing from 100 to 800+ practices. Attribution models, automated governance, data infrastructure for VP/Director of Marketing.
-
 Analytics
Healthcare Lead Generation Strategies for Hospitals and Medical Practices (2026 Guide)
Build HIPAA-compliant healthcare lead generation systems that connect paid ads to patient revenue. Step-by-step guide for hospitals and medical practices.
-
 Performance
Hospital Marketing ROI Measurement and Campaign Playbook 2026
Measure hospital marketing ROI with attribution models, patient LTV calculations, and ROMI benchmarks. Includes phone tracking setup and distortion detection.
-
 Analytics
Healthcare Marketing Strategy: Complete 2026 Guide
Build a healthcare marketing strategy that drives patient acquisition, ensures HIPAA compliance, and proves ROI. Includes frameworks, benchmarks, and case studies.
-
 Analytics
Healthcare Marketing Data Silos: 8 Failure Patterns, Cost Calculator & Integration Decision Framework (2026)
Learn how healthcare marketing teams break down campaign, CRM, call, appointment, and BI data silos for trusted reporting.
-
 Performance
Healthcare Marketing Attribution: Complete Implementation Guide for Marketing Analysts (2026)
Master healthcare marketing attribution with payer-mix weighting, EMR integration, HIPAA compliance, and committee-level tracking. Includes worked examples and maturity framework.
-
 Analytics
Best Healthcare Marketing Agencies 2026: Top Picks for Data-Driven Growth
Compare 12 specialized healthcare marketing agencies by pricing, capabilities, and fit. Includes decision framework, budget ranges, and red flags to avoid.
-
 Analytics
Amazon Ads Data Challenges: 2026 Guide for Marketing Analysts
Marketing analysts face fragmented Amazon Ads data, mismatched metrics, and attribution blind spots. Learn how teams solve reporting chaos and unify performance data.
-
 Performance
Shopify Data Challenges: How to Fix Attribution, Reporting & Integration in 2026
Marketing analysts struggle with Shopify data attribution, manual reporting, and platform integration. Learn how to solve fragmented data flows and regain accuracy.
-
 Performance
Apple Search Ads Data Challenges: 7 Issues Killing Campaign ROI in 2026
Apple Search Ads data challenges cost performance marketers millions. Learn the 7 tracking gaps, attribution breaks, and reporting failures that sabotage ASA ROI.
-
 Analytics
7 HubSpot Data Problems That Marketing and Sales Disagree About
Marketing says one thing, Sales says another — HubSpot data is the battleground. 7 common data problems and how to fix them with agentic pipelines.
-
 Analytics
TikTok Ads Data Challenges: Complete Guide for Marketing Analytics Directors (2026)
Solve TikTok Ads API instability, attribution gaps, creative tracking issues, and iOS conversion loss. Diagnostic tools and enterprise solutions for 2026.
.jpeg)
-
 Performance
Why LinkedIn Ads Attribution Is Broken for B2B (And 7 Other Data Challenges)
LinkedIn Ads attribution doesn't work the way B2B teams expect. 8 data challenges from 108 customers — from offline conversions to CRM sync gaps.
-
 Analytics
DV360 Data Blind Spots: 5 Problems Hiding Behind Your Programmatic Reports
55 DV360 customers process 372K accounts through Improvado. Here are the 5 data blind spots hiding in your programmatic reports — and how to fix them.
-
 Big Data
8 Reasons Your Trade Desk Data Pipeline Keeps Breaking
Your Trade Desk data pipeline breaks more than it should. 8 root causes from API rate limits to cross-device tracking — and automated fixes.
-
 Analytics
CM360 Data Is Lying to You: 5 Reporting Pitfalls in Campaign Manager
Campaign Manager 360 data isn't as accurate as you think. 5 reporting pitfalls from 49 CM360 customers with 251K accounts — and how to fix each one.
-
 Analytics
The 4 Adobe Analytics Data Gaps That Enterprise Teams Accept — And Shouldn't
Enterprise teams accept these 4 Adobe Analytics data gaps as normal. They shouldn't. See how agentic data pipelines close each gap automatically.
-
 MarTech
Why Salesforce Data Never Matches Your Warehouse (5 Root Causes)
Why Salesforce data never matches your warehouse. 5 root causes from integration issues to API limits — based on real data from 28 Improvado customers.
-
 Analytics
Facebook & Meta Ads Data Challenges — The Enterprise Reconciliation Playbook
The nine Meta/Facebook Ads data challenges enterprise teams hit every week — API vs UI discrepancy, ATT impact, CAPI dedup, attribution settling — and the reconciliation architecture that fixes them at scale.
-
 Analytics
Google Ads Data Challenges — 10 Problems (and the Governance Playbook That Fixes Them)
GA4 and Google Ads disagree on conversions. Performance Max hides channel attribution. Pacing eats 10+ hours a week. A senior-analyst walkthrough of the ten Google Ads data problems that break at enterprise and agency scale, and the governance pattern that resolves each one.
-
 MarTech
AI for Advertising: A 2026 Guide to Intelligent Campaign Optimization
Learn how AI for advertising transforms campaign management, automates optimization, and drives performance. Explore real implementations, practical strategies, and tools that work.
-
 MarTech
Marketing AI Use Cases: 12 High-Impact Applications for 2026
Explore proven marketing AI use cases driving ROI in 2026. From predictive attribution to automated reporting, see how AI transforms marketing operations.
-
 MarTech
Top 10 AI Advertising Companies to Watch in 2026
Compare the top 10 AI advertising companies in 2026. Discover platforms that automate campaign optimization, budget allocation, and creative testing at scale.
-
 MarTech
The Future of AI in Marketing: How Intelligent Systems Are Reshaping B2B Strategy in 2026
95% of B2B marketers use AI tools today. Discover how AI analytics, governance, and automation reshape strategy — plus what enterprise teams need to scale without breaking trust.
-
 Analytics
15 Best Data Analytics Platforms for Marketing Analysts in 2026
Compare the best data analytics platforms for marketing teams in 2026. Evaluation criteria, feature breakdowns, and pricing for Improvado, Tableau, Power BI, and more.
-
 Big Data
ETL Process Optimization: Complete Guide for Marketing Teams (2026)
Master ETL process optimization for marketing data. Learn proven strategies to accelerate pipelines, eliminate bottlenecks, and turn data chaos into decisions in 2026.
-
 MarTech
Marketing Automation Landscape 2026: Complete Guide for Modern Teams
Master the marketing automation landscape. Understand tools, architecture, data flow patterns, and integration strategies to build scalable martech stacks in 2026.
-
 Analytics
20 Best Digital Marketing Tools for Performance Marketers in 2026
Discover the 20 best digital marketing tools for performance marketers in 2026. Compare features, pricing, and integrations to build your stack.
-
 Dashboards
AI Dashboard: 12 Best Solutions for Marketing Analytics in 2026
Compare the top 12 AI dashboards for marketing analytics in 2026. Learn how AI-powered dashboards surface insights automatically and cut reporting time by 80%.
-
 MarTech
AI Model Governance for Marketing Operations: A Complete 2026 Guide
Marketing teams deploy AI without guardrails. This guide shows how to implement AI model governance that protects data quality, ensures compliance, and scales safely.
-
 MarTech
Agentic AI vs Generative AI: What Marketing Analysts Need to Know in 2026
Agentic AI autonomously executes complex workflows while generative AI creates content. Learn which AI type your marketing stack needs and how to implement both.
-
 MarTech
Agents in Marketing: From Task Automation to Strategic Decision-Making in 2026
How marketing agents evolved from simple task automation to strategic analytics partners. Practical framework for implementing agent-driven workflows in 2026.
-
 MarTech
Top 10 Professional Services Automation Software Platforms in 2026
Compare the best professional services automation software for marketing ops teams. Evaluate features, pricing, and ROI to streamline project delivery and reporting.
-
 MarTech
AI Marketing Prompts: 2026 Guide to Effective Marketing Automation
Learn how to write AI marketing prompts that deliver actionable insights, automate reporting, and scale your marketing operations without sacrificing accuracy.
-
 MarTech
AI Governance Platforms: 11 Best Solutions for Marketing Teams in 2026
Discover the top AI governance platforms that help marketing teams control AI usage, enforce compliance, and scale safely. Compare features, pricing, and capabilities.
-
 MarTech
AI Targeted Advertising: The Complete Guide for 2026
AI targeted advertising transforms campaign performance through predictive optimization, real-time bidding, and automated creative testing. Learn how to build AI-powered ad strategies that scale.
-
 MarTech
AI and Data Governance in 2026: The Marketing Operations Manager's Framework
47% of companies have embraced agentic AI, but 76% say governance can't keep pace. Learn how marketing ops teams build frameworks that actually work.
-
 MarTech
Supermetrics vs Fivetran: Which Data Pipeline Is Right for Your Marketing Stack in 2026?
Supermetrics vs Fivetran: compare pricing, connectors, use cases, and limitations. See which data pipeline fits your marketing analytics stack in 2026.
-
 MarTech
AI Business Transformation: How Marketing Teams Scale Without Scaling Headcount in 2026
Marketing VPs are using AI to eliminate 38 hours of manual work per analyst every week. Learn how AI business transformation changes reporting, attribution, and team capacity.
-
 MarTech
Types of AI in Marketing: A Comprehensive Breakdown for 2026
Marketing analysts' guide to classifying AI systems in marketing—from predictive analytics to generative tools. Learn which type solves which problem.
-
 MarTech
MCP Server: What It Is, How It Works, and Why Marketing Analysts Should Care in 2026
Model Context Protocol (MCP) servers connect AI agents to your data sources. Learn how MCP servers work, why they matter for marketing analytics, and how to implement them.
-
 MarTech
AI Agents in Marketing Analytics: Complete Guide for 2026
AI agents automate data tasks, surface insights, and free up analyst time. Learn how marketing teams use AI agents to scale analytics without adding headcount.
-
 MarTech
10 Enterprise AI Solutions for Marketing Teams in 2026
Compare the top 10 enterprise AI solutions for marketing analytics and automation. See how Improvado's AI Agent transforms reporting across 1,000+ data sources.
-
 MarTech
Will AI Replace Social Media Managers? The Data Behind the 2026 Shift
89.7% of social media teams use AI daily—but only 5.4% automate fully. Here's what the data reveals about AI's actual role in social media management by 2026.
-
 MarTech
AI for Media Buying: Complete Guide for Performance Marketing Teams (2026)
Learn how AI transforms media buying: automated bid optimization, budget pacing, creative testing, and cross-channel allocation. See tools, workflows, and real ROI.
-
 MarTech
Will AI Replace Data Analysts? The 2026 Reality Behind the Hype
AI won't replace data analysts—it will shift their focus from extraction to strategy. McKinsey finds 78% of companies use AI to augment teams, not replace them.
-
 MarTech
Will AI Replace Marketing Managers in 2026? Data, Reality, and What's Next
91% of marketers use AI, yet marketing manager roles are growing. Here's what AI actually automates, what it can't do, and how VP-level leaders are adapting their teams in 2026.
-
 MarTech
Will AI Replace Digital Marketers? What Performance Teams Need to Know in 2026
AI won't replace marketers — but marketers who use AI will replace those who don't. Here's what changes in 2026, what stays human, and how performance teams adapt.
-
 MarTech
AI Content Strategist: What It Is and How It Works in 2026
Learn what an AI content strategist is, how it transforms marketing operations, and why teams use AI to scale content strategy across channels in 2026.
-
 MarTech
What is an AI Brand Manager? A Complete Guide for Marketing Leaders (2026)
Learn how AI brand managers automate brand governance, asset creation, and consistency tracking. Explore implementation steps, use cases, and ROI benchmarks for 2026.
-
 MarTech
What Is an AI Media Buyer? How Artificial Intelligence Optimizes Ad Spend in 2026
Learn how AI media buyers automate campaign optimization, budget allocation, and bidding across channels. Discover implementation strategies for 2026.
-
 MarTech
AI CMO: How AI Agents Are Reshaping Marketing Leadership in 2026
AI CMO refers to AI systems handling strategic marketing decisions. Learn how AI agents augment human marketing leaders, what they can and can't do, and when to deploy them.
-
 MarTech
What Is an AI Media Planner? How Intelligent Automation Transforms Campaign Strategy in 2026
AI media planners automate campaign optimization, budget allocation, and audience targeting across channels. Learn how performance marketers use AI to eliminate manual planning.
-
 MarTech
AI Marketing Consultant Explained: The Complete 2026 Guide
An AI marketing consultant combines artificial intelligence with strategic marketing expertise to automate analysis, optimize campaigns, and scale data-driven decisions.
-
 Analytics
12 Best Creative Analytics Tools for Marketing Analysts in 2026
Motion, Benly, Triple Whale, and 9 more creative analytics tools tested. See pricing, platform support, and best use cases for each.
-
 MarTech
AI Marketing Agency: How AI Agents Transform Marketing Operations in 2026
AI agents are reshaping marketing agency operations. Learn how VPs and Directors are using AI to automate reporting, optimize campaigns, and scale client services without adding headcount.
-
 Performance
Influencer Marketing ROI: A Complete Guide to Tracking & Optimization (2026)
Learn how to calculate, track, and improve influencer marketing ROI. Step-by-step frameworks, measurement strategies, and proven tactics that drive real results.
-
 Analytics
Conversational Analytics: How Natural Language Query Systems Work (2026 Guide)
Conversational analytics uses NLP to turn plain-language questions into data insights. Learn how it works, what it can't do, and how to evaluate vendor claims.
-
 MarTech
Top 10 Alooma Alternatives for Marketing Data Integration in 2026
Alooma shut down in 2021. Explore 10 alternatives built for marketing data integration—ETL, reverse ETL, and marketing-first platforms compared.
-
 MarTech
10 Best Integrate.io Alternatives for Marketing Data Integration in 2026
Compare 10 leading Integrate.io alternatives for marketing data pipelines. Find the right ETL platform for your team's scale, budget, and technical requirements.
-
 MarTech
10 Best Alternatives to Semarchy.com for Master Data Management in 2026
Compare top Semarchy alternatives for master data management. Explore MDM platforms that deliver better integration, governance, and scalability for enterprise teams.
-
 Analytics
iDashboards Competitors: 11 Best Data Visualization Platforms for 2026
Compare iDashboards alternatives for marketing analytics. See which platforms handle multi-source reporting, real-time metrics, and enterprise-scale data without code.
-
 MarTech
Top 10 Alternatives to Inzata.com for Marketing Analytics in 2026
Compare 10 Inzata alternatives for marketing analytics. Find platforms with better data governance, pre-built connectors, and marketing-specific reporting.
-
 MarTech
Top 11 MetaLab Marketing Alternatives for Marketing Analytics in 2026
Compare 11 MetaLab Marketing alternatives for marketing analytics. Evaluate features, pricing, and integration capabilities to find the right platform for your needs.
-
 MarTech
Singular Review 2026: Alternatives, Pricing & Key Comparison Points
Detailed Singular review covering real user ratings, pricing, and top alternatives. See how Singular compares to Improvado, Adjust, and AppsFlyer for 2026.
-
 MarTech
Best Bizible Alternatives & Competitors in 2026: 9 Tools Reviewed
Compare top Bizible alternatives for enterprise marketing attribution. Features, pricing, and real RevOps team feedback on 9 platforms built for multi-touch attribution at scale.
-
 MarTech
10 Best Alternatives to Lexer CDP in 2026 (Real-World Comparison)
Marketing teams evaluating Lexer CDP alternatives often need stronger multi-channel analytics or enterprise integration. Compare 10 platforms built for high-volume attribution.
-
 MarTech
Top 8 Permutive Competitors for Marketing & Data Teams in 2026
Compare the top Permutive competitors for B2B marketing analytics and data activation. Evaluate capabilities, limitations, and pricing for teams managing cross-channel data.
-
 Performance
10 Best Ruler Analytics Alternatives for Marketing Attribution in 2026
Compare 10 Ruler Analytics alternatives for marketing attribution. Evaluate pricing, integration depth, and data governance features for RevOps and marketing teams.
-
 Analytics
10 Thunderhead Competitors for Customer Engagement in 2026
Compare top Thunderhead alternatives. Evaluate customer engagement platforms by real-time orchestration, data integration, and scale. Find the right fit for your marketing ops team.
-
 Big Data
StarfishETL Main Competitors in 2026: 10 ETL Tools for Marketing Teams
Compare StarfishETL with 10 leading ETL platforms. Real-world pricing, connector depth, and marketing analytics fit — from Fivetran to Improvado.
-
 MarTech
Best Highcharts Alternatives for Marketing Data Visualization in 2026
Discover the top Highcharts alternatives for marketing data visualization. Compare features, pricing, and integrations to find the right charting library for your team.
-
 MarTech
Cloud Elements Competitors: 7 Integration Platforms for Marketing Teams in 2026
Compare Cloud Elements alternatives for marketing data integration. Explore 7 platforms—MuleSoft, Workato, Improvado, Boomi—with pricing, connectors, and use cases.
-
 MarTech
10 Best Panoply Alternatives for Marketing Data Teams in 2026
Compare 10 Panoply alternatives for marketing data integration. Find the right ETL solution for your stack with pricing, connectors, and setup requirements.
-
 MarTech
11 Best Hevo Data Alternatives for Marketing Data Integration in 2026
Compare 11 Hevo Data alternatives for marketing data integration. Find the right ETL platform for your data volume, connector needs, and budget in 2026.
-
 MarTech
Top 10 Zoomdata Alternatives for Marketing & BI Analytics in 2026
Compare the best Zoomdata alternatives for marketing analytics. Evaluate platforms built for BI teams managing cross-channel campaign data in 2026.
-
 MarTech
11 Best Wolfram Alpha Alternatives for Data Analysis in 2026
Compare 11 Wolfram Alpha alternatives for data analysis, computational modeling, and marketing analytics. Find the right tool for your workflow with full feature comparisons.
-
 MarTech
10 Best Windsor.ai Alternatives for Marketing Data Integration in 2026
Compare the best Windsor.ai alternatives for marketing data integration. See how platforms like Improvado, Funnel.io, and Coupler.io stack up on pricing, connectors, and support.
-
 Performance
8 Best Wicked Reports Alternatives for Marketing Attribution in 2026
Compare the top Wicked Reports alternatives for marketing attribution tracking. Evaluate multi-touch attribution, data governance, and ROI reporting platforms.
-
 MarTech
11 Best Visme Alternatives for Marketing Teams in 2026
Discover 11 powerful Visme alternatives for creating presentations, infographics, and data visualizations. Compare features, pricing, and see which tool fits your workflow.
-
 Analytics
10 Best Treasure Data Competitors for Marketing Analytics in 2026
Compare the top 10 Treasure Data competitors for marketing analytics. Find the best CDP and data integration platform for your team's needs in 2026.
-
 MarTech
Top 7 TIBCO Software Competitors for Marketing & Data Integration in 2026
Compare the top TIBCO alternatives for marketing data integration. Explore platforms built for marketing teams—pre-built connectors, no-code interfaces, and real-time analytics.
-
 MarTech
Best Tellius Competitors and Alternatives in 2026: Comprehensive Guide
Compare the top Tellius alternatives for marketing analytics. Find the right platform for automated insights, data governance, and cross-channel reporting.
- MarTech
Top 10 Tagove Competitors for Marketing Data Automation in 2026
Compare the top Tagove alternatives for marketing data automation. Discover platforms that connect 500+ sources, automate reporting, and deliver real-time insights.
-
 MarTech
Top 9 Socialbakers Alternatives for Enterprise Social Media Analytics in 2026
Compare the top Socialbakers alternatives for enterprise teams. Explore platforms that centralize social analytics, unify cross-channel data, and scale with your reporting needs.
-
 Analytics
7 Best Snowplow Competitors for Event Analytics in 2026
Compare Snowplow alternatives for event tracking and behavioral analytics. Find the right platform for your data engineering and marketing ops stack in 2026.
-
 MarTech
9 Best Skyvia Alternatives for B2B Data Integration in 2026
Compare the top Skyvia alternatives for B2B marketing and sales data integration. Find the right ETL platform for your team's scale, budget, and technical needs.
-
 MarTech
Top 7 Skedler Competitors for Automated Reporting in 2026
Compare the best Skedler alternatives for automated reporting and analytics. Explore features, pricing, and limitations to find the right solution for your team.
-
 MarTech
13 Best Sigma Alternatives for Marketing Analytics Teams in 2026
Compare the 13 best Sigma alternatives for marketing teams. Evaluate pricing, data integration, and governance features to find the right analytics platform.
-
 Analytics
8 Best Sendoso Competitors for Direct Mail & Gifting in 2026
Compare top Sendoso alternatives: pricing, integrations, and fulfillment. Find the best direct mail and gifting platform for your ABM and outbound strategy.
-
 Performance
10 Best SegMetrics Alternatives for Multi-Touch Attribution in 2026
Compare the top SegMetrics alternatives for marketing attribution and customer journey tracking. Find the platform that fits your team's budget, technical needs, and reporting complexity.
-
 MarTech
Top SaasOptics Competitors & Alternatives for Revenue Teams in 2026
Compare top SaasOptics competitors: Stripe Billing, Chargebee, Recurly, Maxio, and Ordway. Find the best revenue automation tool for your SaaS finance stack.
-
 MarTech
Best RudderStack Competitors & Alternatives for Marketing Data in 2026
Compare the top RudderStack competitors for marketing data integration in 2026. Evaluate Improvado, Segment, Hightouch, and 8 more platforms by connector depth, transformation ease, and enterprise readiness.
-
 MarTech
9 Best Rivery Competitors and Alternatives for Data Engineering Teams in 2026
Compare the top Rivery competitors for enterprise data pipelines. Evaluate Fivetran, Airbyte, Improvado, and 6 more alternatives—connectors, pricing, and use cases.
-
 MarTech
11 Best Report Garden Alternatives for Marketing Agencies in 2026
Report Garden alternatives that scale beyond basic client reporting. Compare 11 platforms for multi-source data integration, white-label dashboards, and automated analysis.
-
 MarTech
9 Best Redash Alternatives for Marketing Data Analytics in 2026
Compare the top Redash alternatives for marketing analytics. Find tools built for multi-channel campaign tracking, real-time dashboards, and seamless data integration.
-
 Analytics
Top 10 Pyramid Analytics Competitors for Marketing & BI Teams in 2026
Compare the top Pyramid Analytics competitors for marketing and BI teams. Pricing, integrations, AI features, and hands-on insights to help you choose the right platform.
-
 MarTech
13 Best Proton Alternatives for Marketing Data Management in 2026
Compare 13 Proton alternatives for marketing data management. Find tools that centralize campaigns, automate reporting, and eliminate data silos across your stack.
-
 MarTech
Proton.ai Alternatives for Marketing Data Teams (2026)
Compare Proton.ai alternatives for marketing data teams. Find platforms with better connector coverage, faster implementation, and advanced governance features.
-
 MarTech
10 Best Pentaho Alternatives for Marketing Data Integration in 2026
Compare the top Pentaho alternatives for marketing data integration. Find ETL tools built for modern marketing teams that need speed, scale, and zero engineering overhead.
-
 MarTech
7 Best Open Source Segment Alternatives for Marketing Data Pipelines in 2026
Compare 7 open source Segment alternatives for marketing data pipelines. See RudderStack, Jitsu, Snowplow, and more—plus when enterprise tools work better.
-
 MarTech
10 Best Octoboard Alternatives for Marketing Reporting in 2026
Looking for an Octoboard alternative? Compare 10 marketing reporting platforms built for agencies and analysts managing multi-channel campaigns at scale.
-
 MarTech
9 Best Nuix Workstation Alternatives for eDiscovery & Compliance in 2026
Compare the top Nuix Workstation alternatives for eDiscovery, compliance, and data investigation. Find the right platform for your team's requirements and budget.
-
 Analytics
mParticle Competitors: 9 Best Customer Data Platforms for 2026
Compare the top 9 mParticle alternatives for marketing teams. Real-world trade-offs, pricing insights, and feature breakdowns to find the right CDP for your stack.
-
 MarTech
Top MediaRadar Alternatives in 2026: 9 Best Tools for Ad Intelligence
Compare the top 9 MediaRadar alternatives for ad intelligence and competitive media monitoring. Find the best solution for your media planning and analysis needs.
-
 MarTech
11 Best Matillion Competitors & Alternatives for Data Teams in 2026
Compare Matillion alternatives for ETL, ELT, and reverse ETL. Fivetran, Airbyte, Improvado, and 8 more tools reviewed for data engineers and marketing ops teams.
-
 MarTech
8 Best MarketSmith Alternatives for Marketing Teams in 2026
MarketSmith costs $1,499/year and lacks marketing data connectors. Discover 8 alternatives built for marketing teams—compare features, pricing, and integrations.
-
 MarTech
9 Best MarketSight Alternatives for Market Research Teams in 2026
Compare the top MarketSight alternatives for 2026. Find the right market research and analytics platform for your team—with detailed feature comparisons and pricing.
-
 MarTech
12 Best Looker Studio Alternatives for Marketing Teams in 2026
Explore 12 powerful Looker Studio alternatives for marketing analytics. Compare features, pricing, and data connector support to find the right fit for your team.
-
 MarTech
12 Best Lavender AI Alternatives for Sales Teams in 2026
Compare top Lavender AI alternatives for SDRs and sales teams. Find AI sales assistants that integrate with your stack, automate personalization, and close deals faster.
-
 MarTech
7 KeyLines Alternatives for Network Graph Visualization in 2026
Compare KeyLines alternatives for marketing analytics. Explore tools for network visualization, data integration, and real-time insights — with pros, cons, pricing.
-
 MarTech
7 Best Integromat Alternatives for Marketing Automation in 2026
Compare the best Integromat alternatives for marketing automation. See which platforms handle complex data workflows, enterprise integrations, and scalability.
-
 MarTech
10 Best iDashboards Alternatives for Marketing Analytics in 2026
Compare the top iDashboards alternatives for marketing analytics. Find the right BI and dashboard platform for your team — from Power BI to Improvado.
-
 MarTech
8 Best HIPAA-Compliant Zapier Alternatives for Healthcare Marketing in 2026
Compare HIPAA-compliant automation platforms for healthcare marketing teams. Discover 8 Zapier alternatives with BAA support, PHI handling, and enterprise security.
-
 MarTech
7 Best GroSocial Competitors and Alternatives for Social Media Management in 2026
Compare the top GroSocial competitors for social media management. See pricing, features, and which platforms fit agencies, enterprises, and marketing teams.
-
 MarTech
GoodData Competitors: Top 7 Embedded Analytics Platforms for 2026
Compare the best GoodData alternatives for embedded analytics. Explore pricing, scalability, and customer-facing dashboard capabilities to find your fit.
-
 MarTech
9 Best Flourish Data Visualization Alternatives for Marketing Teams (2026)
Compare the top 9 Flourish alternatives for marketing data visualization. Find tools that connect directly to your ad platforms, automate data prep, and scale with your team.
-
 Big Data
Best Flatfile Competitors for Data Ingestion in 2026
Compare the top Flatfile alternatives for marketing data ingestion. Get pre-built connectors, automated validation, and enterprise-grade governance.
-
 MarTech
9 Best Engagio Alternatives for Account-Based Marketing in 2026
Engagio is now part of Demandbase. Explore 9 proven account-based marketing platforms that help operations teams orchestrate, measure, and scale ABM programs.
-
 Analytics
11 Best Dynata Competitors for Market Research in 2026
Explore 11 Dynata competitors offering advanced survey tools, sample panels, and automation. Compare features, pricing, and use cases to find the right fit.
-
 MarTech
9 Best DreamFactory Alternatives for Modern Marketing Data Integration in 2026
Compare the best DreamFactory alternatives for marketing data integration. Evaluate API platforms, reverse ETL tools, and purpose-built solutions for marketing analytics.
-
 Performance
9 Best Dreamdata Alternatives for B2B Revenue Attribution in 2026
Compare top Dreamdata alternatives for B2B revenue attribution. Find platforms that unify multi-touch tracking, CRM sync, and marketing data—without the integration overhead.
-
 MarTech
Digital Element Alternatives: 7 Best IP Intelligence Tools for 2026
Compare the top 7 Digital Element alternatives for IP geolocation, fraud detection, and marketing personalization. See pricing, features, and ideal use cases.
-
 MarTech
Top 11 DataXu Alternatives for Programmatic Advertising in 2026
DataXu is now Roku OneView — but are you getting the control you need? Compare 11 programmatic ad platforms built for omnichannel campaigns and real attribution.
-
 MarTech
12 Best Datawrapper Alternatives for Marketing Analytics in 2026
Compare the best Datawrapper alternatives for marketing analytics. Find tools that handle multi-source data, automated reporting, and real-time dashboards.
-
 MarTech
Top 8 Dataslayer Alternatives for Marketing Data Automation in 2026
Compare the best Dataslayer alternatives for marketing data integration. Find platforms that scale with your reporting needs and eliminate manual data pulls.
-
 MarTech
DataSift Alternatives: 8 Best Social Media Data Platforms for Marketing Teams (2026)
DataSift shut down in 2023. Discover 8 proven alternatives for social media data analysis, real-time streaming, and multi-platform marketing intelligence.
-
 MarTech
8 Best DataPine Alternatives for Marketing Analytics in 2026
Compare the best DataPine alternatives for marketing teams. Explore platforms with pre-built connectors, AI analytics, and automated reporting. Find your fit.
-
 MarTech
8 Best DataMC Alternatives for Marketing Analytics in 2026
Marketing Operations Managers and Data Engineers compare 8 DataMC alternatives. Real technical specs, pricing, and integration depth for multi-channel reporting.
-
 Performance
10 Best Datalogix Alternatives for Audience Data & Attribution in 2026
Datalogix is gone. Compare 10 audience data and attribution platforms in 2026—MediaMath, Salesforce Data 360, LiveRamp, and more. See which fits your stack.
-
 MarTech
7 Best Dataddo Alternatives for Marketing Data Integration in 2026
Compare 7 proven Dataddo alternatives for marketing data integration. Real differences in connectors, transformation, pricing, and enterprise support.
-
 Analytics
Top Databook Competitors in 2026: Best Account Intelligence Platforms for Sales Teams
Compare the top Databook competitors for 2026. Find the best account intelligence and B2B sales enablement platforms for RevOps teams.
-
 MarTech
7 Best Data.ai Alternatives for Mobile Marketing Analytics in 2026
Compare 7 Data.ai alternatives for mobile marketing analytics. Find platforms that offer better pricing, deeper ad spend visibility, and unified cross-channel reporting.
-
 MarTech
9 Best Crossbeam Competitors & Alternatives for Partnership Teams in 2026
Compare the top Crossbeam alternatives for partner ecosystem mapping. Find the best partner data platform for your RevOps team — with features, pricing, and proven use cases.
-
 MarTech
Top 8 CloudBolt Alternatives for Cloud Management and Orchestration in 2026
Compare the top CloudBolt alternatives for multi-cloud orchestration, cost management, and automation. Find the right platform for your infrastructure needs.
-
 MarTech
10 Best Chartio Alternatives for Marketing Analytics in 2026
Chartio shut down in 2022. Compare 10 proven alternatives for marketing analytics—from no-code BI tools to enterprise data platforms. Find the right fit.
-
 Performance
9 Bizible Competitors for B2B Marketing Attribution in 2026
Marketing teams are switching from Bizible to modern alternatives. Compare 9 leading attribution platforms—features, limitations, and pricing for B2B attribution.
-
 Big Data
BigQuery Competitors: 8 Best Alternatives for Data Engineers in 2026
Compare BigQuery alternatives for marketing data. Snowflake, Redshift, Databricks, and specialized solutions. Real-world benchmarks, pricing, and integration depth.
-
 MarTech
Top 7 Attivio Competitors for Enterprise Search & Analytics in 2026
Compare top Attivio alternatives: Coveo, Sinequa, Algolia, and more. See feature-by-feature analysis, pricing insights, and how to choose the right enterprise search platform.
-
 MarTech
10 Best APSIS Pro Alternatives for Email Marketing in 2026
Compare top APSIS Pro alternatives for email marketing automation in 2026. Features, pricing, and real-world use cases to help you choose the right platform.
-
 MarTech
10 Best Apache NiFi Alternatives for Marketing Data Pipelines in 2026
Apache NiFi powers enterprise data flows—but marketing teams need connectors, not code. Explore 10 alternatives built for campaign data, analytics APIs, and speed.
-
 MarTech
Apache NiFi Alternatives Open Source: 8 Best Tools for Data Engineers in 2026
Compare 8 open-source Apache NiFi alternatives for data engineers. Feature-by-feature breakdown of Airbyte, Singer, Meltano, and more—plus what marketing teams actually need.
-
 Performance
Analytic Partners Competitors: Top 7 MMM Platforms for 2026
Compare Analytic Partners with 7 leading marketing mix modeling platforms. Evaluate features, pricing, and use cases to find the right MMM solution for your team.
-
 Analytics
Amplifinity Competitors: 9 Best Referral Marketing Platforms for 2026
Evaluate the top Amplifinity alternatives for referral and partner marketing. Compare features, integrations, and pricing to find the right platform for your team.
-
 MarTech
7 Best Integrate.io Alternatives for Marketing Data Teams in 2026
Compare 7 Integrate.io alternatives built for marketing data teams. See pricing, data connectors, transformation capabilities, and when each tool fits best.
-
 MarTech
Top 7 Alternatives to Google Tag Manager for Marketing Teams in 2026
Compare the top 7 alternatives to Google Tag Manager for enterprise marketing teams. Find the right tag management solution for your tracking needs in 2026.
-
 MarTech
Oviond Alternative: 7 Agency Reporting Tools for Marketing Teams (2026)
Looking for an Oviond alternative? Compare 7 agency reporting platforms built for marketing teams managing multi-client data. Find the right fit for your workflow.
-
 Analytics
Alight Competitors: 7 Best Workforce & Benefits Data Platforms for 2026
Compare the top Alight competitors for HR analytics, benefits administration, and workforce data integration. Find the right platform for your needs.
-
 MarTech
10 Best Alight Alternatives for HR Data & Analytics in 2026
Compare the top Alight alternatives for HR data integration and analytics. Find platforms that centralize HRIS, payroll, and workforce data for smarter decision-making.
-
 MarTech
Best Algolytics Alternatives for Marketing Analytics in 2026
Compare top Algolytics alternatives for marketing analytics. Find platforms with better connectors, governance, and AI-powered insights—built for enterprise teams.
-
 Analytics
AdStage Competitors: 9 Best PPC Management Platforms for 2026
AdStage is shutting down. Compare the 9 best AdStage alternatives for PPC management, cross-channel reporting, and marketing data consolidation in 2026.
-
 Analytics
ActionIQ Competitors: 7 Best CDPs & Marketing Data Platforms for 2026
Compare the best ActionIQ alternatives for 2026. Evaluate CDPs and marketing data platforms by data scale, orchestration features, and enterprise requirements.
-
 MarTech
Top 8 ThoughtSpot Competitors for Marketing Teams in 2026
Compare the top ThoughtSpot alternatives for marketing analytics. Honest review of pricing, setup complexity, and marketing-specific features teams actually need.
-
 MarTech
10 Tealium Competitors for Marketing Data in 2026: A Complete Review
Compare top Tealium alternatives for marketing data integration. Evaluate pricing, connector libraries, and data governance features to find the best fit.
-
 MarTech
Top 11 Talend Alternatives for Modern Data Integration in 2026
Explore 11 Talend alternatives for data engineers and marketing ops teams. Compare pricing, capabilities, and deployment models to find the right ETL/ELT solution.
-
 MarTech
15 Best Stitch Alternatives for Marketing Data Integration in 2026
Compare 15 Stitch alternatives for marketing data integration. Find the right ETL platform for ad spend tracking, attribution, and multi-channel reporting.
-
 MarTech
8 Best Sisense Competitors and Alternatives for Marketing Analytics in 2026
Compare the top Sisense alternatives for marketing analytics. Evaluate Power BI, Tableau, Improvado, and 5 more platforms based on pricing, data connectivity, and ease of use.
-
 MarTech
10 Best Informatica Alternatives for Data Engineers in 2026
Compare top Informatica alternatives for marketing and enterprise data integration. Cloud-native platforms built for speed, cost-efficiency, and real-time analytics.
-
 MarTech
10 Best Google Data Studio Alternatives for Marketing Teams in 2026
Looker Studio limits costing you time? Compare the 10 best Google Data Studio alternatives for marketing teams. Real benchmarks, integration counts, and pricing.
-
 MarTech
10 Best Geckoboard Alternatives for Marketing Analytics Teams in 2026
Compare the top 10 Geckoboard alternatives for marketing teams. See features, pricing, and data integration capabilities to find the right dashboard tool.
-
 MarTech
10 Top Denodo Competitors & Alternatives for Data Virtualization in 2026
Compare the top 10 Denodo alternatives for data virtualization, integration, and analytics. See pricing, features, and which platform fits your data engineering stack.
-
 MarTech
Dell Boomi Competitors: 9 Best Alternatives for Marketing Data in 2026
Compare Dell Boomi with 9 proven alternatives for marketing data integration. See which iPaaS platforms deliver faster deployment, better support, and lower TCO.
-
 MarTech
10 Best Dataiku Competitors & Alternatives for Marketing Teams in 2026
Compare the top 10 Dataiku competitors for marketing analytics. Evaluate pricing, ease of use, and integration options to find the right data platform for your team.
-
 MarTech
Top 10 DashThis Alternatives & Competitors for Marketing Reporting in 2026
Compare the 10 best DashThis alternatives for marketing reporting. Find tools that scale with your data volume, support custom transformations, and eliminate manual work.
-
 MarTech
Top 7 Amperity Competitors and Alternatives for Customer Data Management in 2026
Compare the top Amperity alternatives for customer data platforms. Evaluate features, pricing, and implementation complexity to find the best CDP for your team.
-
 MarTech
Top 10 Tray.io Alternatives for Marketing Data Integration in 2026
Compare the top Tray.io alternatives for marketing data integration. Find the right platform for your stack—connectors, pricing, and real-world limitations included.
-
 MarTech
10 Best Looker Alternatives for Marketing Analytics in 2026
Looker alternatives that connect natively to marketing data sources. Compare pricing, ETL capabilities, and marketing-specific features for BI tools built for performance teams.
-
 MarTech
10 Best Grafana Alternatives for Marketing Analytics in 2026
Grafana can't connect to marketing platforms natively. Explore 10 alternatives built for marketing teams—from no-code tools to enterprise platforms.
-
 MarTech
Workato Competitors: 9 Best Alternatives to Compare in 2026
Compare top Workato alternatives for marketing automation. See pricing, features, and ROI for teams managing cross-platform workflows and attribution pipelines.
- MarTech
10 Best Tableau Alternatives for Marketing Analytics in 2026
Explore the best Tableau alternatives for marketing teams. Compare features, pricing, and data integration capabilities to find the right BI tool for your needs.
-
 Performance
Campaign Monitoring and Anomaly Detection: Complete Guide for 2025
Learn how to set up campaign monitoring systems that catch budget overruns, performance drops, and data issues before they cost you thousands. Step-by-step implementation guide.
-
 Analytics
OpenClaw Marketing Use Cases: 7 Ways to Automate Marketing Workflows (2026)
Discover 7 practical OpenClaw marketing use cases: automated reporting, lead enrichment, data validation, and more. Plus cost breakdowns and integration tips.
-
 Analytics
White Label Marketing Reports: Complete Guide for Agencies (2026)
Build scalable white label marketing reports that impress clients and save 38+ hours per week. Templates, automation strategy, and tools compared.
-
 MarTech
Agency Reporting Automation: 11 Best Tools & Platforms (2026 Buyers Guide)
Compare 11 agency reporting automation platforms built for multi-client workflows. Evaluation framework, pricing, and feature comparison for marketing analysts.
-
 Analytics
OpenClaw for Marketing: What It Is and How It Works in 2026
OpenClaw reached over 224,000 GitHub stars—but what does it mean for marketing teams? Learn how this open-source tool fits into modern analytics workflows.
-
 Performance
12 Best Multi-Touch Attribution Solutions for Marketing Analysts (2026)
Compare 12 multi-touch attribution platforms by transparency, model flexibility, and implementation complexity. See which solution fits your stack and conversion volume.
-
 MarTech
QA Automation for Marketing Workflows: A Complete Guide for 2027
Learn how to implement QA automation for marketing workflows. Reduce errors, save 38+ hours/week, and ensure campaign quality at scale with proven frameworks.
-
 Big Data
12 Best ETL Tools for Databricks in 2025: A Marketing Analyst's Guide
Compare 12 ETL tools for Databricks built for marketing analytics. Reviews cover connector libraries, transformation logic, and analyst-friendly UIs.
-
 Big Data
12 Best ETL Tools for Redshift in 2026 — Ranked by Marketing Teams
Compare the top 12 ETL tools for Redshift based on connector coverage, transformation logic, and marketing-specific features. Find the right fit for your stack.
-
 Big Data
7 Best ETL Tools for HubSpot to Redshift Migration in 2026
Compare the top ETL tools for syncing HubSpot data to Amazon Redshift. Features, pricing, and setup complexity — find the right solution for your team.
-
 Analytics
11 Best Marketing Mix Modeling Providers for 2026: Tools, Pricing & Selection Framework
Compare 11 marketing mix modeling platforms for 2026. Decision framework, hidden costs, failure cases, and vendor lock-in audit for data teams.
-
 Big Data
7 Best ETL Tools for Snowflake in 2026: Marketing Analyst's Guide
Compare the 7 best ETL tools for Snowflake optimized for marketing data. See how Improvado, Fivetran, and 5 alternatives handle 500+ sources, real-time sync, and transformation at scale.
-
 Big Data
12 Best Reverse ETL Tools for 2026: Features, Pricing & Use Cases
Compare the best reverse ETL tools for marketing teams in 2026. Real pricing, integration depth, and use cases for Hightouch, Census, Fivetran, and more.
-
 Analytics
How to Monitor Marketing Campaigns: A Complete Guide for Analysts (2026)
Learn how to monitor marketing campaigns across channels, track performance in real time, and turn fragmented data into actionable insights analysts can trust.
-
 Analytics
12 Best Marketing Agency Software Platforms for 2026
Compare the top 12 marketing agency software platforms for 2026. Expert analysis of features, pricing, integrations, and which tools match your agency needs.
-
 Analytics
7 Best Marketing Compliance Monitoring Software Solutions for 2026
Compare the 7 best marketing compliance monitoring software platforms that automate regulatory checks, enforce campaign standards, and keep marketing teams audit-ready.
-
 Analytics
Marketing Mix Modeling: Complete Guide for Marketing Analysts (2026)
Master marketing mix modeling: statistical methods, implementation frameworks, and practical workflows for analysts optimizing multi-channel budgets in 2026.
-
 Analytics
12 Best Data Transformation Solutions for Marketing Teams in 2026
Compare 12 data transformation solutions built for marketing teams. Evaluation criteria, pricing, and real-world use cases to find the right fit for your stack.
-
 Analytics
Skai vs Improvado: Which Platform Fits Enterprise Marketing Teams? (2026)
Skai optimizes retail media campaigns. Improvado builds end-to-end marketing intelligence pipelines. Here's the full breakdown — features, governance, pricing, and when each platform wins.
-
 Analytics
Triple Whale vs Improvado: Which Marketing Data Platform Is Right for Enterprise Teams? (2026)
Triple Whale serves DTC ecommerce. Improvado serves enterprise marketing across all channels. Here's the feature breakdown, pricing comparison, and when each platform wins.
-
 Analytics
Windsor.ai vs Improvado: Choosing the Right Marketing Data Platform (2026)
Windsor.ai handles simple extractions. Improvado delivers the full pipeline—extraction, transformation, governance, and insights—in one platform built for enterprise marketing.
-
 Analytics
UTM.io vs Improvado: Choosing the Right Marketing Data Governance Platform (2026)
UTM.io manages campaign parameters. Improvado governs entire marketing data pipelines. Here's what that difference means for your team — with feature breakdown, pricing comparison, and real customer results.
-
 Analytics
dbt Labs vs Improvado: Which Is Right for Enterprise Marketing Teams? (2026)
dbt excels at SQL-based transformations. Improvado delivers the full marketing data pipeline. Here's what that difference means for your team — with feature breakdowns, pricing, and real customer outcomes.
-
 Analytics
Improvado vs Databricks: Choosing the Right Data Platform for Marketing Teams (2026)
Databricks builds data infrastructure. Improvado solves marketing data. Here's what that difference means for your team — with feature comparison, pricing, and real customer outcomes.
-
 Analytics
Claravine vs Improvado: Which Platform Is Right for Enterprise Marketing Teams? (2026)
Claravine validates metadata. Improvado extracts, transforms, governs, and delivers insights. Here's the full feature breakdown, pricing comparison, and when each platform wins.
-
 Analytics
Tableau AI (Einstein) vs Improvado: Which Platform for Enterprise Marketing Analytics? (2026)
Tableau AI excels at visual analytics across all data. Improvado specializes in marketing data pipelines with built-in governance. See which fits your team's workflow.
-
 Analytics
Funnel.io vs Improvado: Which Platform Handles Enterprise Marketing Data Best? (2026)
Funnel.io aggregates and exports. Improvado transforms, governs, and delivers insights. Here's what that difference means for your marketing team - with an honest breakdown of when each platform wins, pricing, and the friction points marketing teams actually hit.
-
 Analytics
Tableau vs Improvado: Which Is Right for Enterprise Marketing Teams? (2026)
Tableau visualizes. Improvado transforms, governs, and delivers. Here's what that difference means for your marketing stack - with feature breakdown, pricing, and real customer examples.
-
 Analytics
Fivetran vs Improvado: Which Marketing Data Platform Is Right for Your Team? (2026)
Fivetran delivers broad ELT automation. Improvado adds marketing-specific transformation, governance, and insights. Here's the full breakdown with pricing, features, and real customer examples.
-
 Analytics
DashThis vs Improvado: Which Marketing Reporting Platform Is Right for Agencies? (2026)
DashThis builds beautiful client dashboards fast. Improvado handles the entire data pipeline with governance and real-time insights. Here's how to choose.
-
 Analytics
Airbyte vs Improvado: Choosing the Right Marketing Data Platform (2026)
Airbyte extracts and loads. Improvado extracts, transforms, governs, and delivers insights. Here's what that difference means for your marketing team.
-
 Analytics
Improvado vs Domo AI: Which AI-Powered Marketing Analytics Platform Fits Your Needs? (2026)
Domo AI offers enterprise BI across all departments. Improvado specializes in marketing analytics with 1,000+ connectors, AI-powered transformations, and governance. Compare features, pricing, and use cases.
-
 Analytics
Matillion vs Improvado: Which Platform Fits Enterprise Marketing Teams? (2026)
Matillion handles broad data engineering. Improvado owns the marketing data lifecycle. Here's the feature breakdown, pricing comparison, and when each platform wins.
-
 Analytics
ThoughtSpot vs Improvado: Choosing the Right AI Analytics Platform (2026)
ThoughtSpot offers search-driven BI. Improvado delivers end-to-end marketing analytics with ETL, governance, and AI agents. See which fits your team's workflow.
-
 Analytics
Marketing Cloud Intelligence (Datorama) vs Improvado: Choosing the Right Marketing Analytics Platform (2026)
Marketing Cloud Intelligence (Datorama) is Salesforce's marketing analytics layer. Improvado is a marketing data platform with governance built in. Here's the honest comparison - including where Datorama's Salesforce depth genuinely wins.
-
 Analytics
Sigma Computing vs Improvado: Choosing the Right Marketing Analytics Platform (2026)
Sigma Computing explores warehouse data. Improvado extracts, transforms, and governs marketing pipelines. Here's what that difference means for your team — with feature comparison, pricing, and customer examples.
-
 Analytics
Supermetrics vs Improvado: Choosing the Right Marketing ETL (2026)
Supermetrics extracts data into your sheets and dashboards. Improvado normalizes, governs, and delivers it first. The honest 2026 breakdown - verified pricing, connectors, and where each platform actually wins.
-
 Analytics
Improvado vs Databox: Which Marketing Analytics Platform Is Right for You? (2026)
Databox offers quick dashboard deployment. Improvado delivers enterprise-grade data transformation and governance. Here's the complete breakdown with pricing, features, and when each tool wins.
-
 Analytics
Whatagraph vs Improvado: Which Is Right for Marketing Teams Managing Multiple Clients? (2026)
Whatagraph builds client dashboards. Improvado builds the entire data pipeline. Here's what that difference means for your team—with pricing, features, and real customer outcomes.
-
 Analytics
Power BI vs Improvado: Which Marketing Data Platform Fits Your Team? (2026)
Power BI visualizes. Improvado extracts, transforms, governs, and delivers marketing insights. Here's the full feature breakdown, pricing comparison, and when each tool wins.
-
 Analytics
Improvado vs Tellius: Which AI Analytics Platform Is Right for Enterprise Marketing Teams? (2026)
Tellius delivers conversational AI analytics across enterprise data. Improvado transforms marketing data into governed insights. Here's the full breakdown with pricing, features, and real customer examples.
-
 Analytics
Northbeam vs Improvado: Which Is Right for Enterprise Marketing Teams? (2026)
Northbeam measures which channels drive revenue. Improvado centralizes, transforms, and governs all your marketing data. Here's the difference — with feature comparison, pricing, and real customer examples.
-
 Analytics
Mode Analytics vs Improvado: Which Marketing Analytics Platform Fits Your Team? (2026)
Mode Analytics is built for SQL-savvy analysts. Improvado is built for marketing teams. Here's how to choose—with feature breakdowns, pricing, and real customer outcomes.
-
 Analytics
Monte Carlo Data vs Improvado: Which Fits Enterprise Marketing Teams? (2026)
Monte Carlo monitors data pipelines. Improvado builds marketing pipelines. Here's the difference — with feature breakdowns, pricing, and real customer outcomes.
-
 Analytics
NinjaCat vs Improvado: Which Marketing Performance Platform Is Right for Your Agency? (2026)
NinjaCat automates client reports. Improvado transforms data at scale. Here's what that difference means for agencies managing 20+ clients — with feature breakdowns, pricing, and real user insights.
-
 Analytics
TapClicks vs Improvado: Which Is Right for Enterprise Marketing Teams? (2026)
TapClicks reports on your data. Improvado extracts, transforms, governs, and routes it. Here's what that architectural difference means for your marketing ops team.
-
 Analytics
Stitch Data vs Improvado: Which Is Right for Enterprise Marketing Teams? (2026)
Stitch Data moves your data. Improvado transforms it for marketing decisions. Here's the full feature breakdown, pricing comparison, and real customer outcomes.
-
 Analytics
Marin Software vs Improvado: Choosing the Right Marketing Data Platform (2026)
Marin Software optimizes ad campaigns. Improvado unifies marketing data across the entire stack. Here's the breakdown—features, pricing, and when each wins.
-
 Analytics
Measured vs Improvado: Which Marketing Analytics Platform Fits Your Stack? (2026)
Measured delivers media mix modeling. Improvado builds the full pipeline — extraction, transformation, governance, and insights. Here's what that difference means for your team.
-
 Analytics
Rockerbox vs Improvado: Which Is Right for Enterprise Marketing Teams? (2026)
Rockerbox specializes in attribution modeling. Improvado builds the entire data infrastructure. Here's what that difference means for your marketing team.
-
 Analytics
Integrate.io vs Improvado: Which Marketing Data Platform Is Right for Enterprise Teams? (2026)
Integrate.io offers low-code ETL with predictable pricing. Improvado delivers end-to-end marketing intelligence with governance. Here's how to choose between them.
-
 Analytics
Looker vs Improvado: Which Is Right for Enterprise Marketing Teams? (2026)
Looker and Looker Studio aren't the same product, and neither replaces a marketing data pipeline. Here's the real architecture difference, honest pricing, and when each tool actually wins.
-
 Analytics
Improvado vs Madgicx: Which Marketing Data Platform Fits Enterprise Teams? (2026)
Madgicx automates Meta ads. Improvado unifies data from 1,000+ sources. Here's the breakdown — feature comparison, pricing, and when each platform wins.
-
 Analytics
Fivetran + dbt vs Improvado: Choosing the Right Marketing Data Platform (2026)
Fivetran + dbt handles general ELT. Improvado delivers marketing-specific pipelines with built-in governance. Here's how to choose — with feature breakdowns, pricing, and real customer outcomes.
-
 Analytics
Great Expectations vs Improvado: Choosing the Right Data Quality Solution (2026)
Great Expectations validates data in pipelines. Improvado validates, transforms, and delivers marketing insights — all in one platform. Here's the full breakdown.
-
 Analytics
Hevo Data vs Improvado: Which Handles Enterprise Marketing Analytics? (2026)
Hevo Data moves database records. Improvado transforms marketing campaigns. Here's what that difference means for your analytics team — with feature breakdown, pricing comparison, and customer examples.
-
 Analytics
Albert.ai vs Improvado: Which Platform Fits Enterprise Marketing Teams? (2026)
Albert.ai optimizes ad campaigns autonomously. Improvado unifies, transforms, and governs marketing data across 1,000+ sources. Here's how they differ—and when each wins.
-
 Analytics
Airbyte + dbt vs Improvado: Which Is Right for Enterprise Marketing Teams? (2026)
Airbyte + dbt covers ELT infrastructure. Improvado delivers marketing-specific transformation, governance, and insights—in one platform. See the difference.
-
 Analytics
AgencyAnalytics vs Improvado: Which Handles Multi-Client Marketing Data at Scale? (2026)
AgencyAnalytics automates client reports. Improvado builds governed data pipelines. Here's what that difference means for agencies managing 50+ clients.
-
 Analytics
AgencyAnalytics AI vs Improvado: Choosing the Right Marketing Analytics Platform (2026)
AgencyAnalytics AI automates client reporting. Improvado transforms raw data into strategic insights. Here's what that difference means for your agency—feature breakdown, pricing, and real outcomes.
-
 Analytics
Improvado vs Adverity: Which Marketing Data Platform Fits Enterprise Teams? (2026)
Adverity ships 600+ connectors and a new AI-native governance layer called Atlas. Improvado unifies connectors, marketing-specific governance, and an AI agent in one platform - an honest, source-checked comparison of both.
-
 Performance
Multi-Touch Attribution Models, Tools, and Implementation Guide for 2026
Master multi-touch attribution: compare 7 models, calculate signal loss, avoid common failures, and select the right MTA tool for your stack.
-
 MarTech
Top IFTTT Alternatives for B2B Marketing & Data Teams in 2026
Discover the top IFTTT alternatives in 2026 for B2B marketing and data teams. Compare features, pricing, workflows, and scalability with expert insights, decision frameworks, and migration tips.
-
 MarTech
Raven Tools Alternative in 2026: How to Choose the Best Marketing Analytics Platform
Compare the best Raven Tools alternatives for 2026, including pricing and features, to find the right marketing analytics platform for your team.
-
 MarTech
UiPath Competitors in 2026: The Definitive Guide to Choosing the Best RPA Platform
Discover the leading UiPath competitors in 2026 with a detailed comparison, scoring rubric, migration guide, and expert insights. Learn how to choose the best robotic process automation platform for your organization and streamline your automation strategy.
-
 MarTech
Zapier Alternatives in 2026: The Definitive Guide for B2B Marketing & Data Professionals
Compare the best Zapier alternatives for 2026: Make, n8n, Workato, Power Automate and more, plus when a marketing data platform beats task automation.
-
 MarTech
Snowflake Competitors and Alternatives in 2026: A Complete Comparison
Compare BigQuery, Redshift, Databricks, Fabric, ClickHouse, Teradata, and Db2 vs Snowflake. Real migration costs, hidden tradeoffs, and workload-fit criter
-
 Editor's choice
Marketing Analytics Trends 2026: How AI Is Reshaping Dashboards, Reporting, and Decision-Making
Find out which marketing analytics trends matter most in 2026. From AI agents to data quality, learn how teams can adapt and stay competitive.
-
 MarTech
What Is Adobe Analytics? A Complete Guide for Marketers
Discover what Adobe Analytics is and how to use it. Explore key features like multi-channel data collection, predictive analytics, and reporting to measure marketing ROI and optimize your customer journey.
-

What is an Ad Intelligence Solution? And Why You Need One
Compare the best ad intelligence software and digital ad intelligence platforms to track competitor spend, creatives, and ad targeting in 2026.
-
 Big Data
Data Loading: A Complete Guide
Learn how data loading turns raw info into trusted analytics. Get practical tips and build high-performance pipelines with Improvado’s proven approach.
-
.png) Analytics
AnalyticsEnterprise Knowledge Graph: Architecture, Use Cases & Implementation Guide (2026)
Technical guide to enterprise knowledge graphs: RDF vs property graphs, implementation patterns, failure modes, and when EKG is the wrong choice.
-
 MarTech
Adverity Reviews: Strengths, Weaknesses & Pricing
Read in-depth Adverity reviews. Explore pricing, features, pros & cons, and comparisons with Supermetrics, Funnel.io, and more to see if it suits your needs.
-
 Big Data
Data Transformation: A Complete Guide
Get a practical Data Transformation guide covering data transformation process, types of data transformation, best practices and more.
-
 MarTech
Data Ingestion: A Guide to Reliable, Scalable Pipelines
Master data ingestion and the data ingestion process for marketing analytics: methods, pipelines, tools, and best practices to deliver trusted insights.
-
 Dashboards
Data Visualization: A Complete Guide for Marketers and Analysts
Everything you need to know about data visualization for marketing analytics, from chart choices and AI assistants to platform selection and governance.
-
 Analytics
Data Extraction: A Complete Guide for Marketing Analytics
Learn everything about data extraction for marketing analytics--methods, tools, benefits, and best practices. Discover how to build accurate, scalable pipelines with modern ETL/ELT workflows.
-
 Analytics
AI Marketing Agent: 11 Best Tools, Use Cases & Implementation Guide for 2026
Compare 11 AI marketing agents for analytics, ABM, and automation. Includes failure modes, TCO calculator, and 90-day implementation plan.
-
 Analytics
Healthcare Analytics Software: An In-Depth 2026 Guide to Top Tools
Compare the top healthcare analytics software and solutions of 2026 by features, HIPAA compliance, and pricing to improve clinical decisions.
-
 Analytics
Pharma Marketing Analytics: How Data Drives Pharma Success
Discover how pharmaceutical marketing data drives smarter campaigns, boosts ROI, and enhances patient engagement with proven strategies and tools.
-
 MarTech
Top 15 Databox Alternatives (2026) for Advanced Reporting
Discover the top databox competitors in 2026 offering advanced reporting, real-time analytics, and seamless integrations to boost your data insights.
-
%20(1).png) MarTech
MarTechCorporate AI Acceptable Use Policy: Template & Implementation Guidelines
Learn how to create a legal policy for LLM use in marketing analytics, from export control requirements to internal compliance frameworks, to ensure safe and compliant AI adoption

-
 MarTech
What Are the Best AI Analytics Platforms? | Benefits, Tool Comparison & Techniques
Compare the top AI analytics platforms and solutions, see key features, and learn how to choose the right one for real-time, data-driven decisions.
-
 Performance
How to Measure Walmart Connect Performance? Key Walmart Advertising Metrics
Learn how Walmart Connect metrics help measure ad effectiveness. Optimize your Walmart advertising strategy with key performance metrics for higher sales.
-
 Analytics
What Is the Role of ETL in Business Intelligence? Importance, Processes & Tools
Explore ETL in business intelligence, including essential ETL tools, processes for data integration and analysis, and the extract, transform, load methodology.
-
 MarTech
ETL vs. Data Integration: Comprehensive Comparison Guide
Explore key differences between ETL and data integration. Understand processes, tools, and use cases to choose the best approach for your data management.
-
 MarTech
Top 10 AI Reporting Tools in 2026: AI Report Generators & Automated Analytics
Compare 10 AI reporting tools for marketing analysts. Evaluation criteria, TCO breakdowns, readiness assessment, and implementation timelines.
-
 MarTech
Enterprise Data Platform: A Complete Guide for Business and IT Leaders
Discover how to build a winning data platform strategy that unifies your data, boosts integration, and drives smarter business decisions.
-
 MarTech
Top Enterprise Analytics Platforms for Unified, Data-Driven Strategy
Compare top enterprise analytics platforms and software, see key features and use cases, and learn how to pick the right solution for your data stack.
-
 MarTech
10 Best Marketing Intelligence Tools & Platforms in 2026
The 10 best marketing intelligence tools in 2026, compared: Improvado, Similarweb, ZoomInfo, AlphaSense, Crayon, Klue, BuzzSumo, Data.ai, HubSpot, and Visualping - features, pricing, and ideal use case for each.
-
 Analytics
What is Marketing Intelligence? Definition, Types, and Strategy (2026 Guide)
Learn what marketing intelligence is, its core types, and the 5-stage maturity curve, plus how to build one source of truth for your marketing data.
-
%25202.png) MarTech
MarTechHow to Choose the Right Digital Marketing Agency: A Complete 2026 Guide
Our 6-step guide shows you how to choose the right digital marketing agency. Learn to evaluate expertise, analyze data capabilities, and compare proposals to find a partner that drives real business growth and boosts marketing ROI.
-
.png) Analytics
AnalyticsHow to Increase Marketing ROI: 14 Proven Tactics for 2026
Your attribution model shows 40% of conversions as (direct)/(none). CPA increased 30% last quarter. Learn 14 data-backed tactics to fix attribution gaps and recover wasted spend.
-
 MarTech
AI Assistants: Complete Comparison Guide 2026
Discover the ultimate claude vs chatgpt vs gemini comparison for marketing in 2026. Compare features, boost SEO, and choose the best AI assistant today.
-
 Analytics
Google Ads Analytics: Complete Framework for Marketing Analysts (2026)
Master Google Ads analytics with diagnostic decision trees, attribution conflict resolution, and vertical-specific benchmarks. Optimize campaigns systematically.
-
![Ad Spend Tracking: The Ultimate Guide to Optimize ROI [2026]](https://improvado.io/5a1eb87c9afe1000014a4c7d/69fca03e409501a4d2b419a5_69fca03bdc353261c23e07a0_og-effective-ad-spend-monitoring.png) Dashboards
DashboardsAd Spend Tracking: The Ultimate Guide to Optimize ROI [2026]
Master ad spend tracking with our definitive guide. Learn to monitor spend across Google, Facebook, & more, automate reporting, and use the best tools to maximize your marketing ROI. Stop guessing, start optimizing.
-
 MarTech
5 Best Insurance Analytics Software for Marketing Teams in 2026
Compare the top 5 insurance analytics platforms for marketing teams. Learn which tools handle multi-agent attribution, offline sales integration, and compliance.
-
 MarTech
AI Marketing Automation: The Ultimate Guide for 2026
See how AI marketing automation drives hyper-personalization and predictive analytics, with 9 real use cases, tool comparisons, and ROI benchmarks.
-
 Performance
Ad Spend Optimization Guide: 5 Data-Backed Ways to Cut Waste and Boost ROAS in 2026
5 data-backed tactics to optimize ad spend in 2026. Includes diagnostic flowcharts, benchmark tables, and failure case studies to reduce CPA and improve ROAS.
-
 Analytics
11 Best CPG Software Platforms in 2026: Analytics, Retail Execution & Field Management
Compare 11 CPG analytics platforms for marketing analysts. Evaluate trade promotion ROI, POS integration, and syndicated data costs before you buy.
-
 Analytics
9 Best GDPR-Compliant Analytics Tools for Marketing Teams in 2026
Compare 9 GDPR-compliant analytics tools on EU hosting, cookieless tracking, consent and DSAR automation. Scored on stated criteria, not vendor claims.
-
 Analytics
12 Best Retail Analytics Platforms for Marketing Teams in 2026
Compare 12 retail analytics tools for multi-location retailers: pricing, implementation time, total cost, and real failure patterns across 3 scenarios.
-
 Analytics
The Ultimate Guide to Ecommerce Analytics Tools for 2026
Compare 14 ecommerce analytics tools with a decision matrix, hidden costs, implementation timelines, and failure scenarios vendor sites leave out.
-
 Editor's choice
Claravine Alternatives: 3 Superior Solutions Guide
Discover 3 superior Claravine alternatives for 2026 to enhance marketing data accuracy, compliance, and efficiency. Compare features and choose the best fit.
-
 Editor's choice
Tableau vs. Power BI vs. Looker: The Ultimate 2026 BI Tool Comparison
Deep dive into Tableau vs Power BI vs Looker. Compare key features, pricing, ease of use, data visualization, and AI. Find the best business intelligence tool for your team's needs in our 2026 analysis.
-
 Analytics
How to Use Looker Studio in 2026: Beginner's Guide for Marketing Analysts
Looker Studio is Google's free drag-and-drop BI tool. This 2026 guide covers connector setup, blend-error fixes, and 15+ calculated field formulas.
-
 Analytics
Looker vs. Looker Studio: The Definitive 2026 Comparison
Enterprise BI or free dashboards? Compare Looker and Looker Studio for marketing analytics: governance, scale, cost, and performance limits.
-
 Analytics
Business Intelligence Looker vs Power BI: Best Platform 2026
Business intelligence Looker vs Power BI: Compare integration, usability, data manipulation, and pricing to choose the best BI tool in 2026.
-
 Editor's choice
Marketing Compliance: The Ultimate Guide to Protecting Your Brand in 2026
Master marketing compliance in 2026. Our ultimate guide covers key regulations (GDPR, CCPA), data privacy, and advertising standards. Learn to build a robust compliance strategy to protect your brand, avoid fines, and build customer trust.
-
 MarTech
The Ultimate Guide to DV360 Campaign Setup (2026 Edition)
Master DV360 campaign setup with our step-by-step guide. Learn expert tips on targeting, bidding, creative management, and optimization to maximize your programmatic advertising ROI across all channels.
-
%2520(1).png) MarTech
MarTechGoogle Display Network (GDN) vs. DV360: A Complete Comparison for 2026
Choosing between DV360 vs GDN? This guide dives deep into key differences in targeting, cost, reach, and creative options. Unlock advanced programmatic strategies and decide which display platform is right for your advertising campaigns.
-
 MarTech
Trade Desk vs DV360: The Ultimate DSP Showdown for 2026
Dive into our in-depth 2026 comparison of The Trade Desk vs DV360. We analyze targeting, pricing, inventory, and reporting features to help you choose the right DSP for maximum programmatic advertising ROI. Make a data-driven decision.
-
%2520(1).png) MarTech
MarTechThe Ultimate Guide to DV360 Audiences: Targeting & Strategy
Master DV360 audiences with our complete guide. Learn to leverage first-party, Google, and third-party data for precise targeting, advanced segmentation, and maximum campaign ROI. Drive better results with smarter audience strategies in Display & Video 360.

-
 MarTech
CM360 vs. DV360: A Complete Guide to Integration & Key Differences
Discover the key differences between CM360 and DV360, and learn how integrating these tools boosts campaign management, targeting, and performance.
-
 MarTech
DV360 vs. Google Ads: The Definitive 2026 Comparison
DV360 or Google Ads? Compare targeting, inventory, costs, and real attribution conflicts. Decision framework, budget thresholds, and when each platform win
- MarTech
Programmatic vs. Google Ads: The Definitive Guide to Choosing Your Platform
Discover the core differences between Programmatic Advertising and Google Ads. Learn which platform is best for reach, targeting, and ROI to optimize your 2026 ad strategy.
-
 MarTech
DSP vs SSP: The Ultimate Guide to Programmatic Advertising Platforms (2026)
DSP buys ads, SSP sells them. Compare real cost structures, bidding mechanics, and how to troubleshoot performance issues in programmatic advertising.
-
 MarTech
The Ultimate Guide to Demand-Side Platforms (DSPs) in 2026
Discover everything about Demand-Side Platforms (DSPs) in our comprehensive 2026 guide. Learn how DSPs work, their role in programmatic advertising, key benefits, and how to choose the best platform to maximize your ad ROI.
-
![Lead Generation Tools: Top Solutions for Business Growth [2026]](https://improvado.io/5a1eb87c9afe1000014a4c7d/69fc74c025ff340939c5bd4a_69fc74bd386db78b21d30a28_og-lead-generation-tools-comprehensive-guide.png) MarTech
MarTech25 Best Lead Generation Tools for 2026 (With Small-Business & Nurturing Picks)
The 25 best lead generation tools for small businesses in 2026: real pricing, setup time, and top picks for tight budgets and lean marketing teams.

-
 MarTech
Top 15 AI Lead Generation Tools for Marketing Analysts in 2026
Marketing analyst review of 15 AI lead gen tools: accuracy benchmarks, cost calculators, compliance audits, and failure modes. ZoomInfo, Clay, Apollo teste
-
 MarTech
AI in Sales: 7 Strategies to Accelerate Growth 2026
Discover 7 proven strategies using sales operations AI tools to accelerate deal cycles, boost efficiency, and drive growth in your sales process in 2026.
-
 MarTech
ABM Solution Lead Generation: 7 Digital Marketing Strategies
ABM solution lead generation: Discover 7 proven digital marketing lead generation strategies to fuel your pipeline and convert high-quality leads in 2026.
-
 Performance
Lead Generation Process: Beginner's Guide 2026
How to generate leads in 5 steps: attract, capture, nurture, qualify, and convert prospects into customers. Inbound, outbound, and hybrid tactics for 2026.
-
 Editor's choice
Marketing Data Governance: The Complete Implementation Guide for 2026
Complete marketing data governance framework: maturity model, implementation roadmap, failure prevention, and 250+ pre-built rules for campaign accuracy.
-
 MarTech
The Ultimate Guide to a Winning Programmatic Advertising Strategy
Master your programmatic advertising strategy. This guide covers everything from audience targeting and bidding to measurement, helping you boost conversion rates and ROI with first-party data.
-
 MarTech
Dynamic Creative Optimization: The Ultimate Guide for 2026
Unlock the power of Dynamic Creative Optimization (DCO). Learn how DCO advertising works, explore top platforms, and implement strategies to deliver personalized ads that boost engagement, conversions, and campaign ROI. Master DCO today.
-
%2520(1).png) Big Data
Big DataThe Ultimate Guide to Performing a Data Quality Audit [2026]
Learn how to conduct a comprehensive data quality audit. This guide covers planning, metrics, tools, and remediation to ensure your data is accurate, consistent, and drives reliable business decisions. Achieve data integrity with our step-by-step process.
-
%2520(1).png) Analytics
AnalyticsB2B Programmatic Advertising Strategies for Marketing Analysts (2026)
Marketing analyst's guide to B2B programmatic platforms, hidden costs, and attribution strategies. Compare StackAdapt, Trade Desk, Demandbase—with failure diagnostics.
-
%2520(1).png) MarTech
MarTechThe Ultimate Guide to Ad Inventory in 2026
Explore our complete guide to ad inventory. Learn what it is, the different types (premium, remnant, video), how to calculate it, and management tips to maximize monetization and advertising ROI. Master digital ad space buying and selling.
-
 Performance
Frequency Capping: The Ultimate Guide to Definition, Strategy & Best Practices
Master frequency capping in digital marketing. Learn how to set optimal ad frequency on Google, Meta & programmatic to prevent ad fatigue, maximize ROI, and improve user experience. Your ultimate guide.
-
 MarTech
What is Display Advertising? Complete Guide to Types, Platforms & Best Practices 2026
A complete guide to display advertising: ad formats, targeting methods, top platforms, and proven strategies to boost brand awareness and ROI in 2026.
-
![Insertion Order (IO): The Complete Guide for Advertisers [2026]](https://improvado.io/5a1eb87c9afe1000014a4c7d/69fca5588141e843a77c65ed_69fca556b4586f0fda56812a_og-what-is-an-insertion-order.png) Performance
PerformanceInsertion Order (IO): The Ultimate Guide for Advertisers [2026]
Master insertion orders in 2026. This ultimate guide covers what an IO is, its benefits, best practices, and includes a free template. Learn to streamline advertising campaigns and ensure financial control for maximum ROI.
-
 Performance
Marketing Effectiveness: A Complete Guide to Measurement & Improvement in 2026
Unlock true marketing effectiveness. Learn to measure performance with key metrics, advanced models, and data-driven strategies to maximize your ROI. Unify your data with Improvado for a complete view of your marketing impact.
-
%2520(1).png) Analytics
AnalyticsReal-Time Marketing in 2026: Strategy, Tools, and Implementation Guide
Master real-time marketing with proven frameworks, platform-specific playbooks, failure case analysis, and cost breakdowns. Includes RTM readiness diagnostic.
-
 Performance
Marketing Information Management: Complete Implementation Guide for 2026
Complete MIM guide: architecture decisions, maturity model, failure patterns, and vertical-specific approaches. Learn build vs buy trade-offs.
-
![Marketing Campaign Naming Conventions: Best Practices & Examples [2026]](https://improvado.io/5a1eb87c9afe1000014a4c7d/69fca5eaae45794d2dc5a3e4_69fca5e876650680aa155ee9_og-marketing-campaign-naming-conventions.png) Performance
PerformanceCampaign Naming Conventions: A Complete Guide to Best Practices [2026]
Learn the best practices for standardizing marketing campaign naming conventions. Our guide provides clear examples and a structured process to ensure consistent naming for efficient campaign management and reliable reporting.
.jpeg)
-
%2520(1).png) Big Data
Big DataData Blending: The Ultimate Guide to Unifying Your Data [2026]
Master data blending. This guide covers what it is, key steps, tools, and best practices for combining multiple data sources like Tableau and spreadsheets into a single, actionable dataset for powerful analytics and better decision-making.
-
 Performance
PPC Optimization: How to Maximize Your PPC Strategy
Learn how to optimize PPC campaigns for higher ROAS and lower costs. See how Improvado unifies 1,000+ ad platforms for data-driven PPC performance insights.
-
 Big Data
Data Hygiene: The Ultimate Guide to Clean & Accurate Data
Master data hygiene with our complete guide. Learn best practices for cleaning data, removing duplicates, and ensuring accuracy to boost marketing ROI and drive growth.
-
 Analytics
Automated Client Reporting: Complete Implementation Guide for 2026
Complete 2026 guide: automated client reporting selection, implementation, and optimization. Includes tool comparison, failure case studies, and 90-day rollout.
-
 Big Data
Data Standardization: The Ultimate Guide to Why It Matters and How to Do It
Learn what data standardization is, why it's critical, and how to implement a process. See examples, benefits, and best practices for creating trusted, analysis-ready data.
.jpeg)
-
![Data Quality Management: The Ultimate Guide & Best Practices [2026]](https://improvado.io/5a1eb87c9afe1000014a4c7d/69fbaf5742420ba29d1ff136_69fbaf5302a13fea5aebe47c_og-data-quality-management.png) Big Data
Big DataThe Definitive Guide to Data Quality Management: Strategies, Tools & Frameworks
Data quality management (DQM) cleanses, validates, and monitors data across its lifecycle - the 6 core dimensions and a 5-step framework for 2026.
-
 Big Data
Data Discrepancy: The Ultimate Guide to Identify, Fix, and Prevent It
Stop making decisions on bad data. Learn the causes of data discrepancy, from Google Analytics to your CRM, and discover a framework to fix inconsistencies and build a single source of truth for reliable, decision-ready insights.
-
![Augmented Analytics: How AI Is Transforming Analytics [2026]](https://improvado.io/5a1eb87c9afe1000014a4c7d/6a079a9f343867bc5795eb90_6a079a9ddf85c276d9799846_og-augmented-analytics-guide.png) Analytics
AnalyticsAugmented Analytics: Ultimate Guide for Marketers 2026
Augmented analytics: Discover features, benefits, and practical tips for adopting AI-powered analytics in your marketing strategy for 2026.
-
%2520(1).png) Big Data
Big DataMarketing Data Stack: The Ultimate Guide for 2026
Build a high-performance marketing data stack in 2026. This guide covers components, AI trends, Snowflake integration, and data privacy to unify analytics, prove ROI, and drive growth.
-
 MarTech
Data as a Product (DaaP): The Definitive Guide to Unlocking Data Value
Unlock the true value of your data. Learn what Data as a Product (DaaP) is, see real-world examples, and discover how this approach boosts ROI, improves decisions, and drives innovation.
-
 Analytics
Social Media Reporting for Marketing Analysts: Framework, Metrics, and Tools (2026)
Build social media reports that drive decisions. Learn maturity models, metric selection, stakeholder translation, and automation strategies for 2026.
-
 Big Data
15 Best Enterprise Data Management Tools for 2026
Compare 15 enterprise data management tools with pricing, TCO analysis, and deployment timelines. Find the right platform for your data governance needs.
-
%2520(1).png) Big Data
Big DataData Storytelling: Guide to Transforming Data 2026
Data storytelling: Discover techniques for transforming complex data into compelling narratives for better marketing insights in 2026.
-
%2520(1).png) Dashboards
DashboardsExecutive Dashboard Software for Marketing Analysts (2026): 5 Tools to Track KPIs Without Manual Reporting
Compare top executive dashboard tools for marketing analysts. Real TCO, latency benchmarks, and scenario-to-solution mapping—not generic feature lists.
-
 Performance
Marketing Taxonomy: The Definitive Guide for Data-Driven Growth
Learn how to build a marketing taxonomy that streamlines strategy, boosts efficiency, and powers accurate reporting. This guide covers examples, best practices, and tools to transform your marketing data from chaos to clarity.
-
 Performance
Decision Intelligence: Benefits & Components 2026
Discover what is decision intelligence and how it transforms complex data into clear insights to boost business decisions and drive success in 2026.
-
 Performance
The Ultimate Guide to Retail KPIs & Metrics for 2026
Unlock growth with our complete guide to retail KPIs. Learn to track key retail metrics for sales, inventory, and customers to improve efficiency and boost profitability. Master data-driven decisions for 2026.
-
 Big Data
What Is Data Governance? A Comprehensive Guide
Learn the definition of data governance, why it's crucial for data quality and security, and how to build an effective framework. Explore key components, benefits, and best practices for 2026.
-
 Analytics
Business Intelligence for Marketing: Complete Guide for 2026
Complete guide to marketing BI in 2026: maturity models, TCO frameworks, tool comparisons (Tableau, Power BI, Looker), implementation roadmaps, and real ROI calculations.
-
![Business Intelligence as a Service: Top Tools [2026]](https://improvado.io/5a1eb87c9afe1000014a4c7d/6a079b027d4d930e86f7b61d_6a079b000e90d89901d195d6_og-self-service-business-intelligence-tools.png) Performance
PerformanceSelf-Service BI Tools: Best Platforms & Benefits 2026
Self-service BI tools: Explore the best platforms, features, and benefits for empowering your team with business intelligence in 2026.
-
 Analytics
Financial Data Analysis: 2026 Tools, Techniques & Decision Framework
Master financial data analysis with 2026 tools (CambioML, Power BI, Fathom), an 8-point validation checklist, and 5 real failures costing $500K-$50M.
-
 Analytics
What is Retail Analytics? A Complete Guide to Data-Driven Retail
Discover how retail analytics transforms raw data into actionable insights. Learn to optimize inventory, understand customer behavior, and boost profits with data-driven strategies for business success.
-
 Big Data
Data Integration Solutions: Enterprise Guide 2026
Explore the top data integration strategies, methods, and tools for 2026. Learn how enterprises unify data for analytics, AI, and business intelligence.
-
 Dashboards
Sales Dashboard: 25 Core Metrics, Benchmarks & Design Framework (2026)
Build sales dashboards that predict revenue gaps 30-60 days ahead. 25 metrics with formulas, benchmarks, visualization types, and alert thresholds.
-
 Dashboards
ROI Dashboard: How to Build, Use, and Optimize Marketing ROI Reporting in 2026
Learn how to build ROI dashboards and reports that prove marketing impact. Includes templates, benchmark data, and failure case analysis for 2026.
-
%2520(1)%2520(1).png) Analytics
AnalyticsSearch-Driven Analytics: The Ultimate Guide to AI-Powered Insights
Discover how search-driven analytics transforms data into answers. Learn to use natural language, AI, and machine learning for faster, actionable insights that drive business growth.
-
 Performance
The Ultimate Guide to Building and Optimizing Your Customer Acquisition Funnel
Master the customer acquisition funnel. Learn to build, analyze, and optimize every stage to lower CAC, boost conversions, and maximize marketing ROI with a unified data approach.
-
 Big Data
What is Data Enrichment? Everything You Need to Know
Learn what data enrichment is, its benefits, and 2026’s top tools. See how Improvado enriches marketing data from 1,000+ sources for 99.9% accurate insights.
-
 Big Data
Data-Driven Decision Making: A Practical Guide to Business Growth
Learn the benefits of data-driven decision making (DDDM). This guide covers the key steps, tools, and examples to help you use data to inform your business strategy, improve ROI, and gain a competitive advantage.
-
![Essential Sales Metrics & KPIs to Track for Performance [2026]](https://improvado.io/5a1eb87c9afe1000014a4c7d/69fc9c2460d03967f449222e_69fc9c2160d03967f4491fe3_og-sales-metrics.png) Performance
PerformanceThe Ultimate Guide to Sales Metrics: KPIs, Tracking & Strategy for 2026
Discover the most important sales metrics and KPIs to measure performance, drive revenue, and build a winning sales strategy. Learn how to track everything from lead conversion to CLV with a unified data approach for unparalleled insights.
-
 MarTech
The 15 Best Ad Hoc Reporting Tools for 2026
Discover the 15 best adhoc reporting tools for 2026 to create custom reports, analyze data dynamically, and boost fast, data-driven decision-making.
-
 Big Data
Data Automation: The Ultimate Guide to Unlocking Business Efficiency in 2026
Unlock efficiency with data automation. Learn what it is, its benefits, see examples, and explore top tools and solutions. Streamline your data management from collection to analysis and make smarter, faster decisions.
-
 Big Data
What Is Data Integrity and Why Does It Matter?
Learn the definition of data integrity, its different types, and why it matters. Explore best practices for maintaining the accuracy, consistency, and reliability of data throughout its lifecycle for better business decisions.
-
 Performance
The Ultimate PPC Budget Guide for 2026: How to Calculate & Maximize ROI
Master your PPC budget in 2026. Learn to calculate, allocate, and manage your ad spend across Google, Meta, and LinkedIn for maximum ROI. Our guide covers formulas, strategies for small businesses, and data-driven optimization.
-
 Editor's choice
Healthcare Business Intelligence: A 2026 Guide to Improving Patient Outcomes
Explore top healthcare business intelligence tools like Tableau & Power BI. Learn how BI improves patient care, reduces costs, and ensures HIPAA compliance for healthcare organizations.
-
 Analytics
Ecommerce Analytics in 2026: Metrics, Tools, and Implementation Guide
Complete guide to ecommerce analytics: essential metrics, tool comparisons, attribution strategies, and implementation frameworks for scaling in 2026.
-
 Analytics
PPC Analysis: Complete 2026 Guide for Marketing Analysts
Master PPC analysis with diagnostic frameworks, metric interpretation, and automation validation. Includes benchmark data and common pitfalls.
-
 MarTech
Top 5 Enterprise Business Intelligence Software Solutions in 2026
Compare the best enterprise business intelligence platforms: Power BI, Tableau, Qlik Sense, Tellius, and Domo. Features, pricing, hidden costs, and when NOT to use each tool.
-
![What is Ad Hoc Reporting? Meaning, Benefits & Tools [2026]](https://improvado.io/5a1eb87c9afe1000014a4c7d/69fca5b9812765e0764be445_69fca5b7812765e0764be35c_og-ad-hoc-reporting.png) Analytics
AnalyticsThe Definitive Guide to Ad Hoc Reporting
Discover the complete guide to ad hoc reporting. Learn its meaning in business, benefits, key features, and how to create custom reports for real-time insights and agile decision-making.
-
 Dashboards
Executive Dashboards: 13+ Examples, Templates & Best Practices [2026 Guide]
Discover 13 executive dashboard examples for CEOs, CFOs & CMOs. Learn best practices, key metrics, and how to build a real-time dashboard that drives data-driven decisions.
-
 Performance
Advertising Analytics: Metrics, Attribution, and Optimization for 2026
See all 15 advertising analytics metrics, a conflict-diagnosis matrix, and 2026 attribution models to fix zero-click, high-position ad reporting fast.
-
 Performance
SEO vs PPC: The Ultimate Guide to Finding Your Perfect Marketing Mix
A side-by-side comparison of SEO vs. PPC costs, ROI, and results, plus a practical framework for combining both into one integrated marketing strategy.
-
%2520(1).png) MarTech
MarTech7 AI Marketing Trends Reshaping Strategy in 2026
Discover 7 AI marketing trends reshaping 2026: from AI Overviews killing organic traffic to machine customers. Includes adoption frameworks & ROI benchmarks.
-
 MarTech
The New Era of Insights: How Artificial Intelligence is Revolutionizing Business Intelligence
Explore the transformation of business intelligence with AI. Learn the key differences, benefits, and use cases of AI in BI to unlock predictive insights, automate analytics, and drive smarter business decisions.
-
 MarTech
AI Report Generation: 15 Best Tools, Use Cases & Implementation Guide (2026)
Compare 15 AI reporting tools with real-world use cases, implementation roadmaps, and readiness diagnostics. Includes pricing, failure modes, and TCO analysis.
-
 Performance
Paid Search Marketing: A Beginner's Guide to Digital Advertising
Paid search marketing (PPC/SEM) means paying per click for search engine ads. Learn the auction model, keyword match types, and 2026 best practices.
-
%2520(1).png) Performance
PerformanceMarketing Budget Pacing: A Complete Guide for 2026
Master budget pacing in 2026. Learn formulas, monitoring workflows, failure forensics, and platform-specific tactics to hit spend targets without waste.
-
 MarTech
MarTech Spotlight: Nov. 20, 2023
Today, we're exploring the latest news in MarTech: AI regulations, ChatGPT multimodal mode, SEO shifts, and Google's GA4 Data Redaction for privacy.
-
 MarTech
The Ultimate Guide to AI Marketing Campaigns in 2026
Explore the future of advertising with AI marketing campaigns. See 10+ real-world examples from Nike & Heinz, discover top tools, and learn how to launch and measure AI-powered campaigns for massive ROI. Get the ultimate 2026 guide.
-
%2520(1).png) MarTech
MarTechA Week in AI Marketing Analytics, Week 45
Uncover the valuable insights on AI in marketing analytics from Improvado AI Agent and discover the questions that marketers asked.
-
 Editor's choice
AI Marketing Analytics: The Ultimate Guide to Data-Driven Insights
Unlock the future of marketing with AI marketing analytics. Discover top tools, strategies, and use cases to enhance segmentation, predict trends, and maximize ROI. Transform your data into actionable, AI-driven marketing insights today.
-
 Editor's choice
Best AI Marketing Tools for Marketing Analysts in 2026
Compare 36 AI marketing tools across analytics, content, email, and social. Includes integration conflicts, hidden costs, and performance benchmarks.
-
 MarTech
What Is AI Marketing in 2026? (Benefits, Use Cases & When NOT to Use It)
94% of teams use AI marketing, but only 41% prove ROI. Learn what works, hidden costs, when NOT to use AI, and how to measure real business impact in 2026.
-
%2520(1).png) MarTech
MarTechHIPAA-Compliant Healthcare Marketing Analytics in 2026: Implementation Guide
Complete guide to implementing HIPAA-compliant marketing analytics. Migration strategies, vendor comparison, real case studies, and 30-day implementation checklist.
-
 MarTech
Ad Operations Guide 2026: Programmatic vs. Direct Media Buying for Marketing Analysts
Master ad ops workflows, troubleshoot delivery issues, and choose the right execution method. Practical guide for marketing analysts with decision frameworks.
-
 MarTech
The Ultimate Guide to Programmatic Advertising: How It Works in 2026
Learn what programmatic advertising is and how it works. This guide breaks down the automated process of media buying, its benefits, and how marketers can use programmatic ads to drive ROI.
-
 MarTech
The Trade Desk: Features & Best Practices 2026
Discover The Trade Desk’s top features and best practices for 2026 to optimize programmatic campaigns and boost your advertising ROI with data-driven strategy
-
 Editor's choice
Bing Ads vs. Google Ads: The Ultimate 2026 Comparison Guide
Bing Ads (Microsoft Advertising) offers 30-60% lower CPC than Google Ads and reaches 700M+ users. Compare cost, audience, and B2B targeting for 2026.
-
 Performance
Quora Ads: The Ultimate 2026 Guide to Unlocking High-Intent Audiences
Master Quora Ads in 2026. Our complete guide covers targeting, ad formats, costs, and advanced strategies to boost conversions and ROI on one of the most underrated advertising platforms.
-
 Performance
Twitter Advertising Guide: Formats, Targeting, Budgeting & Real ROI (2026)
Twitter advertising costs $0.50–$2.00 per engagement. Learn formats, targeting, budget optimization, and when Twitter beats LinkedIn or Meta in 2026.
-
 Analytics
Amazon Ads Analytics in 2026: The Complete Guide for Marketing Analysts
Master Amazon Ads analytics in 2026: platform selection frameworks, diagnostic workflows, reconciliation procedures, and AMC SQL templates for marketing analysts.
-
%2520(1).png) Performance
PerformanceTikTok Advertising Guide for Marketing Analysts (2026)
Complete TikTok advertising guide for marketing analysts: campaign structure, creative testing frameworks, attribution setup, and diagnostic troubleshooting.
-
 Analytics
The Ultimate Guide to Facebook Ads Analytics in 2026
Master Facebook Ads analytics with our complete 2026 guide. Learn to track key metrics, analyze performance, and use advanced tools like Improvado to unify data and maximize your ROI.
-
 Analytics
Google Ads Campaign Management Guide: 2026 Strategies for Marketing Analysts
Complete Google Ads campaign management guide for marketing analysts: campaign types, bidding strategies, structure audits, and automation diagnostics.
-
%2520(1).png) Performance
PerformanceLinkedIn Advertising Guide: Campaign Setup, Targeting & ROI Optimization for 2026
Master LinkedIn ads with this 2026 guide: economic qualification, targeting combos, CRM attribution setup, ad formats, and campaign failure diagnostics.
-
 MarTech
What Is Growth Marketing? A 2026 Guide to Driving Business Growth
Learn what growth marketing is and how to build a data-driven strategy for exponential growth. This guide covers key principles, tactics, team roles, and examples to optimize the full customer journey.
-
%2520(1).png) Performance
PerformanceQualitative vs. Quantitative Metrics: The Complete Guide
Unlock the 'why' behind your data. This guide covers qualitative vs. quantitative metrics, key examples, and how to measure success by balancing both for deeper business insights and smarter decision-making.
-
 Analytics
Top 10 Marketing Analytics Trends for 2026
Discover the top marketing analytics trends for 2026: AI-powered automation, MTA+MMM convergence, privacy-first measurement, and unified frameworks replacing silos.
-
 Analytics
What Is Client Reporting? Framework, Best Practices, and Tools (2026)
Learn client reporting essentials: key metrics, cadence frameworks, maturity stages, and automation strategies. Includes templates and benchmarks for 2026.
-
 Big Data
Structured vs. Unstructured Data: The Ultimate 2026 Guide
A deep dive into structured vs. unstructured data. Understand the key differences, use cases, pros, cons, and how to manage both for powerful business insights. Learn to transform raw data into a strategic asset.
-
 Analytics
What is Google BigQuery? A Complete Guide for 2026
Discover Google BigQuery, the fully managed, serverless data warehouse on Google Cloud. Learn how its architecture, AI platform, and real-time analytics capabilities help you manage and query petabyte-scale data.
-
 Big Data
The Metrics Layer: Your Single Source of Truth for KPI Definitions
Discover the metric layer: the single source of truth for your KPIs. Learn its components, benefits, and how it differs from a semantic layer to unify business intelligence and drive actionable insights from your data.
-
 Big Data
Data Democratization: The Ultimate 2026 Guide to Transforming Your Business
Unlock the power of data democratization. Learn to provide universal access to trusted, real-time data, foster a data-driven culture, and empower your teams to make smarter business decisions with our comprehensive 2026 guide.
-
![Location Data: The Ultimate Guide to Strategy & Use Cases [2026]](https://improvado.io/5a1eb87c9afe1000014a4c7d/69fca083341e22c6faa4e245_69fca0804468d8fc64ec07fe_og-what-is-location-data.png) Big Data
Big DataLocation Data: The Ultimate Guide to Strategy, Privacy & Use Cases for 2026
Discover the ultimate guide to location data. Learn its types, sources, and top business use cases. Master privacy, analytics, and strategy to unlock powerful consumer insights and drive marketing ROI with our comprehensive overview for 2026.
-
 Performance
What Is Non-Aggregatable Data? A Definitive Guide for Marketers
Unlock accurate marketing analytics by understanding non-aggregatable data. Learn the types, pitfalls, and solutions for handling unique metrics, conversion rates, and more.
-
 MarTech
What Is an API Connector? The Complete 2026 Guide
Unlock seamless data integration with API connectors. Learn how they work, compare pre-built vs. custom solutions, and see real-world examples to automate workflows and boost marketing ROI. Master your data stack today.
-
 Performance
Walled Gardens in Advertising: The Ultimate Strategy for 2026
Conquer walled gardens like Google, Meta & Amazon. Our guide covers pros, cons, measurement challenges, and the strategy to unify your advertising data for max ROI.
-
 Performance
Marketing Incrementality: The Ultimate Guide to Measurement & Testing
Unlock true marketing impact with incrementality. Learn to measure causal lift, eliminate wasted spend, and optimize ROAS with proven testing methods. Go beyond attribution to understand what truly drives growth.
-
 Performance
PESO Framework: Complete Guide for Digital Marketers 2026
Discover how peso marketing unlocks Paid, Earned, Shared, and Owned media strategies to boost your 2026 digital campaigns and maximize ROI effectively.
-
 Big Data
1st Party vs. 3rd Party Data: The Ultimate Guide for Marketers in 2026
Understand the critical differences between 1st party and 3rd party data. Learn how to build a powerful marketing strategy by leveraging high-quality, direct customer data while navigating the cookieless future. Unlock deeper personalization and ROI.

-
 Performance
What Is Incremental Sales? The Ultimate Guide to True Marketing Impact
Unlock revenue growth with our complete guide to incremental sales. Learn the definition, formula, and best practices to calculate and measure the true impact of your marketing ROI.
-
%2520(1).png) Analytics
AnalyticsThe Ultimate Guide to Drill Down Reports: From Creation to Analysis
Unlock deeper data insights with drill down reports. Learn to create interactive reports, leverage powerful drill down capabilities, and transform your business intelligence strategy. Make smarter, data-driven decisions today.
-
%2520(1)%2520(1)%2520(1).png) Performance
PerformanceStealth Marketing: Strategy for Brand Success 2026
Discover how stealth marketing boosts brand awareness and trust in 2026 with subtle strategies that drive growth without high costs.
-
 MarTech
What Is a Tracking Pixel? How Pixels Measure Marketing Performance in 2026
Tracking pixels undercount conversions 20-40% due to ad blockers and Safari ITP. Learn how pixels work, when they fail, and server-side alternatives for 2026.
-
%2520(1)%2520(1).png) Performance
PerformanceStatic Report vs. Dynamic Report: The Ultimate 2026 Guide
Explore the critical differences between static and dynamic reports. Learn when to use a static snapshot for historical data versus a dynamic, real-time dashboard for agile decision-making. Transform your business intelligence and drive growth.
-
 Performance
Marketing Acronyms: 60 Must-Know Terms 2026
Discover 60 essential marketing abbreviations to simplify your strategy, boost campaign success, and stay ahead in 2026’s evolving digital landscape.
-
 Performance
What Is Direct Marketing? A Complete Guide
Explore direct marketing, a strategy using channels like email, direct mail, and SMS to reach individual consumers. Learn how it works with key types and examples to build your customer base.
-
%2520(1).png) Big Data
Big DataSocial Media Data Mining: Complete Guide 2026
Discover how social media data mining unlocks powerful marketing insights to improve targeting, optimize campaigns, and drive strategic growth in 2026.
-
 Big Data
Data Interpretation: The Ultimate Guide to Turning Numbers into Strategy
Master data interpretation with our complete guide. Learn the key methods, steps, and practical examples to turn raw business data into actionable insights that drive growth and informed decisions.
-
%2520(1).png) Performance
PerformanceEcommerce CRO in 2026: Agency vs. In-House vs. Tool Stack Decision Guide
Should you hire a $15k/mo agency, build a $240k in-house team, or deploy a $200/mo tool stack? This guide shows which breaks even fastest for your traffic.

-
 Performance
The Ultimate Guide to Google Ads Metrics: Track, Analyze & Optimize
Master the most important Google Ads metrics for 2026. This guide covers key performance indicators (KPIs) from CTR to ROAS. Learn to track, analyze, and optimize your campaigns for maximum profitability with our comprehensive definitions and strategies.
-
%2520(1).png) Big Data
Big DataThe Ultimate Guide to Marketing Data Lakes for 2026
Unlock unparalleled marketing insights with a data lake. Learn how to centralize structured and unstructured data, enable advanced analytics, and build a 360-degree customer view to drive ROI. This comprehensive guide covers benefits, architecture, and implementation.
-
 Performance
Partner Marketing: The Ultimate Guide to Strategies & Examples 2026
Explore our complete 2026 guide to partner marketing. Learn about types, strategies, and real-world examples to build successful marketing partnerships, track performance with unified data, and maximize your ROI.
-
 Performance
Pinterest Blog Traffic: 2026 Guide to Growth
Discover how to get views on Pinterest 2026 with proven strategies to boost blog traffic, optimize content, and grow your audience using data-driven insights.
-
 Performance
SEO Analytics Guide: Advanced Diagnostic Methodologies for Marketing Analysts (2026)
SEO analytics diagnoses the 15 scenarios where GA4, GSC, Semrush, and Ahrefs disagree - with the exact metric to trust and how to resolve each conflict.
-
 Big Data
Data Analytics Frameworks in 2026: The Pragmatic Guide for Proving Marketing ROI
Discover how a data analytics framework in 2026 can prove marketing ROI with core components, tool comparisons, and a practical rollout playbook.
-
%2520(1).png) Big Data
Big DataData Ethics: Ethical Data Management Guide 2026
Discover ethical considerations in data analytics with our 2026 guide to transparent, fair, and responsible data management for enterprise success.
-
 Big Data
7 Major Data Privacy Challenges in Big Data Analytics (2026)
Navigate the 7 most critical data privacy challenges in big data analytics in 2026—from consent management to AI governance—with forensic case studies and compliance frameworks.
-
 Analytics
Customer Journey Analysis: The Definitive Guide to Boosting ROI [2026]
Master customer journey analysis. This guide covers the benefits, tools, and a 6-step process to analyze data, improve customer journeys, and boost your marketing ROI. See how unified platforms can help.
-
%2520(1).png) Editor's choice
Editor's choice7 B2C Marketing Trends for 2026: What Works, What Fails, and What to Prioritize
B2C marketing trends 2026: AI personalization, AR commerce, zero-party data. Includes adoption costs, failure cases, and decision trees for Marketing Analysts.
-
 Performance
Marketing Activities: 6 Key Drivers for Growth 2026
Discover what are marketing activities and how 6 key drivers can boost sales, build loyalty, and fuel your business growth in 2026. Learn more today.
-
%2520(1).png) Analytics
AnalyticsMultivariate Testing Guide: When MVT Pays Off and When It Fails (2026)
Master multivariate testing: traffic requirements, interaction effects, fractional factorial designs, and 5 failure patterns that corrupt results. Includes decision framework.
-
%2520(1).png) Editor's choice
Editor's choicePII Compliance: The Ultimate Guide & Checklist for 2026
Master PII compliance with our definitive 2026 guide. Learn to protect sensitive data, ensure regulatory compliance with GDPR & CCPA, and avoid costly fines. Explore our checklist and best practices to build unbreakable customer trust.
-
 Performance
What Is Customer Acquisition Cost (CAC)?
Customer Acquisition Cost (CAC) is the total expense to acquire a new customer. Learn the formula to calculate CAC, its importance for ROI, and proven strategies to optimize your marketing spend.
-
%2520(1).png) Big Data
Big DataData Fabric: The Ultimate Guide to Unified Data Architecture
Discover what a data fabric is: a modern data architecture and management solution. Learn how its governed and automated systems enable seamless data integration to unify your analytics and accelerate insights.
-
%2520(1).png) Performance
PerformanceMarketing Center of Excellence: The Ultimate Guide to Building Success
Discover how a Marketing Center of Excellence (CoE) boosts efficiency, drives innovation, and proves ROI. Learn the models, best practices, and implementation steps to build a successful marketing CoE with our complete guide.
-
 Analytics
Integrated Marketing Communications: Strategy, Implementation & Diagnostic Framework for 2026
Complete IMC strategy guide: 7-step diagnostic framework, attribution models, channel integration architecture, and failure case studies for marketing analysts.
-
 Performance
B2B vs B2C Content Marketing: 2026 Strategy Guide
Compare B2B and B2C content marketing strategies with 2026 data on buying committees, AI search, and attribution models. Includes decision frameworks and benchmarks.
-
%2520(1).png) Performance
PerformanceB2B Content Marketing: Strategy & Promotion 2026
B2B content marketing: Learn effective planning, creation, and promotion strategies to drive business growth and engagement in 2026.
-
 Performance
How to Run a Successful Marketing Campaign: A 10-Step Guide for 2026
Learn the 2026 marketing campaign best practices: AI-powered personalization, cross-channel governance, and data-driven optimization frameworks that drive
-
 Analytics
Campaign Analytics: Complete Optimization Guide
Discover how campaign analytics can boost your marketing ROI with key metrics, tools, and strategies to optimize performance and drive data-driven success
-
 Analytics
Customer Lifetime Value (CLV): Complete Guide for Marketing Analysts in 2026
Master CLV calculation, modeling, and optimization. Includes formulas, benchmarks, worked examples, and diagnostic tools for marketing analysts.
-
 Performance
Customer Lifetime Value Software for SaaS: When to Automate, When to Track Manually (2026)
Marketing teams waste 40+ hours/quarter on manual LTV calculations. Learn when CLV software beats spreadsheets, plus selection criteria for 2026.
-
 Performance
KPI Tracking: The Ultimate Guide to Measuring Business Success in 2026
Master KPI tracking with our definitive guide. Learn to select, monitor, and visualize key performance indicators with best practices, tools, and dashboards to drive data-driven growth and business success.
-
 Performance
Marketing KPIs: The Ultimate Guide to Track Performance & Prove ROI
Discover the most important marketing KPIs to track. Learn how to measure key performance indicators like CAC, CLV, and ROI to prove your marketing impact. Unify data from all platforms for a complete view of your performance.
-
 Performance
How to Create a Customer Journey Map: A Step-by-Step Guide
Create a customer journey map to understand customer pain points and visualize their experience. Learn the key stages, elements, and tools to design a better user experience and drive ROI.
-
![How to Create a Marketing Plan: A Step-by-Step Guide [2026]](https://improvado.io/5a1eb87c9afe1000014a4c7d/69fbc391e6872e7be1b662b5_69fbc38de0e10ed2e6b442a8_og-how-to-write-a-marketing-plan.png) Performance
PerformanceHow to Create a Marketing Plan: The Ultimate Step-by-Step Guide for 2026
Learn how to create a successful marketing plan from scratch with our step-by-step guide. This comprehensive resource includes examples and a template to help you define your strategy, set goals, and drive measurable results.
-
 Performance
The Complete Guide to Marketing Campaigns: Strategy, Types, and Execution
Discover 17 types of marketing campaigns with real-world examples. Learn how to plan, organize, and analyze your strategy to drive data-driven success and inspire your next creative project.
-
%2520(1).png) Performance
PerformanceThe Ultimate Guide to B2B Marketing Reports for 2026
Unlock powerful insights with our 2026 B2B Marketing Report guide. Explore key benchmarks, trends, and strategies for data-driven decisions. See how top B2B marketers prove ROI and optimize campaigns with unified analytics.
-
 Editor's choice
The Ultimate B2B Marketing Strategy Guide for Growth in 2026
Discover the essential B2B marketing strategies to drive growth and ROI. Our 2026 guide covers everything from content marketing and ABM to sales alignment and data analytics.
-
 Analytics
13 B2B Marketing Trends Defining 2026 (+ When NOT to Follow Them)
Discover the B2B marketing trends reshaping 2026: agentic AI, buying group ABM, brand-demand convergence, and AI search optimization. Includes failure cases.
-
 Performance
The Ultimate Guide to Brand Measurement: Metrics, Models & Strategy
Master brand measurement with our complete guide. Learn to track key brand metrics, measure brand awareness, and prove your marketing's impact on business growth. Unify your data with Improvado.
-
 MarTech
Customer-Driven Marketing Strategy: Implementation Guide for 2026
Build a customer-driven marketing strategy with first-party data, AI personalization, and journey orchestration. Includes maturity assessment and failure cases.
-
 Performance
Your Ultimate Guide to Creating a Marketing Budget That Drives Growth
Build a powerful marketing budget plan for 2026. This guide covers budget breakdown, allocation models, tracking tools, and free examples to maximize your marketing ROI and prove your impact.
-
 Performance
Marketing Budget Allocation in 2026: A Data-Driven Framework for Maximum ROI
Master marketing budget allocation with frameworks from $480M in analyzed spend. Includes failure case studies, hidden cost analysis, and channel benchmarks.
-
 MarTech
MarTech Trends: 10 Innovations to Watch in 2026
Explore 2026’s biggest MarTech trends – from AI-driven personalization to first-party data and automation. See how Improvado powers them with unified data.
-
 MarTech
The 2026 MarTech Guide: What It Is and Why It Matters
Learn what MarTech is, why it matters in 2026, and how to build a MarTech stack. Key tools, categories, and best practices for marketing ROI.
-
![What is Performance Marketing? A Complete Guide to Driving ROI [2026]](https://improvado.io/5a1eb87c9afe1000014a4c7d/69fc9ea707c429bfcc299bdb_69fc9ea4fda8211fa3815590_og-what-is-performance-marketing.png) Performance
PerformanceWhat is Performance Marketing? The Ultimate Guide for 2026
Learn what performance marketing is – the digital marketing strategy where advertisers only pay for specific actions like a sale or click. Explore top channels, benefits, and KPIs to drive measurable ROI for your enterprise.
-
 Performance
What is Strategic Marketing? Definition, Process & Framework for Success 2026
Discover what strategic marketing is and how it drives long-term business growth. Learn the definition, core process, and framework for success in 2026 – from market research and competitive analysis to strategic planning, positioning, and ROI measurement
-
 Performance
Multi-Channel Marketing Strategy: A Data-First Guide for Marketing Analysts (2026)
Build, measure, and optimize multi-channel campaigns with attribution frameworks, channel sequencing playbooks, and failure mode diagnostics for analysts.
-
 Performance
What Is a Marketing Channel? The Definitive 2026 Guide
See the marketing channels definition, 15+ digital and traditional types with examples, and a 5-step framework to pick and measure the right channel mix.
-
 Performance
The Ultimate Guide to Developing a Successful Business Intelligence Strategy
Build a winning business intelligence strategy. This guide covers the key components, steps, and best practices to transform your data into data-driven decisions, improve ROI, and gain a competitive edge in 2026.
-
 Analytics
Business Intelligence Trends 2026: Strategic Implementation Guide for Marketing Analysts
Strategic BI trends guide for 2026: augmented analytics, real-time data, AI agents. Includes failure rates, TCO analysis, and stage-based adoption roadmaps.
-
 Analytics
The Complete Guide to Predictive Modeling
Explore predictive modeling, a statistical technique using machine learning to forecast future outcomes. Learn about key techniques, applications across industries, and current trends to gain data-driven insights.
-
![What is Data Integration? Definition, Methods & Use Cases [2026]](https://improvado.io/5a1eb87c9afe1000014a4c7d/69fc9b96c672fc62dd8fa0d9_69fc9b8f07c429bfcc27ccdd_og-what-is-data-integration.png) Big Data
Big DataWhat is Data Integration? A Complete Guide
Learn the process of combining data from multiple sources into a unified view. Explore data integration methods, benefits, common use cases, and tools to improve business decisions.
-
%2520(1).png) Dashboards
DashboardsDashboard Design: Best Practices & How-Tos 2026
Learn proven dashboard design principles for marketing analysts. Includes decision frameworks, anti-patterns, and 25+ implementation templates.
-
%2520(1).png) Analytics
AnalyticsWhat Is Business Intelligence in 2026? Definition, Tools & Implementation Guide
Business intelligence transforms raw data into actionable insights. Learn how BI works, top 2026 tools, and when BI isn't the right solution for your team.
-
 Analytics
Understanding Business Analytics: The Definitive 2026 Guide
Unlock the power of your data. This complete guide to understanding business analytics covers types, processes, tools, and best practices to drive growth, enhance efficiency, and gain a competitive edge in 2026.
-
.png) Analytics
AnalyticsBusiness Analytics: What It Is & Why It Matters 2026
Discover why is business analytics important in 2026 and learn how it drives data-driven decisions, boosts efficiency, and fuels business growth.
-
.png) Editor's choice
Editor's choice10 Best NinjaCat Alternatives & Competitors in 2026
Compare top NinjaCat alternatives: Improvado, TapClicks, AgencyAnalytics, and 7 more. Migration guides, pricing TCO, and connector gap analysis for agencies.
-
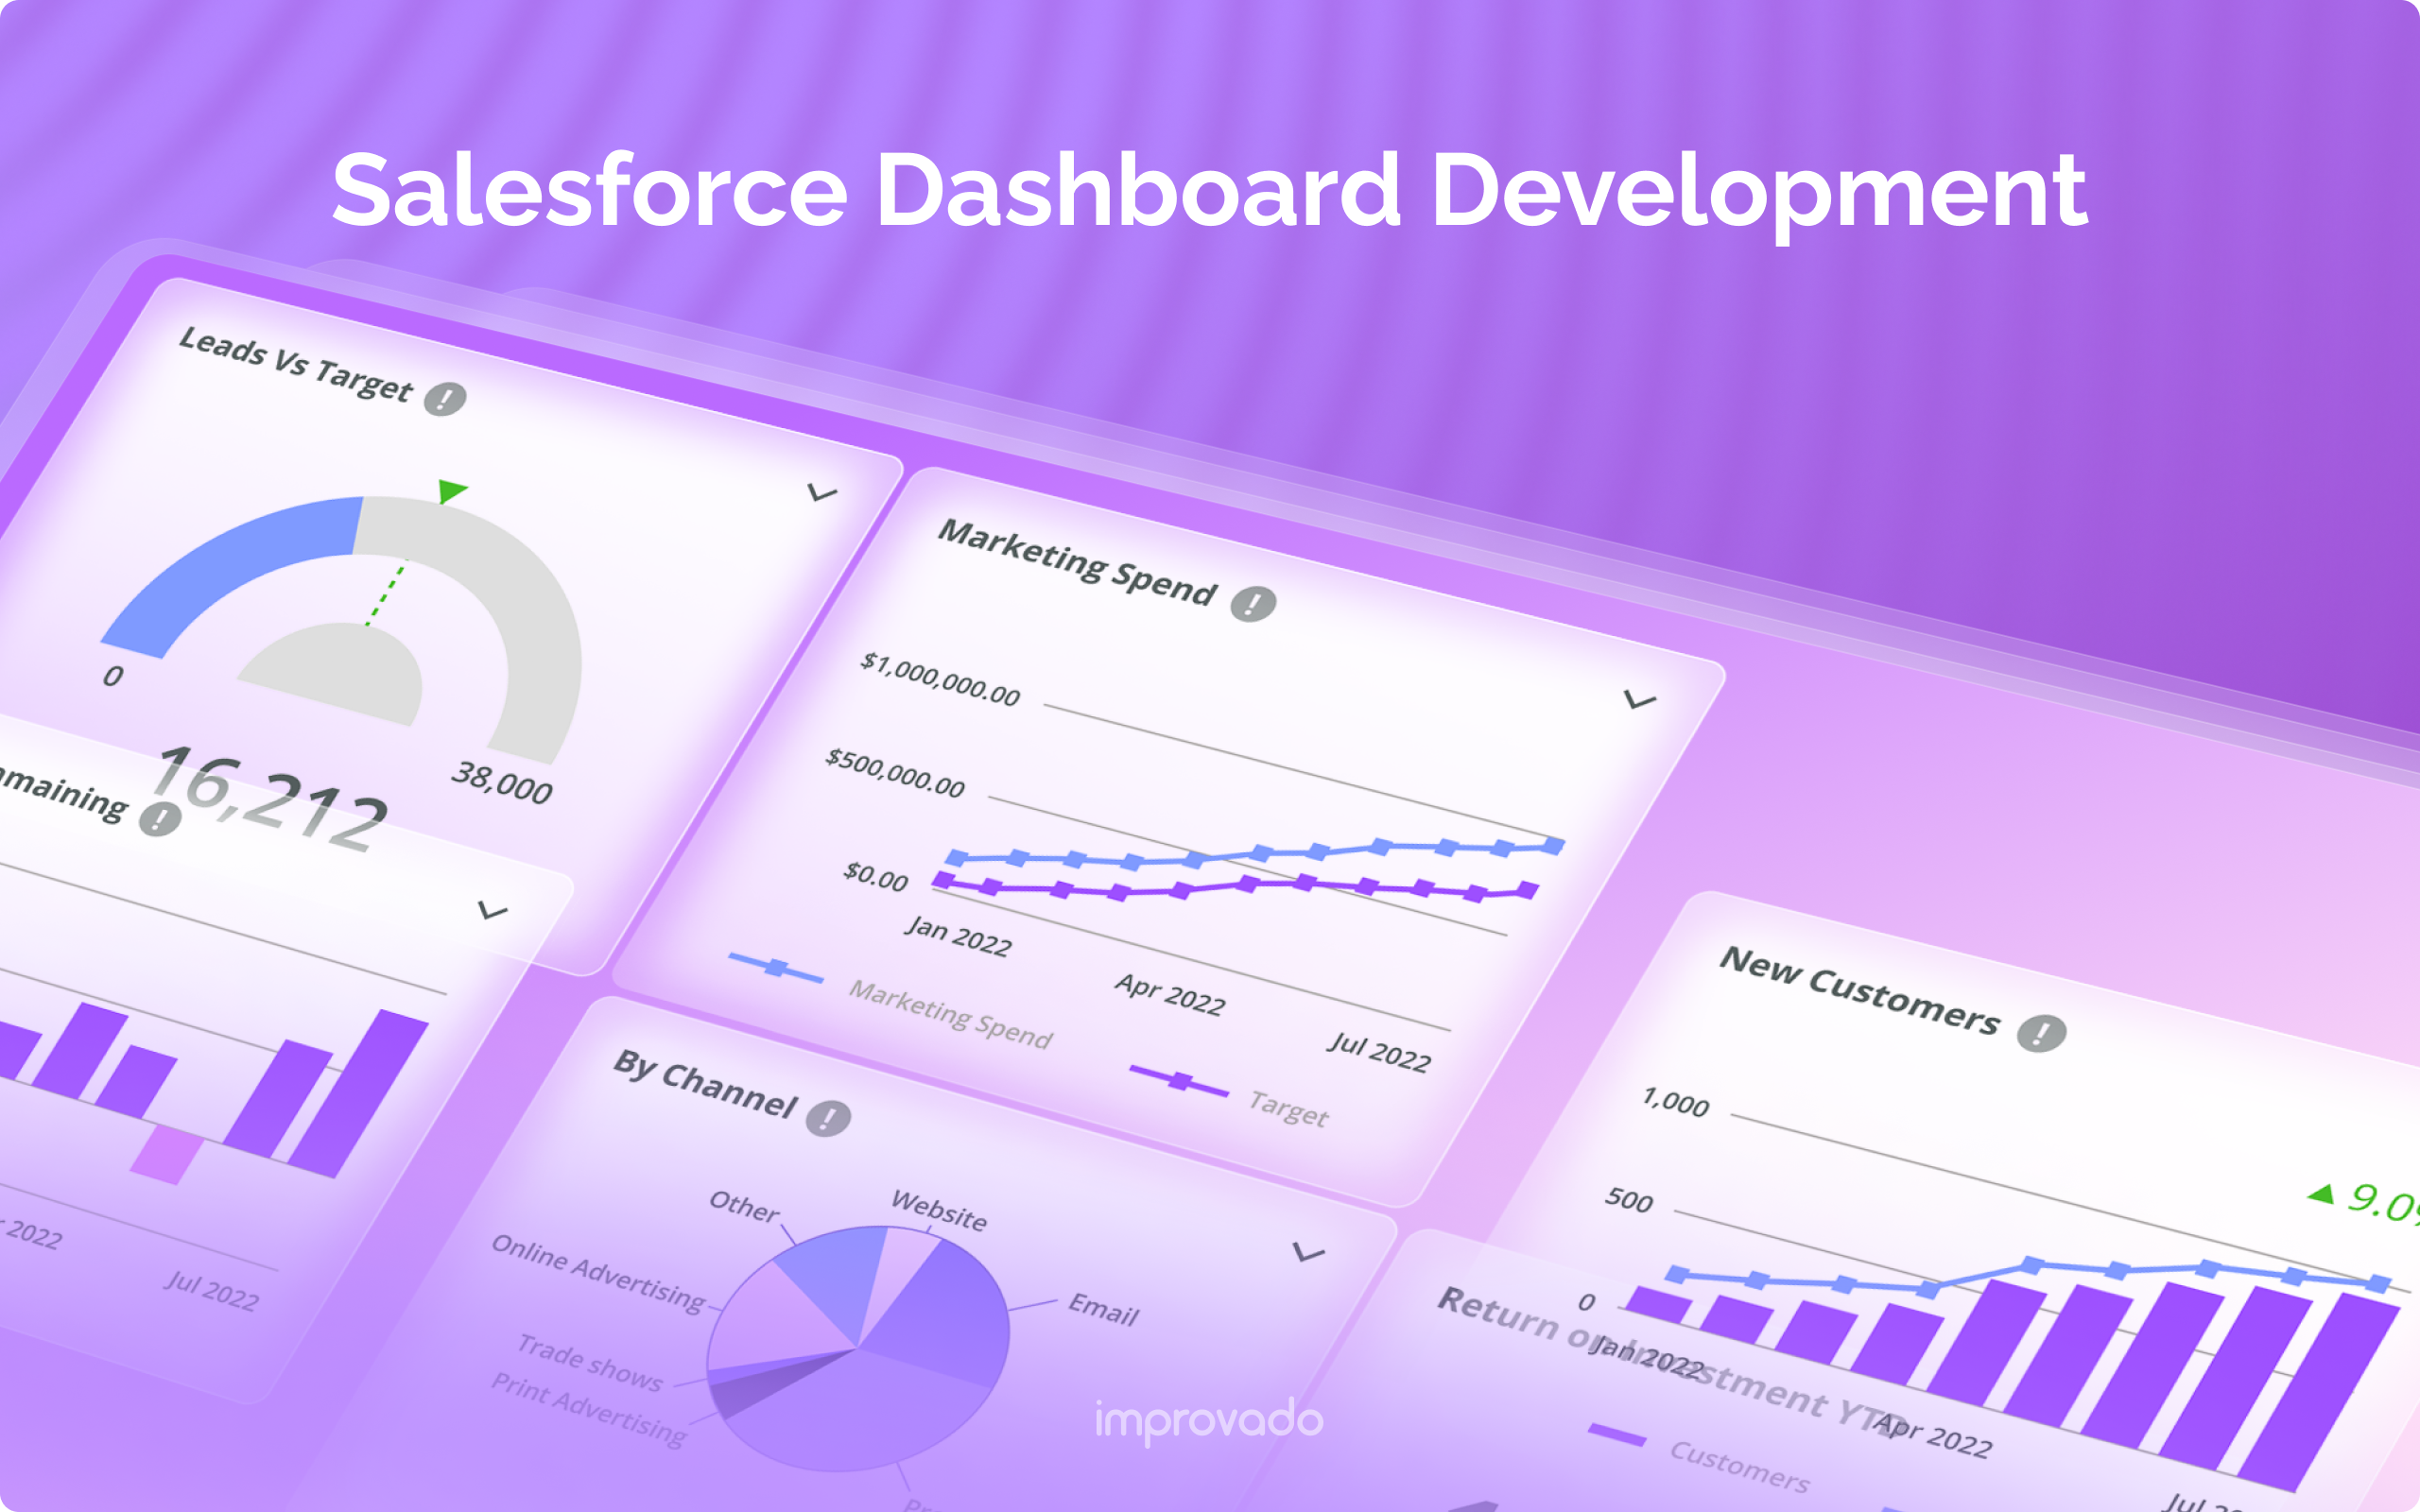 Dashboards
Salesforce Dashboard Examples: 5 Production Specifications for Marketing Analysts (2026)
Complete Salesforce dashboard specifications with component lists, source reports, and screenshots. Includes Sales Overview, AE, Pipeline Quality, Forecast, and Marketing dashboards.
-
 Dashboards
The Ultimate Guide to the Pinterest Ads Dashboard in 2026
Unlock the full potential of your Pinterest advertising. Learn to build a powerful Pinterest Ads dashboard, track key metrics, optimize campaigns for higher ROAS, and integrate data from all your marketing channels.
-
 Dashboards
TikTok Ads Dashboard: How to Set Up, Metrics to Track, and When to Build Custom Dashboards (2026 Guide)
Learn how to set up TikTok Ads dashboards, track creative-level metrics, avoid attribution landmines, and choose between native vs. custom BI tools in 2026.
-
.png) Dashboards
DashboardsTwitter (X) Ads Dashboard: Build Custom Reports That Drive Performance in 2026
Build Twitter Ads dashboards that track CPM, CTR, conversions with real-time API data. Includes objective-metric matrices, benchmark tables, and failure case studies.
-
 Dashboards
The Ultimate Guide to the Amazon Ads Dashboard (2026)
Unlock actionable Amazon Ads insights with a structured analytics dashboard. Learn which metrics matter, how to build cross-channel reporting, and see real dashboard examples for campaign optimization, budget control, and profitability tracking.
-
 Dashboards
Influencer Marketing Dashboard: Build, Configure, and Optimize in 2026
Build an influencer marketing dashboard with fraud detection, multi-platform attribution, and ROI tracking. Compare platforms, API setup, and SQL queries.
-
 Performance
The Ultimate Guide to Marketing Reporting Tools for 2026
Compare 11 marketing reporting tools for 2026. Rankings based on integrations, ETL, attribution, and cost, with honest pros, cons, and buyer fit.
-
 Analytics
The Ultimate Guide to Instagram Analytics: Tools & Metrics for 2026
Master your social media performance with our 2026 guide to Instagram analytics. Explore the best free tools, track key metrics, and optimize your content strategy for growth.
-
 Performance
What is a KPI Dashboard? Complete Guide to Key Performance Indicators Dashboards 2026
Learn what KPI dashboards are and how they transform data into actionable insights. This 2026 guide covers KPI dashboard types, benefits, examples, and best practices to help you track performance, align teams, and make data-driven decisions in real time.
-
 Dashboards
The Ultimate Shopify Dashboard Guide: Analytics, KPIs & Real-Time Store Performance
Master your Shopify dashboard. This complete guide covers analytics, real-time reporting, key metrics, and customization to track store performance and boost sales. Go beyond native tools with unified dashboards.
-
![Agency Analytics Alternative: Best Reporting Tools for Agencies [2026]](https://improvado.io/5a1eb87c9afe1000014a4c7d/69fc9fec238d517845d27582_69fc9fe883aab784b008b037_og-agencyanalytics-alternatives-competitors.png) Editor's choice
Editor's choiceAgencyAnalytics Alternative: Top 5 Reporting Tools 2026
Agency analytics alternative: Discover the top 5 reporting tools for agencies. Compare features, pricing, and unique value for better insights.
-
 Dashboards
The Ultimate Guide to Building a Social Media Dashboard in 2026
Build the ultimate social media dashboard. Unify data from Facebook, Instagram, LinkedIn & more to track real-time analytics, automate reporting, and prove ROI. Optimize your strategy with powerful, actionable insights.
-
 Dashboards
Content Marketing Dashboard: Track Performance Across All Channels in 2026
Build a content marketing dashboard that tracks revenue, attribution, and engagement. Includes tools comparison, metric benchmarks, and implementation steps.
-
 Dashboards
Google Analytics Dashboard: Build Custom GA4 Dashboards That Drive Decisions (2026 Guide)
Build custom GA4 dashboards that surface decision-driving metrics. Includes 10 role-specific templates, troubleshooting flowchart, and audit checklist.
-
 Dashboards
Adwords Reporting: Google Ads Dashboard Guide 2026
Discover how to build a powerful Google Ads dashboard to track campaign performance, boost ROI, and optimize your 2026 ad strategies with expert insights.
-
 Dashboards
Web Analytics Dashboard: Build Guide + 12 Tool Comparisons (2026)
Build or buy? Compare 12 web analytics dashboard tools, see real implementation costs, and get failure-tested frameworks. For marketing analysts.
-
 Dashboards
The Ultimate Guide to Your LinkedIn Ads Dashboard in 2026
Unlock powerful insights with a LinkedIn Ads dashboard. Learn to track key metrics, optimize campaign performance, and integrate data for a complete view of your marketing ROI. See templates and best practices.
-
 Big Data
Data Silos: The Definitive Guide to Breaking Them Down in 2026
Uncover what data silos are, the problems they cause for business operations, and a step-by-step guide to eliminate them. Learn how a unified data strategy enhances collaboration, improves customer experience, and drives data-driven decisions.
-
 Performance
Return on Marketing Investment (ROMI): The Ultimate 2026 Guide
Master Return on Marketing Investment (ROMI). This ultimate guide covers the formula, calculation, benchmarks, and strategies to prove and maximize your marketing ROI. See how Improvado unifies data for accurate measurement.
-
.png) Performance
Performance6 PPC Trends Reshaping Performance Marketing in 2026
Discover 6 critical PPC trends for 2026—AI automation limits, privacy-first targeting, first-party data, and when smart bidding fails. Data-driven insights for marketing analysts.
-
 Performance
Return on Ad Spend (ROAS): The Definitive 2026 Guide
ROAS formula, what counts as good across Google Ads, Meta, TikTok, and Amazon, plus a break-even calculator. See industry benchmarks before you set targets.
-
 Performance
Cost Per Acquisition (CPA): The Complete Guide to Calculation, Strategy & Optimization
Master Cost Per Acquisition (CPA) with our complete guide. Learn the CPA formula, calculate it for any channel, and discover proven strategies to lower your acquisition costs and maximize marketing ROI with unified analytics.
-
.png) Big Data
Big DataData Management: Challenges & Solutions 2026
Data management: Learn the practice of processing, storing, and organizing data to foster a data-driven culture in marketing organizations in 2026.
-
 Dashboards
The Ultimate Guide to Email Marketing Dashboards
Build a powerful email marketing dashboard to track key metrics and boost campaign ROI. Explore examples, templates, and best practices for creating a real-time reporting dashboard that drives data-driven decisions and proves your marketing value.
-
 MarTech
Build vs. Buy Data Pipeline: The Definitive 2026 Decision Guide
Should you build or buy your data pipeline? This guide compares cost, scalability, security, and maintenance to help you choose the best solution for your data team and business needs in 2026.
-
 MarTech
ETL vs ELT: The Definitive Guide to Key Differences (2026)
Explore the key differences between ETL and ELT data processing. Our guide compares ETL vs ELT on speed, cost, scalability, and use cases to help you choose the right data integration approach for modern data warehousing.
-
 MarTech
Best Segment.io Alternatives: Features & Prices Compared
Looking for Segment alternatives? Compare prices, features, and competitors. Choose the best solution for your team. Improve your data pipeline now!
-
.png) Performance
PerformanceScaling Facebook Brand Awareness Campaigns in 2026: A Complete Guide for Marketing Analysts
Learn to scale Facebook brand awareness campaigns with SQL attribution frameworks, EARL diagnostics, and vertical benchmarks. 2026 guide for analysts.
-
 Dashboards
What is a Digital Dashboard? Definition, Examples & Guide
Learn what a digital dashboard is, its types, and top tools for 2026. See how Improvado unifies 1,000+ data sources into real-time, customizable BI dashboards.
-
.png) Performance
PerformanceFinance Marketing Challenges in 2026: Segment-Specific Severity Analysis and Compliance-Aware Solutions
Finance marketers face AI fraud (42.5% of attempts), ROI scrutiny (79.2% budget growth), trust barriers, and data silos. Segment-specific severity analysis + remediation frameworks.
-
.png) Analytics
AnalyticsAn Advanced Guide to UTM Naming Conventions & Best Practices
Ensure your UTM tracking delivers reliable campaign data. This guide covers UTM parameter definitions, naming‐convention models, common pitfalls, and enterprise best practices for 2026.
-
 Big Data
Data Observability: Definition & Use Cases 2026
Data observability: Understand the concept, benefits, and how to use observability to gain valuable insights from raw data in 2026.
.png)
-
 Analytics
B2C Data Analysis Process: A Practical Guide for Marketing Analysts in 2026
Master the B2C data analysis process with SQL patterns, failure cases, and diagnostic tools. Learn which methods work for your business question.
- Performance
Choosing Marketing Attribution Software in 2026: A Buyer's Guide
Choose the right marketing attribution software for your maturity stage. Compare 8 platforms, avoid common failures, and calculate true TCO before buying.
-
.png) MarTech
MarTechMarketing Data Warehouse: The Ultimate 2026 Guide
Build a single source of truth for marketing. Our guide covers design, platforms (BigQuery, Snowflake), and benefits. Break down data silos and unify analytics from all your sources like Google Ads, Facebook, and more.
-
 Performance
Voice SEO: The Ultimate Guide to Optimize for 2026
Learn voice search SEO for 2026: optimize conversational content, schema markup, and Google Business Profile to win featured snippets and voice rankings.
-
 MarTech
What Is Reverse ETL? The Ultimate Guide for 2026
Discover what Reverse ETL is, how it works, and its key benefits. Learn to sync data from your data warehouse to business applications like Salesforce & HubSpot to activate data and drive operational efficiency.
-
 Analytics
7 Smart Ways to Improve Ecommerce Customer Data Collection in 2026
Master ecommerce data collection in 2026. Learn privacy-compliant tracking, first-party strategies, and tools like Triple Whale and GA4 for accurate insights.
-
%2520(1).png) Big Data
Big DataData Quality: The Ultimate Guide to Trustworthy Data in 2026
Master data quality in 2026. Learn the 7 dimensions, key metrics, and best practices to improve accuracy and drive revenue. Transform your messy data into a trusted asset with a unified analytics platform.
-
 Performance
eBay Advertising: The Ultimate Guide to Promoted Listings & Ad Campaigns
Master eBay Ads with our ultimate guide. Learn to set up and optimize Promoted Listings, boost sales, and increase listing visibility with expert campaign strategies.
-
 Analytics
Data Privacy and Compliance for Marketers: 2026 Guide
Actionable privacy compliance frameworks for marketing teams: pre-flight audits, consent strategies, vendor protocols, and privacy-preserving attribution.
-
 MarTech
Cross-Channel Marketing Platforms: Complete 2026 Buyer's Guide
Compare 12 cross-channel marketing platforms for unified customer engagement. Features, pricing, integration requirements, and selection framework.
-
 Performance
Vanity Metrics: How to Stop Using Them & What to Track Instead
Stop tracking vanity metrics. Learn to identify misleading KPIs like followers and likes, and discover the actionable metrics that truly measure marketing ROI and drive meaningful business growth.
-
 Analytics
10 Best Social Media Analytics Tools for 2026
Compare the top social media analytics tools in 2026: Sprinklr, Brandwatch, Hootsuite, Sprout Social, and more. Find the right fit for your team size and budget.

-
 Analytics
The Ultimate Guide to YouTube Analytics: 15 Metrics That Matter
Master YouTube Analytics with our complete 2026 guide. Learn how to track key channel metrics, understand video performance, and analyze audience data to drive sustainable growth and YouTube success.
-
 Performance
Marketing Attribution Models: The Ultimate Guide for 2026
Explore the definitive guide to marketing attribution models. Learn the difference between single-touch, multi-touch, and algorithmic models to accurately measure your customer journey, optimize spend, and maximize campaign ROI.
-
.png) Analytics
AnalyticsThe Ultimate Guide to Inbound Email Marketing Strategy [2026]
Master inbound email marketing. This guide covers strategy, inbound vs. outbound differences, personalization, and how to fuel engagement. Learn to build a data-driven approach that attracts, nurtures, and converts your target audience.
-
 Performance
Media Planning vs. Media Buying: The Definitive 2026 Guide
Uncover the key differences between media planning vs. media buying. Learn the strategic processes, roles, and tools to optimize campaign success and maximize your marketing ROI with a data-driven approach.
-
 MarTech
What Is Embedded Analytics? Why It Matters & How to Use It
Discover how embedded analytics transforms decision-making with real-time insights. Explore benefits, use cases, best practices, and future trends.
-
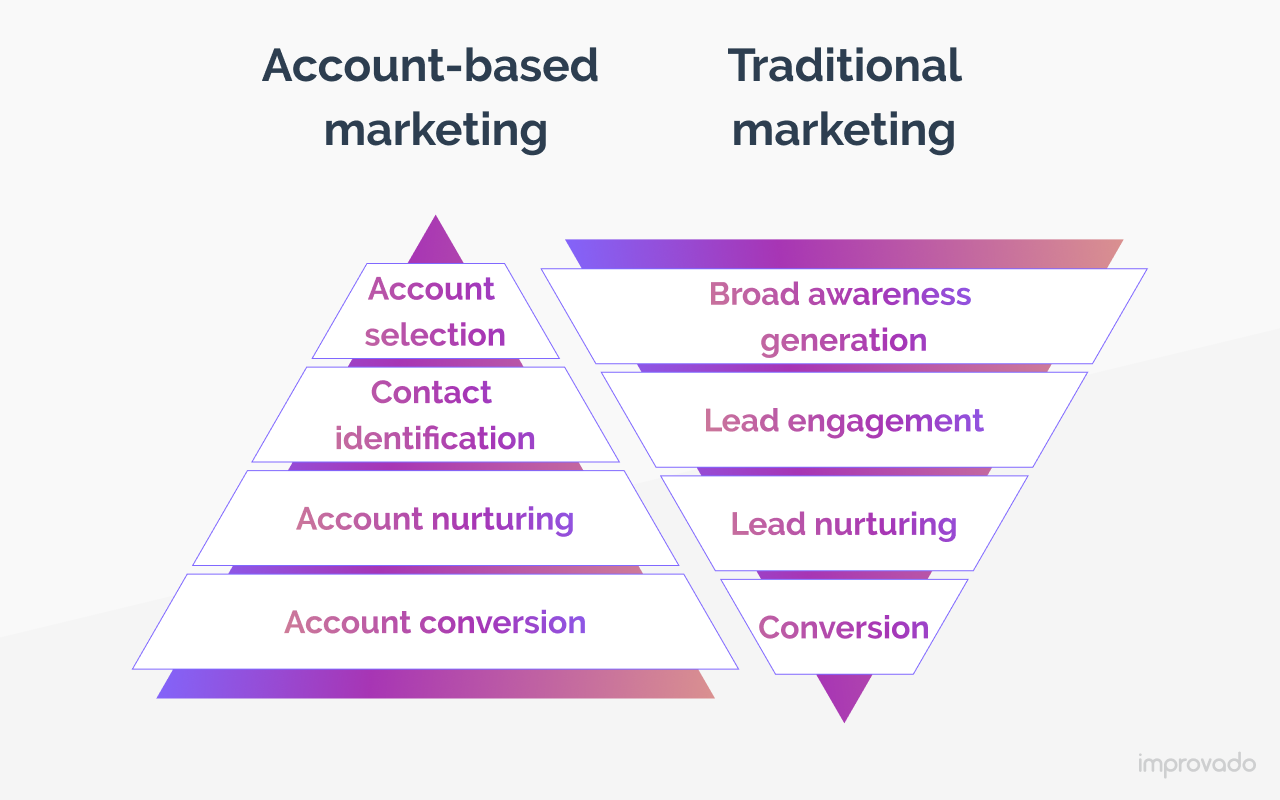 Performance
The Ultimate Guide to Account-Based Marketing (ABM) Strategy & Tools
Learn how to build a winning Account-Based Marketing (ABM) strategy. This guide covers the benefits, tactics, tools, and challenges of targeting high-value accounts with personalized 1-to-1 experiences to shorten sales cycles and prove ROI.
-
.png) Big Data
Big DataWhat Is a Data Mesh? A Complete Guide to Its Architecture & Principles
Explore data mesh architecture, a decentralized approach to data management. Learn its 4 core principles, benefits for enterprise-scale analytics, and how domain-oriented data organization solves modern data challenges.
.png)
-
![Best Revenue Operations Software: How to Implement [2026]](https://improvado.io/5a1eb87c9afe1000014a4c7d/69fcb33cc20652951fd6dfff_69fcb3378f597aa7b2c6be69_og-revenue-operations-implementation-checklist.png) Performance
PerformanceRevenue Operations: Implementation Checklist 2026
Revenue operations: Follow this step-by-step checklist to restructure sales and marketing into RevOps and drive growth in 2026.
-
 Performance
The Ultimate Guide to Fintech Marketing: Strategies, Channels & Analytics
Master fintech marketing strategy: build trust-first content, cut the $784 average CAC, and unify acquisition data across every channel in 2026.
-
 Performance
Instagram Growth Strategies for Marketing Analysts in 2026
Data-driven Instagram growth playbook for 2026: diagnostics for stalled accounts, budget-specific playbooks, attribution frameworks, and vertical-specific tactics.

-
 Performance
The Ultimate Guide to Sales and Marketing Alignment [2026 Best Practices]
Achieve powerful sales and marketing alignment. Our guide covers 7 B2B strategies, key metrics, and the tech stack you need to smash revenue goals. Drive growth with a unified team.
-
 MarTech
Social Media Monitoring Tools for Trend Detection in 2026: 11 Platforms Compared
Compare 11 social media monitoring tools on trend detection speed, sentiment accuracy, and alert quality. Maturity tiers, pricing, and decision framework included.

-
 Performance
Geo Targeting Advertising: The Ultimate Guide for 2026
Unlock the power of geo targeting advertising. Learn how geographic targeting works, best practices for Google & Meta, and how to measure ROI. Drive local sales and boost engagement with location-based ads.
-
 MarTech
The Ultimate Guide to Social Media Data, Statistics & Analytics (2026)
Unlock the power of social media data in 2026. Explore global user statistics, analytics tools, and a step-by-step guide to collection and analysis for explosive business growth.
-
 MarTech
AI Lead Generation: The Complete Guide to Scaling Growth in 2026
Compare 14 AI lead generation tools with pricing, integrations, and ROI data. Learn best practices, failure modes, and selection criteria for marketing an
-
 Performance
B2B Marketing Automation: 5 Best Platforms 2026
Compare the 5 best B2B marketing automation platforms for 2026 - HubSpot, Klaviyo, ActiveCampaign, Customer.io, Brevo - pricing, TCO, and deal-breakers.
-
 Performance
Marketing Automation: Implementation Guide 2026
Marketing automation: Learn how to implement automation in your team to streamline processes and optimize marketing investments in 2026.
-
 Analytics
11 Best HIPAA-Compliant Marketing Analytics Tools for 2026
Compare HIPAA-compliant analytics platforms with BAAs, encryption, and PHI filtering. Includes GA4 alternatives, cost analysis, and migration guides.
-
 MarTech
11 Best Data Governance Tools for 2026 (Comparison + Implementation Guide)
Compare the top data governance tools for 2026: Collibra, Atlan, Purview, and more. Features, pricing, implementation timelines, and failure patterns to avoid.
-
 Analytics
The Ultimate Guide to Funnel Tracking Tools (2026 Review)
Discover the best funnel tracking tools for 2026. Our comprehensive review covers platforms like HubSpot, Google Analytics, and Improvado to help you fix leaks, optimize conversions, and maximize your marketing ROI.
-
 Performance
Cookieless Attribution: Methods, Accuracy Benchmarks, and Implementation Roadmap (2026)
Master cookieless attribution with server-side tracking, identity graphs, and fingerprinting. Accuracy ranges: 50-85%. Implementation roadmap + diagnostic tools.
-
 Analytics
The Ultimate Guide to Email Marketing Metrics for 2026
Master the 20+ key email marketing metrics you must track for success. This guide covers everything from open rates to LTV, helping you optimize campaigns, prove ROI, and drive real business growth with data.
-
.png) MarTech
MarTech17 Best Digital Analytics Tools for Marketing Analysts in 2026
Compare 17 digital analytics tools across 4 categories: market leaders, product analytics, privacy-first open-source, and DIY stacks. TCO, migration costs, team requirements.

-
 Analytics
YouTube Analytics Advanced Mode: Complete Guide for Marketing Analysts (2026)
Master YouTube Analytics Advanced Mode in 2026. Learn configuration, filtering, predictive metrics, and when Advanced Mode misleads—with diagnostic workflows.

-
 Analytics
What is Data Normalization? A Complete Guide for 2026
Learn the essential data normalization techniques to improve data integrity, reduce redundancy, and eliminate anomalies. This guide explains the methods and tools you need.
-
 Performance
How to Become a Marketing Analyst: The Complete Career Guide
Explore the role of a marketing analyst. Learn about the key responsibilities, essential skills, career path, average salary, and the steps to become a successful marketing analyst in 2026.

-
 MarTech
What Is a Modern Data Stack? Key Components, Benefits & Future Trends
Discover how a modern data tooling stack boosts integration, analytics, and decision-making for scalable, efficient data-driven growth and future-ready strategy
-
 MarTech
Google Ads Management: How to Optimize, Scale, and Maintain ROI in 2026
Complete Google Ads management framework for 2026: bidding strategies, AI Max controls, data quality requirements, and cross-account governance at scale.
-
 Performance
Media Planning: Complete Guide to Strategy, Process & Best Practices 2026
Learn how media planning strategy works, the 5 Ms framework, a 10-step process, and real budget examples to plan, schedule, and measure ad campaigns.

-
.png) Analytics
AnalyticsEcommerce Analytics Best Practices for Marketing Analysts (2026)
Master ecommerce analytics with diagnostic frameworks, benchmarks, and returns workflows. Cut data reconciliation time 30%+ with proven strategies.

-
 MarTech
DV360: The Ultimate Guide to Google's Programmatic Powerhouse
Master Google's DV360 with our ultimate guide. Learn about advanced targeting, campaign management, programmatic buying, and how to measure true ROI by unifying data across all your marketing platforms.
-
 Big Data
Marketing Data Cleansing: Best Practices & Tools 2026
Learn how to clean marketing data for accurate analytics. Discover 2026’s best data cleansing tools and see how Improvado automates data quality at scale.
-
 Big Data
Marketing Data Cleansing: The Ultimate Guide to Best Practices & Tools in 2026
Master marketing data cleansing in 2026. Learn best practices, tools, and a step-by-step process to fix dirty data, improve data quality, and drive accurate analytics. See how Improvado automates data cleansing for maximum ROI.
-
 Analytics
17 Best Digital PR Tools and Software for 2026
Compare Meltwater, Cision, Muck Rack, and 14 more digital PR platforms. Real pricing, failure cases, and migration costs from 50+ vendor audits.
-
.png)
Publisher Media Kits: 30 Examples for Digital Advertising
Discover 30 media kit examples from top publishers to craft compelling kits that boost digital advertising reach and drive scalable results in 2026.
-
 MarTech
DV360 Optimization: A Complete Guide to Campaign Strategy
Master DV360 optimization with expert strategies for bidding, targeting, and creative. Learn best practices to improve campaign performance, boost CTR, and maximize your programmatic ROI in 2026.
-
 Analytics
How to Improve Your PPC ROAS: 2026 Guide for Marketing Analysts
Proven strategies to improve PPC ROAS in 2026. Includes benchmarks for 20+ industries, attribution models, diagnostic frameworks, and automation techniques.

-
 MarTech
MediaMath by Infillion: The Definitive Guide to the Programmatic DSP (2026)
Explore the complete story of MediaMath's programmatic advertising platform, from its pioneering DSP technology to its bankruptcy and rebirth under Infillion. Learn how the MediaMath ad tech platform operates in 2026.
-
![Content Marketing Analytics: Best Tools & Tactics [2026]](https://improvado.io/5a1eb87c9afe1000014a4c7d/69fc9d5d83aab784b007ba71_69fc9d5bfa942b98b57ce833_og-content-marketing-analytics-tools.png) Analytics
Analytics15 Content Marketing Analytics Tools for Marketing Analysts in 2026
Compare 15 content marketing analytics platforms—from free (GA4) to enterprise (Improvado)—with decision matrices, pricing, and implementation timelines.

-
 Analytics
The Ultimate Guide to Amazon DSP Advertising in 2026
Unlock the power of Amazon DSP advertising. Our 2026 guide covers targeting, ad types, metrics, and strategies to programmatically reach new audiences on and off Amazon, driving massive ROI for your brand.
-
 Big Data
How to Build an SEO Dashboard in Looker Studio (2026 Guide)
Build actionable SEO dashboards in Looker Studio (Google Data Studio). Decision frameworks, calculated fields, connector setup, and troubleshooting for 2026.

-
 Performance
The Ultimate Guide to Social Media ROI: How to Measure, Prove & Grow It in 2026
Learn how to track and measure social media ROI with a proven 4-step framework, key metrics, and ROI formulas that turn engagement into real revenue.

-
 MarTech
Retail Media Networks: The Ultimate 2026 Guide
Amazon Ads, Walmart Connect, Target Roundel and 12 more RMNs compared by market share, ROAS benchmarks, minimum spend, API quality, and category fit.
-
 Analytics
Ads Data Hub: Google Ads Data Hub Guide 2026
Discover how Google Ads Data Hub empowers privacy-first analytics to boost campaign insights and maximize ROI with secure, unified data in 2026.
-
 Analytics
Data-Driven Marketing in 2026 - How to Make Better Marketing Decisions with Data
Discover how data driven marketing in 2026 boosts ROI with proven strategies, top tools, and real examples to optimize campaigns and make smarter decisions.
-
 MarTech
LiveRamp: What It Is & Why Marketers Use It 2026
Discover how LiveRamp boosts identity resolution and data onboarding for smarter marketing in 2026. Learn its benefits, limits, and solutions today.
-
.png) Analytics
AnalyticsAdobe Analytics Data Feed: The Complete Guide to Raw Data Export
Learn how to create and manage an Adobe Analytics Data Feed to export raw, unsampled clickstream data. This guide covers setup, best practices, data columns, and how to automate the process for deeper analysis.
-
 MarTech
Top 8 Programmatic Advertising Platforms for Marketing Analysts in 2026
Compare DV360, Trade Desk, Amazon DSP, and 5 more programmatic platforms. Pricing, minimums, tech requirements, and TCO analysis for marketing analysts.
-
 Analytics
Cross-Channel Attribution Guide for Marketing Analysts (2026)
Complete guide to cross-channel attribution: compare 7 tools, choose the right model, avoid 26% budget waste. Includes decision trees and implementation playbooks.
-
 Analytics
15 Best Data Mapping Tools for Marketing Analysts in 2026
Compare 15 data mapping tools for marketing teams. Real benchmarks, failure cases, TCO analysis, and selection criteria for no-code and enterprise platform
-
 Analytics
Social Media Benchmarks by Industry in 2026: TikTok, Instagram, YouTube, Facebook & LinkedIn
2026 social media benchmarks across TikTok, Instagram, YouTube, Facebook, LinkedIn with percentile bands, industry modifiers, and diagnostic frameworks.
-
%2520(1).png) Analytics
AnalyticsThe Ultimate Annual Marketing Report Guide
Build a winning 2026 annual marketing report. Learn what to include, explore key metrics, and use our free templates to prove your marketing ROI and drive data-driven strategy. Unify your marketing data for clearer insights.
-
![Control of Marketing Performance: How to Measure Results [2026]](https://improvado.io/5a1eb87c9afe1000014a4c7d/69fca5065d8bf153497c23c6_69fca503a79927edaf05230e_og-steps-to-measure-marketing-performance.png) Analytics
Analytics7 Steps to Measure Marketing Performance in 2026
Learn how to measure marketing performance with a maturity-based framework, from basic CAC tracking to AI-driven optimization. Includes tools, benchmarks, and red flags.
-
%2520(1).png) MarTech
MarTechClickHouse Pricing 2026: Cloud vs Self-Hosted Cost Comparison
Complete ClickHouse pricing breakdown: Cloud tiers ($67-$100K/mo), self-hosted TCO ($2.4K-$30K/mo), vs Snowflake & Redshift. Compare costs for your workload.
-
 Analytics
Omnichannel Analytics: Implementation Guide for Marketing Analysts (2026)
Build omnichannel analytics that unify every channel into one real-time customer view: costs, breakeven math, and KPI benchmarks for 2026 rollouts.
-
%2520(1).png) Analytics
AnalyticsAnalytics Maturity Model: A 2026 Guide for B2B Marketing Teams
Learn when to advance your analytics maturity—and when to stop. Cost calculators, failure patterns, and readiness checklists for B2B teams.
-
%2520(1).png) Performance
PerformanceBig Data Marketing: Frameworks, Tools, and Real-World ROI (2026)
Big data marketing strategies, readiness diagnostics, and implementation frameworks. Compare top platforms, avoid costly failures, and scale analytics.
-
 Performance
What is User-Centric Analytics? A Modern Approach to Understanding Customers
Shift from outdated sessions to user-centric analytics. This guide covers key metrics, implementation, GA4, and tools to unlock deep user data insights, improve UX, and drive retention.
-
%2520(1).png) Performance
PerformanceWhat Is Predictive Performance Analytics? 8 Best Tools, Use Cases & Implementation Guide (2026)
Predictive performance analytics explained: 8 tools compared, real ROI benchmarks, LSTM vs. matrix factorization models, and implementation checklist for marketers.
-
 Performance
15 Best Data Integration Tools for Marketing Analysts in 2026
Compare the top 15 data integration platforms for marketing analysts. Decision tree, TCO calculator, and real-world benchmarks to find your right tool.
-
 Performance
How to Create a Revenue Chart: A Guide to Visualizing Business Growth
Discover how to create a revenue growth chart to track trends, analyze key metrics, and visualize your business growth for smarter decisions.
-
 Performance
Current Trends in Ecommerce: 2026 Guide
Discover ecommerce trends 2026 to boost sales and engagement with expert insights, AI personalization, and data-driven strategies for measurable growth.
-
 Performance
Automated Marketing Reports: 11 Best Tools for 2026
Compare 11 automated marketing report platforms in 2026. Pricing, integrations, real-world ROI—plus readiness scorecard and hidden cost calculator.
-
 Performance
Top 15 Data Ingestion Tools for Marketing Analysts in 2026
Compare 15 data ingestion tools for marketing analysts. Real TCO breakdowns, connector coverage matrices, and architecture decision frameworks—not vendor fluff.
-
%2520(1).png) Performance
PerformanceData Harmonization: The Ultimate Guide for Marketers in 2026
A complete guide to data harmonization. Learn the definition, steps, techniques, and tools to unify disparate data sources, improve data quality, and unlock powerful marketing insights for better ROI reporting and analytics.
-
%2520(1).png) Performance
PerformanceAttribution Modeling in Google's Campaign Manager 360: Complete Guide for 2026
Master CM360 attribution modeling in 2026. Learn which model fits your business, setup requirements, data thresholds, and how to fix common issues.
-
%252520(1).png) Performance
Performance15 Best Enterprise Marketing Platforms for Marketing Analysts in 2026
Marketing analyst's guide to enterprise marketing platforms: Salesforce, Adobe, HubSpot, Braze, The Trade Desk. TCO models, benchmarks, and selection crite
-
 Big Data
What Is Data Centralization? A Complete Guide
Learn what data centralization is, its benefits, challenges, and steps for success. Build a single source of truth to drive ROI and smarter business decisions.
-
%2520(1).png) Big Data
Big DataThe Ultimate Guide to Tableau Snowflake Integration [2026]
Master Tableau Snowflake integration. This guide covers direct connections, OAuth security, performance tuning, and automated ETL solutions to build real-time dashboards and unlock powerful business insights from your data.
-
%2520(1).png) Performance
PerformanceAdvertising Spending by Industry: 2026 Trends, Benchmarks & Forecasts
2026 advertising spend analysis across 30+ industries. Retail media up 26.1%, CTV $72B, social $227B. Benchmarks, forecasts & ROI data from 117K companies.
-
%2520(1).png) Performance
PerformanceAdvertisers & COVID-19: Improvado Digital Ad Spend Research
Advertisers & COVID-19: Explore Improvado's research on digital ad spend trends, industry impact, and recovery insights during the pandemic.
-
 Analytics
The Ultimate Guide to Web Analytics Integration [2026]
Unlock a 360-degree customer view with our complete guide to web analytics integration. Learn to connect Google Analytics, CRM, ad platforms, and more for truly actionable marketing insights and higher ROI.
-
 Performance
Automated Facebook Ads Reporting: The Definitive Guide to Saving Time & Boosting ROI
Stop wasting hours on manual spreadsheets. Discover how to automate Facebook Ads reporting to track key metrics, optimize performance in real-time, and prove ROI. Get started with the best tools and templates today.
-
.png) Big Data
Big DataHow to Get Answers from Your Data: A Practical Guide
Struggling to get clear data answers? Learn the 5-step process to ask better business questions, perform data analysis, and use data visualization to make smarter decisions. See examples and tools.
-
.png) Performance
PerformanceFull-Funnel Attribution Best Practices for Marketing Analysts (2026)
Full-funnel attribution best practices for marketing analysts: implementation guides, failure modes, model selection, and organizational readiness checklists.
-
 Performance
50 Best Marketing Agencies in Houston (2026 Rankings)
Compare Houston's top digital marketing agencies with verified outcomes, pricing transparency, and red-flag audits from 20 mystery-shopped agency briefs.
-
 Analytics
Top 8 Customer Data Platforms for 2026
Compare the top 8 CDPs for B2B: Salesforce Data Cloud, Hightouch, ActionIQ, Adobe, Segment, Tealium, Treasure Data, Klaviyo. Pricing, deployment, and fit.
-
.png) Analytics
AnalyticsCross-Device Analytics: The Ultimate Guide to Unifying the Customer Journey
Unlock a complete view of your customer journey with cross-device analytics. Learn to track users across devices, improve ad targeting, and accurately measure marketing ROI. Master GA4, Adobe, and more for 2026.
-
 Dashboards
The Ultimate Guide to Data Visualization Techniques
Data visualization techniques turn raw marketing data into clear insights. Learn 25+ methods, from bar charts to Sankey diagrams, and when to use each.
-
 Analytics
Cohort Analysis: A Complete Guide to Reducing Churn and Understanding User Behavior
Learn what cohort analysis is, see real-world examples, and discover how to analyze user behavior to reduce churn, improve customer retention, and make data-driven product decisions.
-
 Analytics
Cluster Analysis for Marketers: The Ultimate Guide (2026)
Master cluster analysis for marketing in 2026. K-means validation, optimal cluster selection, real campaign results, and activation playbooks for customer segmentation.
-
 Analytics
How to Build Your Own Custom Attribution Model in 2026
Learn how to build custom marketing attribution models with Shapley and Markov methods. Includes data requirements, Python code, validation criteria, and implementation timelines.
-
 Performance
The Ultimate Guide to Conversion Funnels: Stages, Analysis & Optimization
Master the conversion funnel from A to Z. Learn the stages, how to track metrics in GA4, and optimize for higher conversions. Unify your marketing data to find leaks and maximize ROI. Your complete guide for 2026.
-
.png) Performance
PerformanceAdvanced Marketing Analytics: An Overview of the Top Techniques in 2026
Master advanced marketing analytics in 2026. Learn MMM, attribution modeling, CLV analysis, and when each technique works—with implementation costs and failure modes.
.jpeg)
-
 MarTech
Google Tag Manager vs Google Analytics: The Definitive 2026 Guide
Learn the key differences between Google Tag Manager vs Google Analytics. This guide explains how GTM and GA4 work together to improve your data collection, streamline tracking, and power your marketing analytics strategy.
-
 MarTech
How to Audit Google Analytics: Complete Guide for Marketing Analysts (2026)
Audit GA4 in 10-15 hours using our 4-layer framework: implementation, data integrity, measurement alignment, and privacy compliance checks for 2026.
-
 Performance
The Ultimate Guide to Marketing Reports [Ready-to-Use Templates]
Discover how to create effective marketing reports with essential KPIs and ready-to-use templates to save time and prove your campaign’s ROI.
.jpeg)
-
 Performance
Data Preparation: The Definitive Guide to a Flawless Analytics Foundation
Master the complete data preparation process. This guide covers the essential steps, tools, and best practices for transforming raw data into high-quality, analysis-ready insights for BI, machine learning, and marketing analytics.
-
 Big Data
ETL (Extract, Transform, Load): A Guide for Marketing and Analytics Teams
Learn about ETL (extract, transform, load) for marketing analytics, as well as ETL vs ELT, reverse ETL, pipelines, and more from Improvado.
-
 Performance
Marketing Analytics: The Ultimate Guide for 2026
Discover marketing analytics strategies, tools, and best practices to boost ROI and master data-driven campaigns in 2026 for lasting success.
-
 Performance
B2B Marketing Attribution in 2026: The Complete Guide to Multi-Touch, MMM, and Method Stacking
Complete 2026 guide to B2B attribution: multi-touch models, MMM, incrementality testing, platform comparison, and implementation roadmap for marketing analysts.
-
 Performance
Predictive Analytics Tools: Top 10 for Marketing 2026
Compare 10 predictive analytics tools and software solutions for marketers: accuracy benchmarks, data thresholds, and real cost of ownership for 2026.
-
 Performance
10 Best Prescriptive Analytics Tools in 2026: Expert Comparison
Compare the top 10 prescriptive analytics tools for 2026. Expert analysis of optimization engines, constraint modeling, and automated decision capabilities.
-
 Analytics
12 Best Marketing Dashboard Examples & Templates for 2026
Real marketing dashboard examples with screenshots, KPI formulas, and templates. See what works, what fails, and how to build dashboards stakeholders actually use.
-
 Performance
Best Agency Management Software for Marketing Agencies in 2026
Compare 14 agency management platforms with pricing, integration failure patterns, TCO models, and maturity frameworks to prevent the 60% year-one failure
-
 Performance
Pinterest Advertising: Step-by-Step Guide 2026
Discover how to master Pinterest ads in 2026 with our step-by-step guide, featuring top strategies, latest formats, and tips to boost your campaign ROI.
-
 Performance
Pinterest Marketing: Complete Guide to Grow Your Business in 2026
Learn how to use Pinterest for business growth in 2026. Discover strategies, tools, and analytics tips to drive traffic, boost sales, and measure ROI.
-
.png) Analytics
AnalyticsSisense Partners with Improvado to Empower Marketing Analytics Leaders
Improvado joins Sisense's Data Connector Partnership, empowering marketers to simplify complex data and transform it into powerful analytic apps.
-
 Analytics
Top 25 Best Database Management Software for Marketing Analysts in 2026
Compare 25 database management platforms and programs by TCO, migration risk, and performance limits, including PostgreSQL, MongoDB, and Snowflake.
-
 MarTech
Top 10 API Management Tools in 2026: Comparison, Pricing & Selection Framework
Compare the top API management platforms in 2026. Real TCO analysis, performance benchmarks, migration guides, and selection framework. Find the right tool.
-
![Best Lead Management Software: Top Solutions [2026]](https://improvado.io/5a1eb87c9afe1000014a4c7d/69fc9ee94468d8fc64eb0506_69fc9ee64468d8fc64eb0350_og-the-best-lead-management-software.png) Performance
Performance11 Best Lead Management Software Solutions for 2026
Compare 11 top lead management platforms: Cal.com, HubSpot, Salesforce, Zoho CRM, and more. Updated 2026 pricing, features, and integration guides.
-
 Performance
Top Data Analysis Software & Tools
Compare the top data analysis software for marketing teams. Decision frameworks, TCO breakdowns, and implementation benchmarks-no fluff.
-
 Performance
Whatagraph Alternatives: Top 7 Competitors 2026
Discover the top 7 Whatagraph alternatives for 2026. Compare features, pricing, and integrations to find the best reporting tool for your needs.
-
 MarTech
Best Dashboard Software: A Complete Guide for 2026
Discover the best dashboard software for your business in 2026. Compare top tools to enhance data visualization, make smart data decisions, and build a powerful business intelligence platform.
-
 Performance
15 Best WordStream Alternatives & Competitors in 2026
Compare top WordStream alternatives: Ryze AI, Optmyzr, PPC.io, Improvado. Find the right PPC management tool for your budget and platform needs.
-
![What is a Data Pipeline? Types, Tools, & Best Practices [2026]](https://improvado.io/5a1eb87c9afe1000014a4c7d/69fbafb7b6066dd23092e760_69fbafb2e7dac97fa5093d65_og-what-is-a-data-pipeline.png) Performance
PerformanceWhat is a Data Pipeline? A Complete Guide to How They Work
A data pipeline automates moving data from source to destination. Learn the 6 stages, ETL vs. ELT, 4 pipeline types, and top tools for 2026.
-
 Performance
MarkLogic Alternatives and Competitors in 2026: Database Selection Guide
Compare MarkLogic vs MongoDB, Neo4j, Cosmos DB, PostgreSQL & more. Database selection guide with TCO models, migration failures, technical audit checklists.
-
 Performance
13 Best Klipfolio Alternatives for Analytics & Reporting [2026]
Explore the top alternatives to Klipfolio in 2026 – compare pricing, integrations, dashboard capabilities, agency-friendly features, BI tools & data connectors.
-
 Performance
Grow vs Improvado: Grow Alternatives & Competitors 2026
Grow vs Improvado: Compare Grow alternatives and competitors for data integration, analytics, and marketing automation in 2026.
-
%2520(1).png) Performance
Performance10 Best Domo Alternatives and Competitors for Marketing Teams in 2026
Compare the top 10 Domo alternatives for marketing teams. Side-by-side pricing, connector reliability, migration complexity, and real TCO analysis.
-
![Cyfe Alternatives: Best BI Tools for Marketing [2026]](https://improvado.io/5a1eb87c9afe1000014a4c7d/69fca77dae45794d2dc62d08_69fca77b8cd86a75018a3799_og-cyfe-alternatives-and-competitors.png) Performance
PerformanceCyfe Alternatives: Top 6 BI Tools 2026
Cyfe alternatives: Compare the top 6 BI tools to visualize sales and marketing data for better business decisions in 2026.
-
 Performance
Top Blendo Alternatives and Competitors in 2026: Migration Guide for Former Users
Blendo shut down in 2019 after RudderStack acquisition. Compare 6 proven alternatives for marketing data integration: pricing, features, migration paths.
-
 Performance
What Is UTM Tracking? A Complete Guide to Using UTM Parameters
Discover how UTMs improve campaign tracking with this complete guide on creating codes, naming standards, and mastering GA4 reporting for better marketing investments
-
 Analytics
11 Best Data Analysis Tools for Marketing Analysts in 2026
Compare the top data analysis tools for marketing teams in 2026. Decision matrix, performance benchmarks, and TCO analysis for Power BI, Tableau, and more.
-
![Best ETL Tools: Top Data Integration Platforms [2026]](https://improvado.io/5a1eb87c9afe1000014a4c7d/69fca2f334ed137985a46082_69fca2f0baa0a89ef319f18f_og-best-etl-tools-software.png) Performance
PerformanceETL Tools: Best Software for 2026
ETL tools for 2026: Compare top platforms like Informatica, Talend, and AWS Glue. Streamline your data workflows and integration.
-
 Analytics
Origami Logic Alternatives and Competitors in 2026: Migration Guide for Stranded Users
Origami Logic was sunset by Intuit in 2019. Compare Improvado, Funnel.io, and Adverity—feature parity, pricing, and migration guides for stranded users.
-
 Performance
The 11 Best API Integration Platforms in 2026
Compare top API integration platforms for marketing teams: pricing, migration costs, failure modes, and real implementation timelines from Improvado to Workato.
-
 Performance
What is Data Aggregation? Complete Guide to Process, Benefits & Tools 2026
Learn how data aggregation transforms raw data into actionable insights. This 2026 guide explains the data aggregation process, types, benefits, challenges, and the best tools for building unified, analytics-ready datasets across all your business systems.
-
 Performance
The Ultimate Guide to Data Warehouse Solutions (2026)
Explore the best data warehouse solutions of 2026. Compare cloud platforms like Snowflake, BigQuery, and Redshift to power your business intelligence and data management.
-
 Analytics
15 Best Data Preparation Tools for Marketing Analysts in 2026
Compare 15 data preparation tools for marketing analysts: pricing, integration depth, learning curves, and TCO. Find the right fit for your team size and data volume.
-
 Analytics
5 Best Data Extraction Tools for Marketing Analysts in 2026
Compare the top 5 data extraction tools for marketing teams: pricing, connector counts, performance limits, and failure scenarios. Find your fit.
-
 Performance
The Ultimate Guide to Supermetrics Alternatives in 2026
Struggling with Supermetrics? Compare the top 10 alternatives on pricing, integrations, and data transformation to find the right platform.
-
 MarTech
Top 10 Fivetran Alternatives & Competitors in 2026
Compare the top 10 Fivetran alternatives and competitors for 2026: honest rankings, pricing breakdowns, migration risks, and which tool fits your team.
-
 Performance
13 Best TapClicks Alternatives & Competitors in 2026
Compare 13 TapClicks alternatives for marketing analytics. Find the right platform based on team size, technical resources, and data volume needs.
-
.png) Performance
Performance22 Best Competitive Intelligence Companies & Tools in 2026
Compare 22 competitive intelligence companies for marketing analysts: Crayon, Klue, AlphaSense, and more. Pricing, features, and when each tool fits.
-
 Performance
Looker vs Tableau for Marketing Analysts: 2026 Comparison
Compare Looker vs Tableau for marketing analytics in 2026. TCO breakdowns, migration costs, team size thresholds, and failure scenarios to make the right choice.
-
 MarTech
Funnel.io Alternatives: 9 Tools for Marketing Data Teams
Compare Funnel.io alternatives for marketing data teams. See how Improvado, Supermetrics, Adverity, Fivetran, and other tools handle reporting.
-
 MarTech
13 Best Adverity Alternatives & Competitors in 2026
Compare 13 Adverity alternatives based on team size, technical capability, data volume, and budget. Includes migration complexity, hidden costs, and feature gaps.
-
.png) Performance
PerformanceSalesforce Marketing Cloud Intelligence Alternatives: Top 5 Platforms Compared (2026)
Compare Improvado, Adverity, TapClicks, Supermetrics & Funnel vs Salesforce Marketing Cloud Intelligence. TCO, migration costs & decision framework.
-
 Dashboards
23 Best Data Visualization Tools for Marketing Analysts in 2026
Compare 23 data visualization tools ranked for marketing analysts: decision trees, TCO analysis, and failure cases, not just feature lists.
-
![Advertising Agencies North Carolina: Top Firms [2026]](https://improvado.io/5a1eb87c9afe1000014a4c7d/69fca31fa79927edaf040b44_69fca31b27c2321f3d4639d4_og-top-marketing-agencies-in-north-carolina.png) Performance
PerformanceMarketing Agencies North Carolina: Best List for 2026
Marketing agencies in North Carolina: Discover the best digital, PR, and SEO agencies to help your business grow in 2026.
-
 Performance
Marketing Agencies Boston: Top SEO, SMM & PR 2026
Discover the top digital marketing agency Boston for 2026. Learn how to choose the best SEO, SMM, and PR partner to boost your brand and drive results.
-
 Performance
Marketing Agencies Ohio: Best List for 2026
Discover the top digital marketing companies in Ohio for 2026 to boost your business growth and success with expert marketing support.
-
 Performance
Marketing Agencies Arizona: Best List for 2026
Compare the top digital marketing agencies in Phoenix and across Arizona for 2026, ranked by services, notable clients, pricing, and specialties.
-
 Performance
Marketing Agencies Virginia: Best List for 2026
Discover top marketing agencies in Virginia for 2026 to boost your business growth with expert strategies and tailored solutions. Get the best fit today.
-
 Performance
Marketing Agencies Atlanta: Best 25 for 2026
See the top 25 marketing agencies in Atlanta for 2026, compare SEO, advertising, digital, social, and PR firms to find the right partner for your business.
-
 Performance
Marketing Agencies Chicago: Top SEO, SMM & PR 2026
Discover the top digital marketing agency Chicago in 2026. Compare SEO, SMM, and PR experts to boost your brand’s growth and choose the best fit for success.
-
 Performance
Marketing Agencies Florida: Best List for 2026
Discover the top marketing agency options in Florida for 2026. Compare expert SEO, SMM, and PR services to boost your business growth effectively.
-
 Performance
Top 16 Marketing Agencies in NYC (2026): Pricing, Specializations & Selection Guide
Compare NYC's top 16 marketing agencies by pricing, specialization, and fit. See real retainer ranges, agency profiles, and a vetting framework for 2026.
-
 Performance
Marketing Optimization: The 2026 Playbook for Lower CAC and Higher ROAS
Master marketing optimization in 2026. This guide covers strategies for SEO, PPC, and social media, leveraging AI, data analytics, and automation to slash acquisition costs and prove ROI. Unlock scalable growth with our proven framework.
-
 Performance
How to Measure Marketing ROI: The Ultimate Calculation Guide
A complete framework for marketing ROI measurement, core formulas, essential KPIs, and channel-by-channel calculations, plus fixes for common data silos.
-
 Performance
Marketing Agencies Los Angeles: Top 52 for 2026
51 LA marketing agencies ranked by budget fit, specialization, and disclosed results. Pricing benchmarks, decision matrix, and red flags included.
-
 MarTech
24 Best Marketing Analytics Tools in 2026: Ranked by Data Teams
Compare 24 marketing analytics platforms by connector reliability, TCO, and team fit. See which architecture matches your data volume (10 vs 50+ sources).
-
 Performance
Marketing Agencies San Francisco: Top 63 for 2026
Discover and compare the top 63 marketing agencies in San Francisco for 2026 to find expert SEO, advertising, and digital marketing solutions that drive growth.
-
.jpeg) Performance
PerformanceMedia Math Cheat Sheet: Digital Metrics Guide 2026
Discover the Media Math Cheat Sheet to master CPM, CPC, CPA, CTR, CR, and ROI formulas for accurate campaign performance and better ROI in 2026.
-
 Performance
Battle of Video: Facebook vs. YouTube Ads
What works better Facebook video ads or YouTube ads? We review both platforms and ads' performance to come to a data-driven conclusion.

No posts match your filters.