![Ad Spend Tracking: The Ultimate Guide to Optimize ROI [2026]](https://improvado.io/5a1eb87c9afe1000014a4c7d/69fca03e409501a4d2b419a5_69fca03bdc353261c23e07a0_og-effective-ad-spend-monitoring.png)
Most marketers check their ad spend numbers first thing in the morning, and there is a good reason for that.
Without careful monitoring, ad spending can quickly become a problem for campaign optimization. Spend too fast, and you risk burning your budget before gathering enough data to optimize. Spend too slowly, and you miss critical opportunities and have unused funds left.
This guide provides a comprehensive roadmap for mastering ad spend tracking. We'll cover everything from basic platform metrics to advanced automated systems. You'll learn the strategies, tools, and best practices to gain full control over your advertising budget and drive real business growth.
Key Takeaways:
- Definition: Ad spend tracking is the systematic process of monitoring, analyzing, and managing your advertising budget across all channels to maximize efficiency and ROI.
- Importance: Without it, you risk budget waste, missed opportunities, and an inability to prove marketing's value. Effective tracking directly links ad spend to revenue.
- Core metrics: Focus on a blend of metrics like CPC, CPA, and ROAS. ROAS (Return on Ad Spend) is the ultimate measure of campaign profitability.
- Maturity levels: Teams evolve from basic in-platform tools and manual spreadsheets to sophisticated, automated data platforms that provide real-time, cross-channel insights.
- The solution: Automation is key. Unified data platforms like Improvado eliminate manual work, reduce errors, and provide the comprehensive view needed for strategic decision-making.
Quick answer
Ad spend monitoring is the systematic process of tracking and analyzing advertising budgets across all channels to ensure efficient use and maximize ROI. It involves checking daily spend, key metrics like CPC, CPA, and ROAS, and spotting inefficiencies to reallocate budgets to high-performing campaigns. Without it, you risk budget waste, overspending, or missed opportunities.
What Is Ad Spend Tracking? And Why It’s Critical for ROI
An advertising budget is the amount of money a business allocates to promote products and services across different channels. Ad spend monitoring involves tracking and analyzing advertising budgets to ensure they’re used effectively. It helps you spot inefficiencies and reallocate budgets to high-performing ad campaigns.
Ad Spend Tracking vs. Budget Pacing: A Clear Distinction
When managing advertising campaigns, two critical aspects of budget management come into play: ad spend tracking and budget pacing. Both are essential for effective budget management. However, they serve different functions.
Budget pacing is about distributing your budget evenly over a specific period. For example, if you have a $30,000 monthly budget, pacing ensures you spend roughly $1,000 per day.
Ad spend tracking verifies that your pacing is on track. It tells you the actual amount spent each day. If your tracking shows you spent $1,500 yesterday, you know your pacing is off. You can then adjust bids or daily caps to get back on course.
Pacing sets the plan; tracking measures reality.
Core Metrics: What to Track for Maximum Impact
Ad spend monitoring requires keeping an eye on key performance metrics to ensure your budget is being utilized efficiently. Here are the top metrics to track at each stage of the marketing funnel.
Top-of-Funnel Metrics (CPM, CPV, Impressions)
These metrics measure awareness and reach. They tell you how many people are seeing your ads.
- Impressions: The total number of times your ad was displayed.
- Cost Per Mille (CPM): The cost to generate 1,000 impressions. It's a standard measure of advertising cost-efficiency.
- Cost Per View (CPV): For video ads, this is the cost for a single video view. It helps gauge engagement with your video content.
Engagement Metrics (CTR, CPC)
These metrics show how well your ads resonate with your audience. They indicate if your creative and messaging are compelling.
- Click-Through Rate (CTR): The percentage of impressions that result in a click. A high CTR suggests your ad is relevant and appealing.
- Cost Per Click (CPC): The amount you pay for each click on your ad. Monitoring CPC is crucial for managing budget efficiency.
Performance & Conversion Metrics (Conversion Rate, CPA)
This is where ad spend starts turning into business results. These metrics measure the actions that matter most.
- Conversion Rate: The percentage of clicks that result in a desired action (for example, a sale, a lead, a sign-up).
- Cost Per Acquisition (CPA): Also known as Cost Per Action, this is the total cost to acquire one customer or lead. It's a critical indicator of profitability.
The Ultimate Metric: Return on Ad Spend (ROAS)
ROAS is the most important metric for any paid advertising campaign. It measures the gross revenue generated for every dollar spent on advertising.
The formula is simple: (Revenue from Ads / Cost of Ads).
A ROAS of 4:1 means you earn $4 for every $1 you spend. Tracking ROAS ensures your campaigns are not just active, but profitable.
The Four Levels of Ad Spend Tracking Maturity
Depending on the scale of your campaigns, the tools and strategies you use can vary significantly. Here are several methods to monitor ad spend, starting with the easiest and moving toward more advanced solutions.
Level 1: Basic In-Platform Tracking
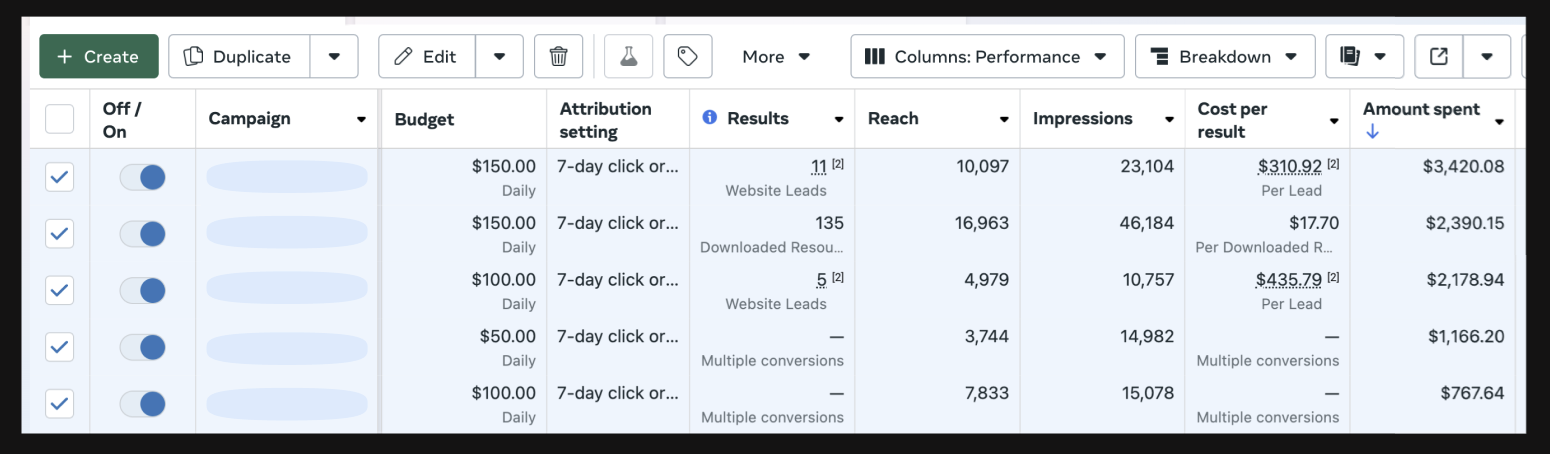
This is the starting point for most businesses. Marketers log into individual ad platforms like Google Ads, Meta Ads, or LinkedIn Campaign Manager. They check daily spend and basic performance metrics directly within each tool.
This method is free and requires no special setup.
If campaigns are running smoothly, and there’s no overspending, they can confidently move on to other priorities. This serves as a quick health check without the need to dive into a deeper analysis.
However, it quickly becomes cumbersome. You get no consolidated view. To understand total spend, you have to add up numbers from each platform manually. It's fine for a single-channel startup but breaks down as soon as you advertise in more than one place.
Pros:
- One of the biggest advantages of using platform-native analytics is that they’re free, as these tools are already built into advertising platforms. It’s ideal for small businesses and startups.
- Another benefit is the simplicity of setup. Most marketers can dive right in without any special expertise—just log into the platform, and you’re ready to track your campaigns.
- Additionally, platform-native tools ensure high data accuracy since they sync directly with the platform. This eliminates discrepancies across different data views.
Cons:
- As your ad operations grow, managing multiple campaigns or accounts across platforms becomes increasingly complex.
- Another downside is the lack of data consolidation. For example, if you’re running campaigns on Google and Facebook, you need to check each platform separately and manually combine data to get a full picture.
- Finally, these tools are excellent for basic maintenance, but to conduct more sophisticated reporting, marketers usually have to export the data into tools like Excel and manipulate it further. So, as your campaigns become more complex, you’ll likely need to explore more advanced solutions.
Level 2: Manual Consolidation with Spreadsheets
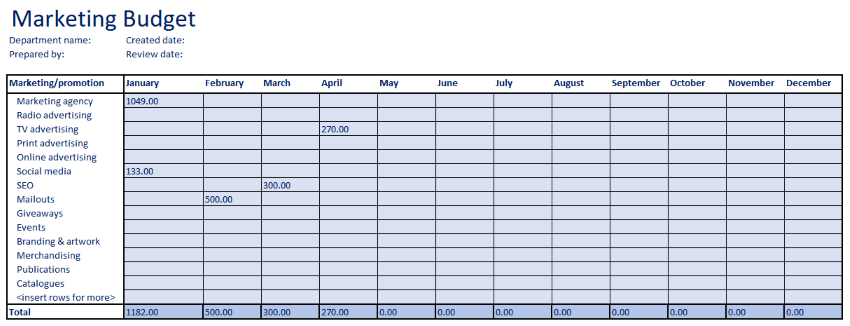
The next step is to use spreadsheets like Google Sheets or Excel. Marketers export CSV files from each ad platform. They then manually copy and paste the data into a master spreadsheet. This allows for a consolidated view of total ad spend and performance across channels.
While more comprehensive, this method is incredibly time-consuming and error-prone.
Data entry mistakes are common. Normalizing data from different platforms (for example, normalizing naming conventions) is a constant headache. A significant amount of time is spent on data wrangling instead of analysis.
Pros:
- One of the biggest advantages of spreadsheets is their flexibility. You can structure and organize your data exactly how you need it and combine data into a single, easy-to-read report.
- Plus, most teams already have access to spreadsheet tools like Google Sheets or Excel, so there’s no need for additional investment.
Cons:
- The main drawback of this approach is that spreadsheets don’t update data automatically. Marketers have to manually gather and enter data from each platform.
- It also requires significant effort to normalize data from individual platforms before analyzing can actually begin. This can become a huge resource drain, especially for teams managing multiple campaigns or accounts.
- Spreadsheets also require constant maintenance. Someone should regularly check data and formulas. Even small errors, like a data entry mistake or a miscalculation, can distort results and lead to wrong insights.
“Some marketing tools, like HubSpot, also offer built-in reporting capabilities. However, these reports may have limited flexibility.
For instance, in a pre-built HubSpot report, the only customizable option might be the date range. If you need a detailed breakdown by day or channel in a table format, you’d likely have to create separate reports from scratch.
While customizations are possible, you may end up paying a small fortune to achieve those. In many cases, it’s more cost-effective and flexible to use a dedicated data integration tool like Improvado from the start. It provides you with robust multi-platform data extraction, reporting, and analytics.”

Level 3: Automated Dashboards and BI Tools
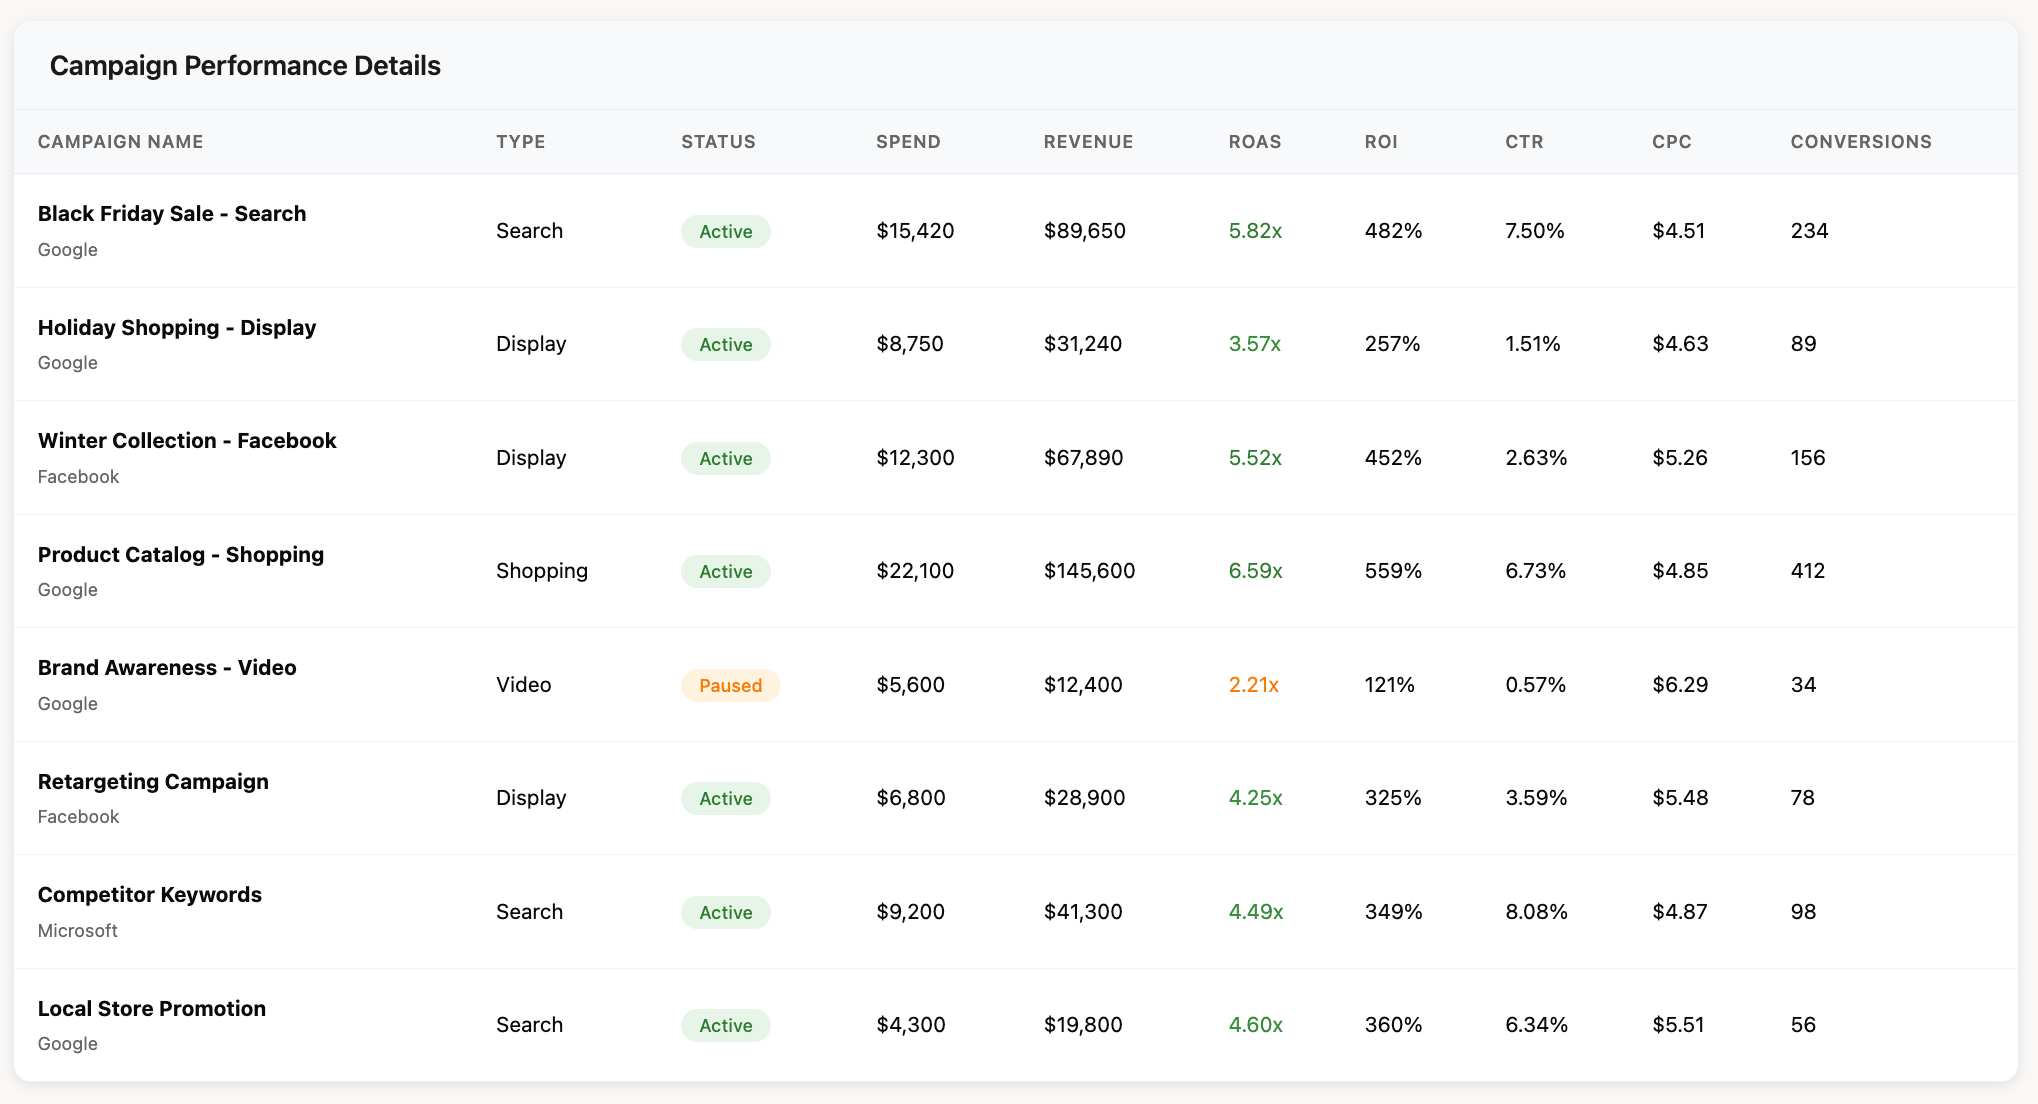
This level represents a significant leap in efficiency. Businesses use business intelligence (BI) tools like Tableau, Power BI, or Looker Studio. These tools connect to ad platforms via APIs to pull data automatically. The data is then visualized in interactive dashboards.
This eliminates most of the manual work of Level 2. Marketers get near-real-time data without exporting CSVs.
However, managing API connections can be complex. You might still need a data engineer to set up and maintain the data pipelines. Furthermore, the data from different sources still needs to be cleaned and blended, which requires expertise.
Effective reporting automation is crucial at this stage to ensure data is timely and accurate.
Pros:
- Automating data collection eliminates the need for time-consuming manual processes, such as exporting and consolidating data from multiple platforms. This allows marketing teams to focus on analysis and decision-making.
- Another benefit is gaining a holistic view of ad performance. Dashboards consolidate data from various platforms into a single interface, making it easy to compare metrics like ROAS, daily spend, or campaign conversion rates. This allows you to adjust strategies quickly and become more effective.
Cons:
- Setting up automated dashboards requires technical and analytical expertise to solve tasks such as integrating APIs and configuring reports. So, the initial setup process can be both time-intensive and resource-intensive.
- Ongoing maintenance is also necessary, as changes in platforms, APIs, or reporting structures may require updates to the integration.
- You’ll also need to solve the challenge of cleaning and normalizing data. To simplify data extraction processes, you can use internal resources and tools like Zapier or opt for specialized platforms (we’ll discuss them in a minute).
- Another factor is cost. BI tools often have subscription fees, and custom dashboards may require additional resources to develop and maintain.
Level 4: The Gold Standard – Fully Automated Data Pipelines
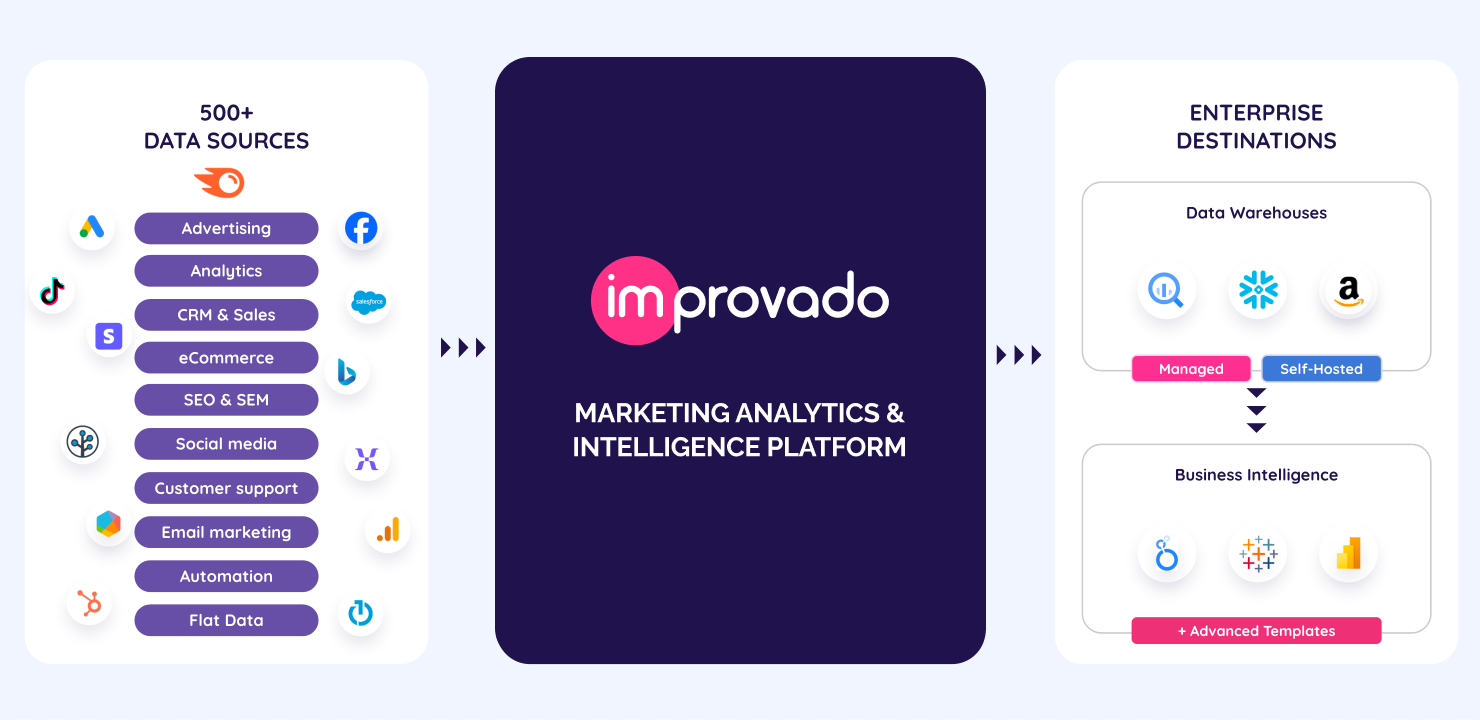
At the most advanced level, companies use fully automated marketing data platforms like Improvado.
These systems handle the entire data journey. They automatically extract data from hundreds of marketing sources. They clean, normalize, and map the data into a consistent model.
This unified data is then loaded into a central repository, often a data warehouse like BigQuery or Snowflake. From there, it can be seamlessly fed into any BI tool or analytics application.
This approach provides a single source of truth for all marketing data. It offers unmatched scalability, accuracy, and speed, freeing up the marketing team to focus purely on strategy and optimization.
Booyah Advertising migrating more than 600 reports from a legacy provider to Improvado. With this transition, the agency achieved 99.9% data accuracy and cut their daily budget-tracking update time by 50%.
With the automated pipelines and unified data models provided by Improvado, the team no longer needs manual reconciliation. Instead of spending hours manually aggregating and comparing platform reports, they now get reliable, up-to-date spend and performance data in 10–30 minutes, enabling faster, data-driven budget decisions across 100+ clients.
“If we don't trust the data, the agency won’t trust the reports and won't give them to the client. They’ll start pulling data manually to Excel and spend a lot of time comparing platform numbers to reports. With Improvado, we now trust the data. If anything is wrong, it’s how someone on the team is viewing it, not the data itself. It’s 99.9% accurate.”

Pros:
- Marketers and analysts no longer need to log into multiple platforms, export data, or manually adjust reports. Everything is automated, allowing teams to focus on high-level strategy rather than day-to-day reporting.
- Another benefit is accuracy and consistency. Data normalization ensures that metrics like conversion rates are comparable across platforms, eliminating discrepancies.
- Predictive insights set this level apart. With tools like AI-driven modeling, businesses can forecast outcomes and proactively reallocate budgets for better results.
Cons:
- Implementing such a system requires upfront investment. From subscription fees to technical expertise for setup and maintenance, the initial costs can start in tens of thousands of dollars. However, the return on investment often justifies the expense for businesses managing millions in ad spend.
Choosing Your Ad Spend Tracker: A Comparative Analysis
Selecting the right method for tracking ad spend depends on your team's size, budget, and complexity. Each approach has its own set of trade-offs. This table breaks down the key differences to help you make an informed decision.
| Aspect | Platform-Native Tools | Manual Spreadsheets | BI Tools with APIs | Unified Data Platform (Improvado) |
|---|---|---|---|---|
| Data Accuracy | High (for that platform) | Low (risk of human error) | High (if APIs are stable) | Very High (managed pipeline) |
| Speed of Insight | Real-time (platform-specific) | Very Slow (days or weeks) | Near Real-time | Real-time |
| Scalability | Very Low | Low | Medium | Very High |
| Manual Effort | Low (per platform) | Very High | Medium (setup/maintenance) | Very Low |
| Cross-Channel View | None | Yes (but manual) | Yes (requires blending) | Yes (fully integrated) |
| Cost | Free | Low (software cost) | Medium (BI licenses) | High (subscription fee) |
| Technical Skill | Low | Medium (spreadsheet formulas) | High (data engineering) | Low (managed service) |
| Best For | Small businesses, one channel | Small teams, 2-3 channels | Mid-size teams with data analysts | Growing/Enterprise teams, agencies |
Common Challenges in Ad Spend Tracking (And How to Solve Them)
Aside from the “hardware” part of ad spend tracking, there are also challenges related to the finance part. Here are some tricky aspects drawn from real-world scenarios:
1. Platform-specific ad spending behavior
Every advertising platform has unique ad budget spending behaviors that can influence your campaign’s performance.
Google Ads uses a monthly budget pacing system. Even if you set a daily limit, the platform adjusts spending dynamically to optimize for performance. For instance, if your daily limit is $100, Google might spend $150 on a day with higher conversion potential and compensate by reducing spending on less active days.
Imagine running a campaign from December 16th to 18th. On the 16th, Google may spend more money in a single day if it believes that those clicks are more likely to result in a target conversion. As a result, it spent $250 instead of the $200 daily limit. While this extra spend boosts performance, it reduces flexibility for the rest of the month.
Facebook takes a more rigid approach to budget pacing. When you set a specific budget for a campaign—like $3,000 for a month—the platform ensures that you don’t spend a cent more.
LinkedIn’s ad platform provides marketers with a more predictable experience. However, its lack of sophistication can limit efficiency in budget utilization.
2. Ad spending strategy depends on your advertising scale
Your business size and advertising operations' scale directly impact how you manage and track ad spend.
For smaller businesses, ad budgets are often limited and less predictable. Marketers frequently need to adapt to sudden changes in funding or priorities, making agility a critical factor in their ad spending strategy.
Let’s see an example:
A small business allocates $40,000 for quarterly ad spend but receives an unexpected $10,000 boost in December. While having extra funds might seem beneficial, rushing to spend this additional budget ASAP can backfire. Spending more money in a short time is likely to raise the cost per conversion instead of the number of conversions.
Instead of using the entire boost right away, it’s better to plan for a gradual budget increase. This approach will lead to better long-term results.
Enterprises typically operate on fixed annual budgets planned months in advance, leaving little room for mid-year adjustments. In this scenario, the performance of particular campaigns often recedes into the background, while missing spend targets or overspending on a specific product can disrupt long-term planning.
“Enterprises should use advanced tools like BI dashboards or integrated platforms that centralize data from multiple sources. Regular budget reviews and checkpoints (e.g., quarterly or monthly) can help align spending with performance goals, minimizing end-of-year financial surprises.”
3. Misalignment between platform metrics and financial reporting
One of the most overlooked challenges is the disconnect between ad platform metrics and financial accounting. Platforms may report spending differently than what appears in financial documents.
Ad platforms like Google and Facebook provide real-time spend data ideal for campaign monitoring and optimization. However, this data does not always match the actual amounts deducted from your budget, which can cause discrepancies in tracking.
For instance, your finance department might report spending $45,000 on Google Ads for the quarter, but your campaign dashboard only shows $40,000. These discrepancies typically arise from timing differences, such as late payments, refunds, or adjustments. While daily data might look inconsistent, reviewing weekly or monthly stats usually provides a more accurate picture, minimizing confusion.
“Adding to the complexity, Google performs a post-campaign check for suspicious or fraudulent clicks. If the platform detects suspicious clicks, it retroactively adjusts the cost. They are checking it up to 60 days after the click, which means that daily spend/ clicks could differ in Google UI and in your report."
4. Scaling Tracking Efforts as Campaigns Grow
A system that works for five campaigns will break with fifty.
As you add more campaigns, channels, and regions, the complexity of tracking grows exponentially. Manual processes become unsustainable.
A scalable solution is one that doesn't require more manual effort as your advertising activity increases. This is where investing in a solid marketing data pipeline becomes critical for long-term growth.
Step-by-Step Guide: Setting Up Your Ad Spend Tracking System
Building a reliable ad spend tracking system involves more than just picking a tool. It requires a structured approach.
Follow these steps to create a framework that delivers accurate and actionable insights.
Step 1: Define Your Key Performance Indicators (KPIs)
Start with your business goals. What are you trying to achieve with your ads? Is it sales, leads, or brand awareness?
Define the specific KPIs that align with these goals. This could be ROAS for e-commerce, CPA for lead generation, or CPM for awareness campaigns. Clarity on your KPIs will guide your entire tracking setup.
Step 2: Establish a Centralized Data Source
Decide where your single source of truth will live. For many advanced teams, this is a cloud data warehouse like Google BigQuery, Snowflake, or Amazon Redshift.
This central repository will store all your cleaned and normalized marketing data. It provides a stable foundation for all your analysis and reporting.
Step 3: Implement Data Connectors and ETL Processes
You need a way to get data from your sources (like Google Ads and Facebook) into your central repository. This is done through data connectors and an ETL (Extract, Transform, Load) process.
You can build these yourself, but it requires significant engineering resources. A more efficient approach is to use a marketing data platform like Improvado that offers pre-built connectors and handles the entire ETL process for you.
Step 4: Build Your Visualization Layer
Once your data is centralized and clean, you need to visualize it. Connect your data warehouse to a BI tool like Tableau or Looker Studio. This is where you will build your reports and dashboards.
Create visualizations that clearly display your KPIs and allow you to drill down into campaign, ad set, and ad-level performance. Well-designed KPI dashboards make it easy to spot trends and identify issues at a glance.
Step 5: Set Up Alerts and Anomaly Detection
Don't wait to discover problems by manually checking dashboards. Set up automated alerts for key events.
For example, create an alert if a campaign's CPA increases by more than 20% overnight. Or if daily spend exceeds its target by 10%. These proactive notifications allow you to address issues immediately, before they have a major impact on your budget.
Improvado’s Marketing Data Governance allows marketers to apply metric-level pacing intelligence across all ad platforms. It continuously evaluates spend, volume, and efficiency against expected patterns and sends real-time alerts when performance drifts.
This ensures you catch overspend, underdelivery, or sudden metric instability before they compound into budget waste or missed targets.

Conclusion
Accurate ad spend tracking is one of the most important levers for controlling efficiency, preventing waste, and understanding the true performance of your marketing investments. While most teams begin with basic in-platform reporting, the limitations of fragmented data eventually make unified tracking essential. The gold standard is a centralized system that consolidates spend, performance, and revenue signals across all channels in one governed environment.
Improvado provides that foundation. Its unified data pipelines, cross-channel normalization, real-time pacing intelligence, and revenue integrations give teams a single, accurate view of ad spend performance. With consistent logic and automated monitoring, organizations can move from reactive reporting to precise, proactive budget management that protects ROI and supports smarter decision-making at scale.
Related reading: What is Ad Inventory? A Comprehensive Guide for 2026