
Choosing the right business intelligence tool is crucial for turning data into actionable insights. Looker and Power BI are two of the most popular platforms, each offering unique features and capabilities.
In this article, we’ll compare Looker vs Power BI, examining their strengths, use cases, and how they cater to different business needs. Whether you’re focused on data modeling, visualizations, or ease of use, this guide will help you decide which platform best fits your organization’s analytics goals.
Key Takeaways
- Looker (Google Cloud) is built for enterprises needing centralized governance, semantic modeling via LookML, and real-time analytics on modern data warehouses.
- Power BI (Microsoft) is strong for organizations with many business users, existing Microsoft infrastructure, lots of connectors, and demand for cost-effective self-service analytics.
- Cost, skill level, and architecture (cloud vs on-premises / hybrid) are the biggest levers when choosing.
- Neither tool solves bad data problems, so a solid ETL/ELT or data unification layer is essential.
- In many cases, companies benefit from using both: Looker for centralized modeling + analytics, and Power BI for spreading dashboarding and ad-hoc reporting among non-technical teams.
What Is Looker?
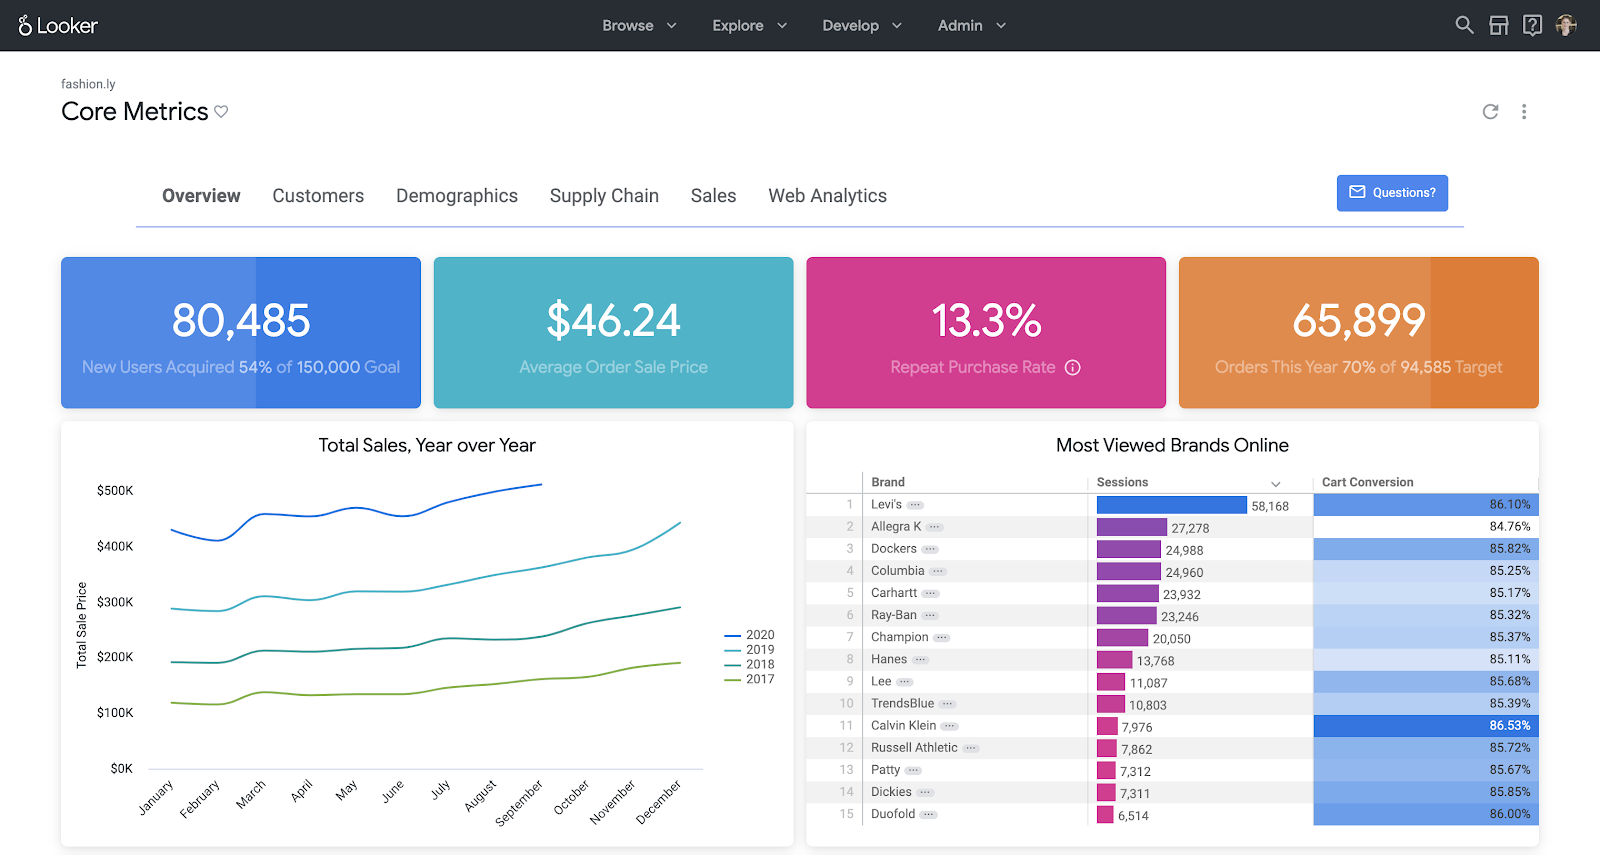
Looker is a business intelligence and data platform now under Google Cloud. It’s designed for deep analytics via a semantic modeling layer (LookML), to enable consistent definitions of metrics across dashboards, embedded analytics, and real-time exploration directly against the data warehouse rather than importing data.
Key Features
- LookML: Language for modeling, definitions of dimensions, measures, relationships, and logic. Ensures reusability and consistency of data.
- In-Database / Cloud DW Focus: Queries generated in Looker are pushed down to the data warehouse (for example, BigQuery, Snowflake) rather than storing and reprocessing data within Looker.
- Governance and Security: Looker provides centralized metric definitions, RBAC (role-based access control), row-level security, and strong version control.
- Embedded Analytics / API-First: Designed also for embedding dashboards and exploration into other products/portals.
- Exploration and Ad-hoc Analysis: Detail drilling, flexible filters, ability to build derived models via LookML.
Strengths
- Strong consistency of metrics and calculations due to semantic models.
- Scales well with data size, since computation leverages the data warehouse.
- Excellent for technical users and data teams or organizations that require high governance.
- Particularly attractive for companies invested in Google Cloud (BigQuery, Google Analytics, and other tools).
Weaknesses
- Steeper learning curve: LookML is code-based; non-technical users will need support.
- Visualizations are solid but less “flashy” out-of-the-box compared to some BI tools focused purely on visual polish.
- Pricing tends to be custom / premium; higher entry cost.
- Not built to be a full ETL/ELT tool; data preprocessing often happens outside or upstream.
What is Power BI?
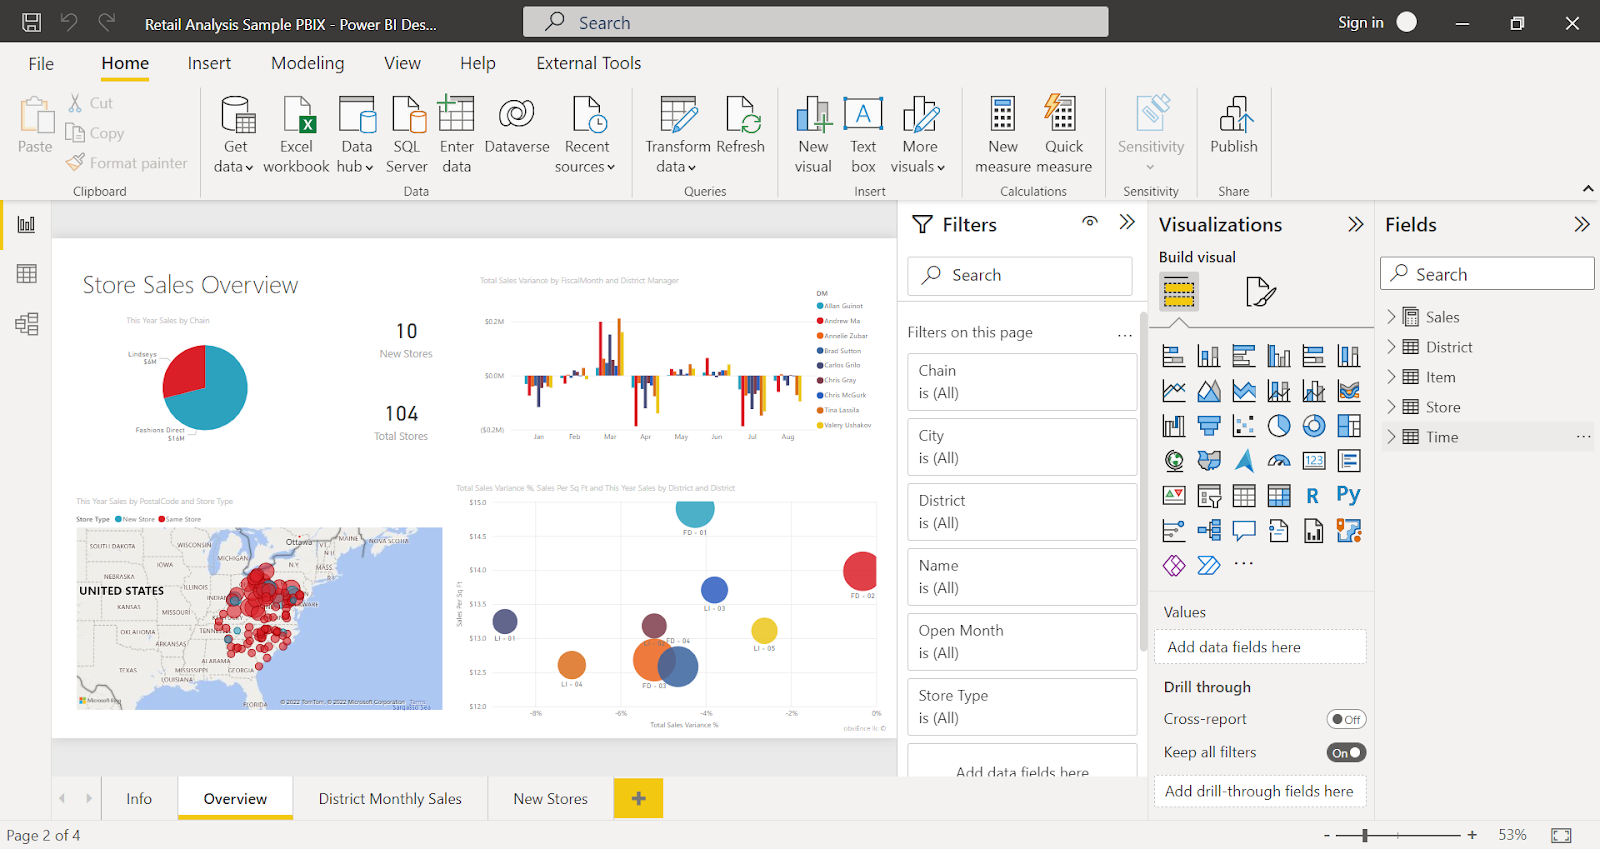
Power BI is Microsoft’s flagship business analytics service. It combines data ingestion, transformation (Power Query), modeling (via data model + DAX), rich visualization, and collaborative sharing.
There are Desktop, Service (cloud), Embedded, and on-premise/off-hybrid offerings.
Key Features
- Power Query (M language): Tool for data preparation, transformation, and cleaning from multiple sources.
- DAX (Data Analysis Expressions): Language for creating measures, calculated columns, and table logic; highly powerful but with a learning curve.
- Rich Visualization & Custom Visuals: Extensive library of chart types, marketplace visuals, and interactive dashboard components.
- Multiple Deployment Options: Cloud (Power BI Service), on-premises (Power BI Report Server), and Power BI Embedded for integration into apps.
- Microsoft Ecosystem Integration: Native connections with Azure, SQL Server, Excel, Office 365, Teams, and other Microsoft services.
- AI & Advanced Analytics: Natural language Q&A, anomaly detection, quick insights, and trend analysis with built-in AI and machine learning features.
Strengths
- Easier entry for business and non-technical users: provides drag-drop features, familiar UI, Excel-like flows.
- Broad connector ecosystem: databases, cloud services, flat files, on-prem systems.
- Flexible pricing tiers including free version (Desktop) & relatively affordable Pro / Premium options.
- Strong community and support, wide adoption.
Weaknesses
- For advanced modeling or enterprise scale, managing consistency of metrics or definitions across many users can get messy. Governance needs care.
- Performance can degrade with very large datasets or complex DAX logic if not architected carefully.
- The Desktop app means that editing often happens offline / in separate tool; less purely web-first than Looker.
Looker vs Power BI: Comparison Table
The following table provides a side-by-side comparison of the two BI solutions across various essential features. This will give you a quick overview of how each platform performs, and in the following sections we will dig deeper into each feature.
| Feature | Looker | Power BI |
|---|---|---|
| Ecosystem Integration | Strong integration with Google Cloud and modern data warehouses | Seamless integration with Microsoft services (e.g., Excel, Azure, Office 365) |
| Ease of Use | More technical, requires SQL knowledge for full capabilities | User-friendly, but advanced features may require technical skills |
| Data Manipulation | Advanced data modeling and transformation with LookML | Robust data manipulation through Power Query |
| Real-Time Analysis | Supports real-time data analysis with connected data sources | Real-time analytics with premium services or Pro license |
| Customization | Highly customizable, especially with LookML for tailored models | Extensive customization options for dashboards and reports |
| Collaboration | Strong collaboration through Looker’s web-based environment | Built-in collaboration with Microsoft Teams and Office 365 |
| Data Integration | Supports a wide range of modern cloud data sources | Extensive data source support, both cloud and on-premise |
| Pricing | Premium pricing for enterprise-level solutions | Free tier available, Pro and Premium tiers for advanced features |
| Advanced Analytics | Built-in advanced analytics, supports SQL queries, machine learning integration | Built-in AI features and machine learning capabilities |
| Best Use Case | Ideal for data teams needing deep customization and cloud-based data modeling | Best for businesses needing seamless integration with Microsoft and quick dashboard setup |
Key Differences Explained: A Deep Dive into Looker vs. Power BI
Looker and Power BI are two leading business intelligence platforms. Both offer robust features for data analysis and visualization. To make a well-informed choice, it helps to understand where Looker and Power BI diverge in more technical or operational details.
This following deep dive will explore how each platform handles data manipulation, customization, real-time analytics, and more to help you understand which solution best fits your business needs.
1. Ecosystem Fit
- Looker is natively integrated with Google services like Google Analytics, BigQuery, and Google Ads, making it a strong choice for users already working within the Google ecosystem. It supports over 800 partner connectors, which allow you to bring in external data sources such as Facebook Ads and custom APIs. Additionally, Looker integrates seamlessly with Google Cloud and other modern data warehouses like BigQuery, Redshift, and Snowflake. This makes it a powerful choice for businesses that rely heavily on cloud-based infrastructure and need advanced data analytics capabilities across large datasets.
- Power BI integrates deeply with Microsoft products, including Excel, Azure, and Dynamics 365. This makes it particularly appealing for organizations using Microsoft's suite of tools. With over 100 native data connectors and the ability to create custom integrations, Power BI offers versatility in data sourcing.
2. Ease of Use
- Looker is designed for more technical users, particularly data teams with SQL knowledge. Its flexibility and power come from its ability to handle complex data modeling through LookML, which allows for deep customization of metrics and dashboards. However, this means that non-technical users may face a steeper learning curve, as understanding LookML and SQL is often required to fully leverage the platform’s capabilities. While Looker offers intuitive dashboards, it generally requires data expertise to maximize its potential.
- Power BI is more user-friendly and designed for both technical and non-technical users. With drag-and-drop functionality, pre-built templates, and a wide range of visualization options, Power BI makes it easy for users to quickly build dashboards and reports without needing advanced technical skills. Additionally, Power BI’s integration with familiar tools like Excel reduces the learning curve for users who are already part of the Microsoft ecosystem.
2. Data Modeling and Semantic Layer
- Looker excels in data modeling through its proprietary LookML language, which allows users to create reusable, scalable data models. LookML enables teams to define complex metrics and logic, ensuring consistency across reports and dashboards. Looker’s approach to data modeling is particularly suited for organizations that need deep customization and the ability to manipulate large, complex datasets. However, this flexibility often requires a solid understanding of SQL, making Looker better suited for technical teams with strong data expertise.
- Power BI provides robust data manipulation tools through its Power Query feature, allowing users to clean, transform, and merge data from multiple sources with ease. Power BI’s data modeling capabilities are accessible even to non-technical users, with drag-and-drop functionality and visual interfaces for creating relationships between datasets. While Power BI offers strong modeling capabilities, it is generally considered more user-friendly for business users who may not have technical backgrounds. For complex data transformation, Power BI also integrates well with DAX (Data Analysis Expressions) for advanced users looking to perform deeper data manipulation.
3. Data Integration
- Looker is optimized for integration with modern cloud-based data warehouses such as Google BigQuery, Amazon Redshift, and Snowflake, allowing real-time access to large datasets without the need for duplication or data movement. This capability makes Looker a strong choice for organizations with cloud-first strategies that need live data connections. Looker also integrates with a wide range of other sources, including SQL databases, AWS, and data lakes, offering flexibility for building custom data pipelines. However, Looker's focus remains on cloud and SQL-based environments, making it particularly suitable for businesses already operating in modern data ecosystems.
- Power BI provides broader integration capabilities, supporting both cloud-based and on-premise data sources. In addition to seamless integration with Microsoft tools like Azure, Excel, and SQL Server, Power BI offers connectors to platforms such as Salesforce, Google Analytics, Oracle, SAP, and many more. This broad range of data integrations, combined with its ability to connect to data stored in cloud storage services like Google Drive and Dropbox, makes Power BI highly versatile. For businesses with mixed infrastructures or legacy systems, Power BI’s ability to integrate with a wide variety of data environments provides a significant advantage.
4. Customization and Visualizations
- Looker offers extensive customization options, especially for data modeling and reporting through LookML. Users can create highly tailored reports and dashboards with precise control over metrics, data transformations, and logic. Looker allows users to build reusable models, ensuring consistency across the organization while enabling deep customization for specific business needs. In terms of visualizations, Looker provides a wide array of chart types and customizable layouts, but its primary strength lies in data accuracy and consistency, rather than advanced visual design. Custom visualizations are possible but typically require more technical knowledge to implement effectively.
- Power BI stands out for its rich and easy-to-use visualization capabilities. With a drag-and-drop interface, users can quickly build interactive dashboards and reports without needing extensive technical skills. Power BI offers a broad selection of pre-built visualizations, including bar charts, line graphs, pie charts, maps, and more. Additionally, users can create custom visualizations or import third-party visuals from the Power BI marketplace, providing even greater flexibility. The platform's ability to build highly interactive and visually appealing reports makes it ideal for teams looking to quickly convey insights to stakeholders.
5. Collaboration Features
- Looker is built with collaboration at its core, particularly for data teams. As a web-based platform, Looker allows multiple users to access, explore, and collaborate on the same data in real time. Users can easily share dashboards and reports with teammates via links, schedule reports to be automatically sent via email, or embed visualizations directly into applications and websites. Looker’s permissions settings also allow granular control over who can view, edit, or interact with specific reports and datasets, making it a robust solution for large teams managing complex data workflows. Its integration with third-party tools like Slack and Jira further enhances team collaboration by embedding data directly into team communication workflows.
- Power BI also supports strong collaboration, particularly within the Microsoft ecosystem. Users can easily share dashboards and reports through Power BI Service, Microsoft Teams, or SharePoint. Power BI integrates seamlessly with Office 365, making it simple to collaborate on reports through Excel or Teams. The platform supports real-time collaboration, allowing multiple users to co-author reports and dashboards, comment on shared visuals, and track changes. Additionally, Power BI offers role-based access control, ensuring that sensitive data is only available to authorized users.
6. Architecture and Data Flow
- Looker pushes computation into the warehouse (“in-database”), meaning the warehouse’s performance, cost, and architecture matter a lot. If your warehouse is well designed, with tight optimization, this works well.
- Power BI supports both import mode (data brought into Power BI) and DirectQuery / live connection options. Import offers speed for smaller datasets; DirectQuery/live is closer to “real-time” but can hit performance/trust issues depending on data source. On-prem deployments via Power BI Report Server are also possible for organizations with regulatory or security needs.
7. Pricing and Total Cost of Ownership (TCO)
- Looker operates on a custom pricing model, which is typically more expensive and suited for enterprise-level organizations. The cost depends on factors like the number of users, data volumes, and specific use cases, making it a significant investment for businesses needing advanced data modeling and real-time analytics.
- Power BI, on the other hand, offers more flexible and affordable pricing options. It has a free version for individual use, and the Pro plan is priced at a flat monthly fee per user. For larger businesses, the Premium plan offers more advanced features, including higher data capacity and real-time analytics, at a higher but still competitive rate.
Plus, in both tools, TCO includes:
- Data Warehouse and Storage Costs: Looker relies heavily on the performance and architecture of your data warehouse since all queries run “in-database.” This means warehouse size, optimization, and compute costs directly impact performance and spend. Power BI can also connect to cloud or on-prem databases, but with its import mode, some processing happens inside Power BI, reducing warehouse load for smaller datasets.
- Training and Specialized Skill Sets: Looker development requires knowledge of LookML, a modeling layer that defines business logic and metrics. Power BI uses DAX and Power Query (M language) for calculations and transformations, which also have steep learning curves. Hiring and upskilling teams to manage these tools represents a significant long-term cost.
- Scaling Dashboards and Governance: As the number of dashboards and users grows, so do the demands for governance, version control, and maintenance. Looker’s semantic layer helps enforce consistency but requires careful modeling upfront. Power BI offers flexibility but can lead to report sprawl and inconsistent metrics if governance processes aren’t in place.
Ideal Use Cases: Looker vs. Power BI
Here are scenarios where one tool tends to outperform the other.
| Scenario | Looker Is Likely Better | Power BI Is Likely Better |
|---|---|---|
| High governance and consistency required (finance, regulatory, multi-region) | ✔︎ | Possible but more process overhead |
| Large, cloud-native data warehouse and big datasets | ✔︎ | Can work, but may need Premium / capacity and careful modeling |
| Many non-technical users needing simple dashboards and self-service | ✔︎ | |
| Existing Microsoft stack (Azure, Excel, Teams, Dynamics, etc.) | ✔︎ | |
| Need embedded analytics in a SaaS product or external application | ✔︎ | ✔︎ (via Power BI Embedded), though context differs |
| Predictive modeling / advanced AI where you want ML integrated with BI | Mixed: Looker with external ML or BigQuery ML | Stronger built-in AI features for many users |
| Tight budget / small team | Looker likely higher upfront / per-user cost | Power BI likely lower initial cost |
Pricing Comparison & Considerations in 2026
Recent data gives more clarity on pricing tiers and what you can expect in terms of cost and licensing.
Looker Platform (enterprise, with LookML etc.): Entry-level enterprise pricing rumored to start around US$35,000/year for modest usage. Full cost depends heavily on number of users, data volume, frequency of queries, embedding, and other features.
Power BI pricing
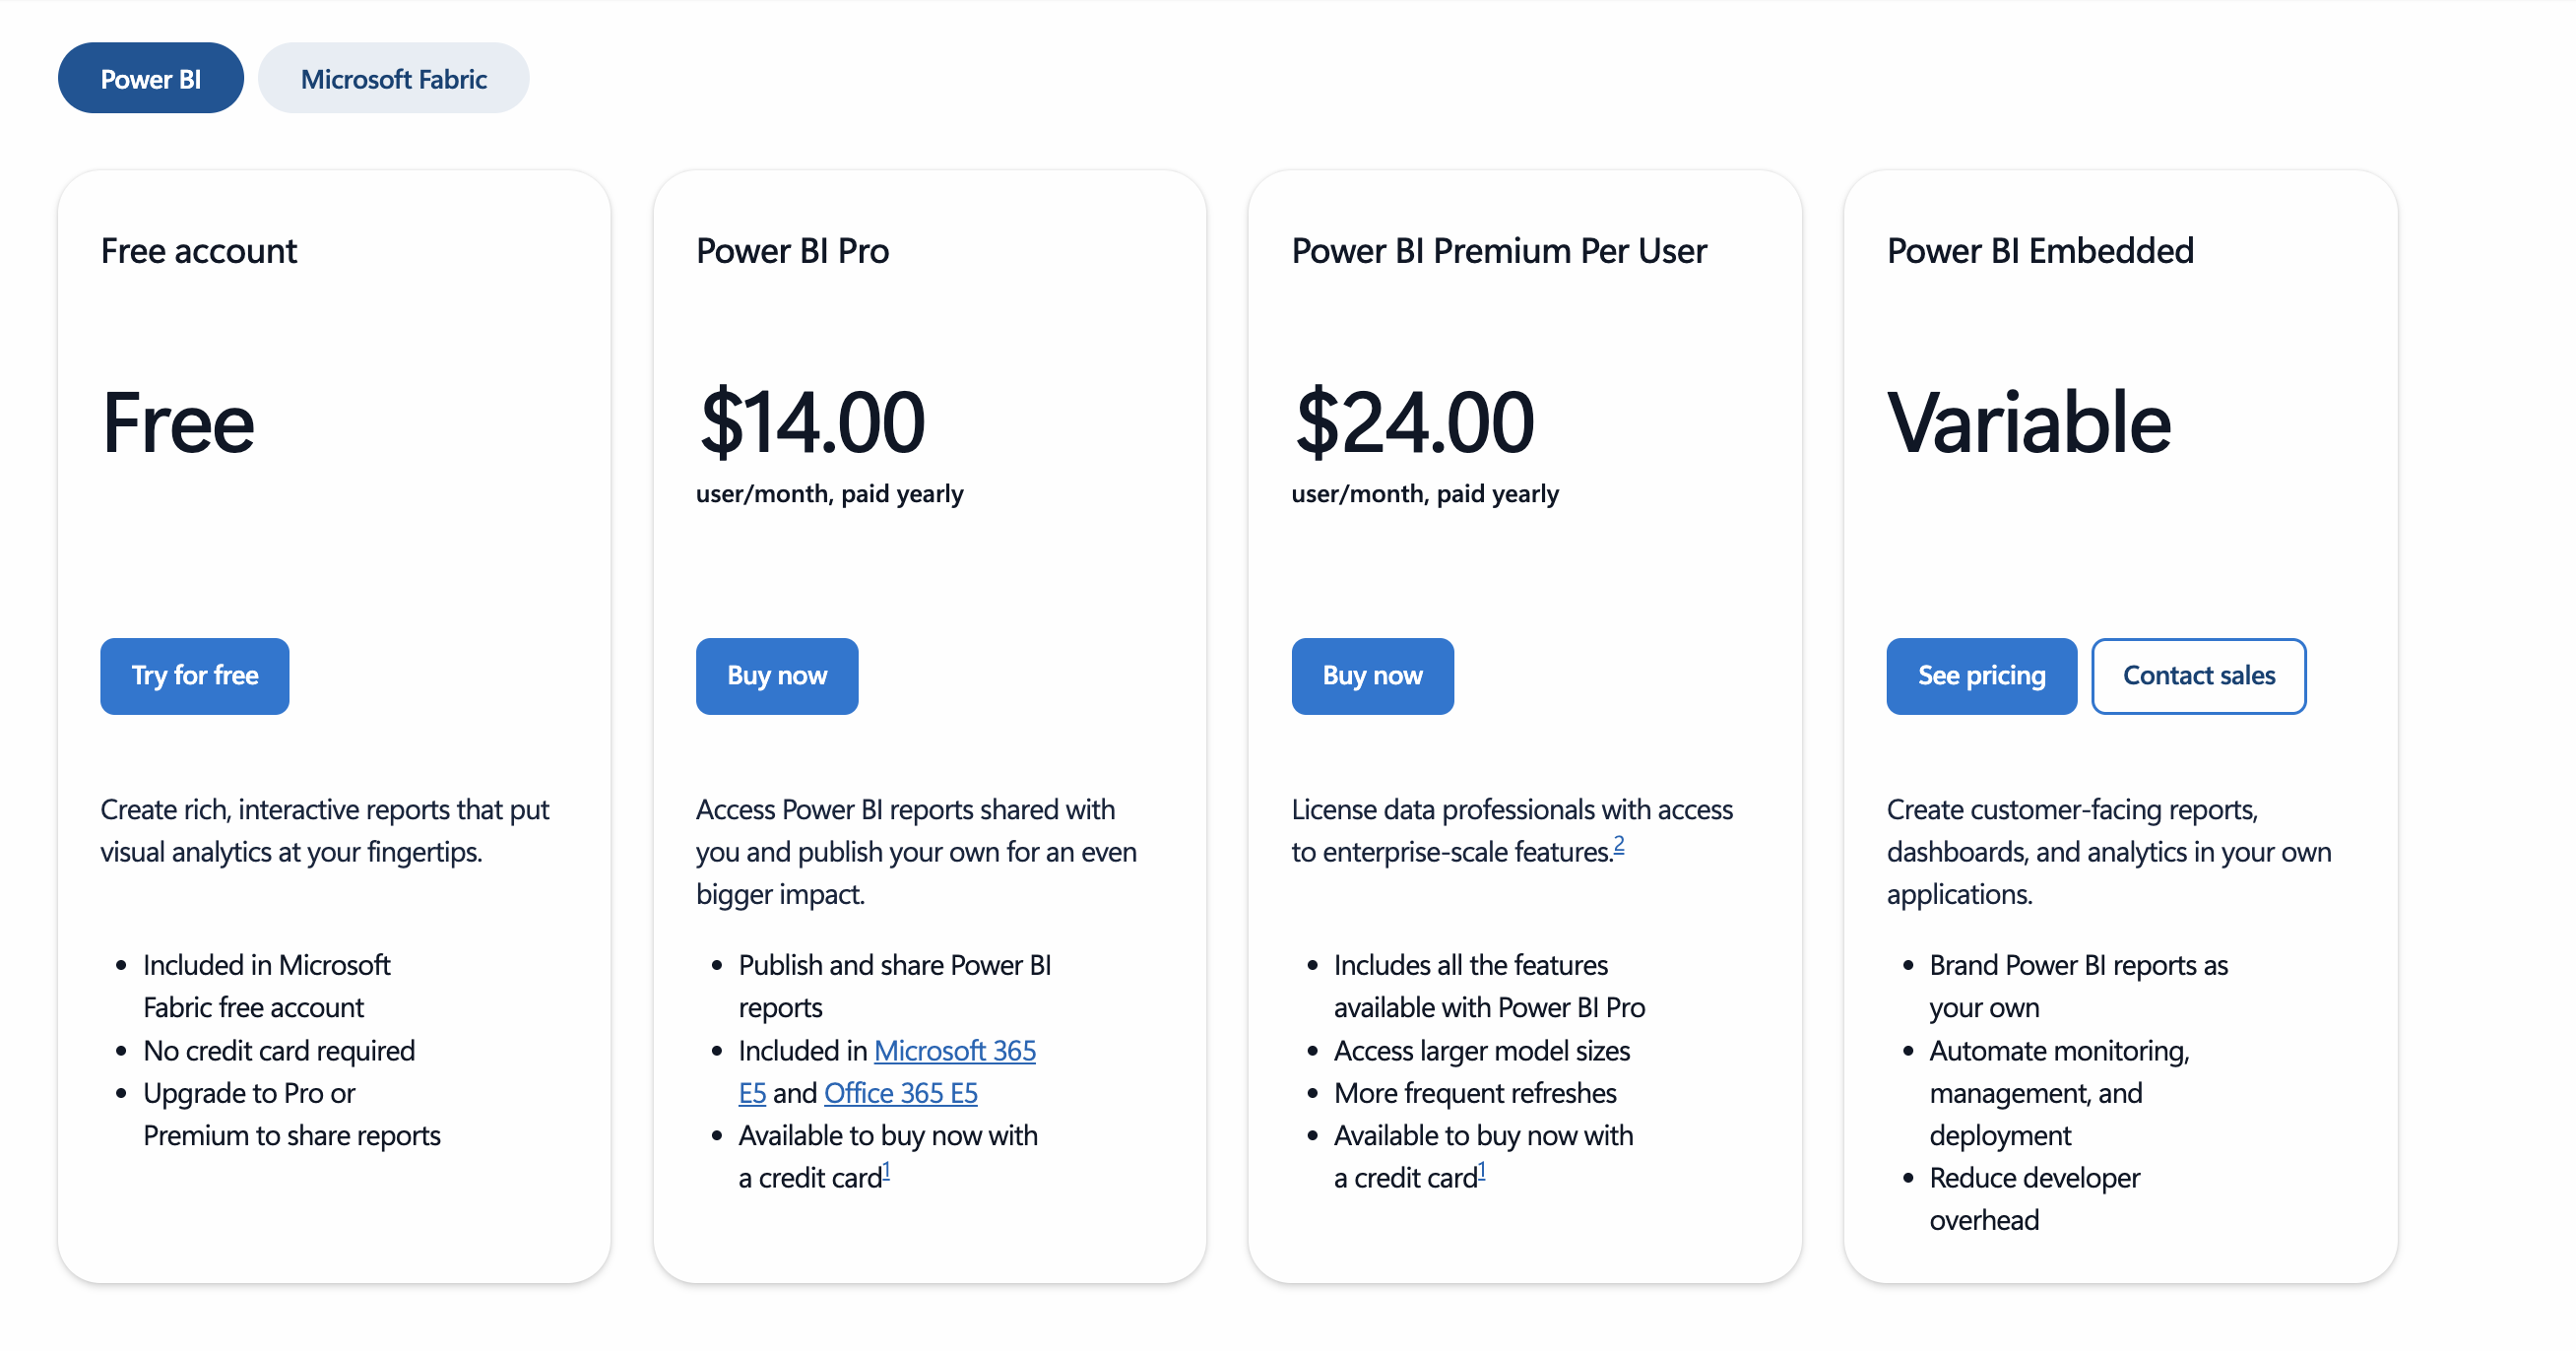
*Costs vary by region; enterprise deals / volume.
Data Foundation for Your Analysis
A common theme across any analytics project is that even the most advanced BI platform is only as good as the data fed into it. When data is fragmented across systems, definitions are inconsistent, or datasets are incomplete and unclean, the resulting dashboards will mislead rather than inform.
Both Looker and Power BI provide strong visualization and modeling capabilities but have inherent limitations in data preparation. Looker depends heavily on the underlying data warehouse’s structure and performance. If the warehouse isn’t optimized, Looker’s in-database approach can surface inaccurate or incomplete metrics.
Power BI offers more flexibility with import mode and Power Query, but at scale, manual transformations and dataset sprawl can lead to versioning issues, inconsistent metrics, and governance challenges.
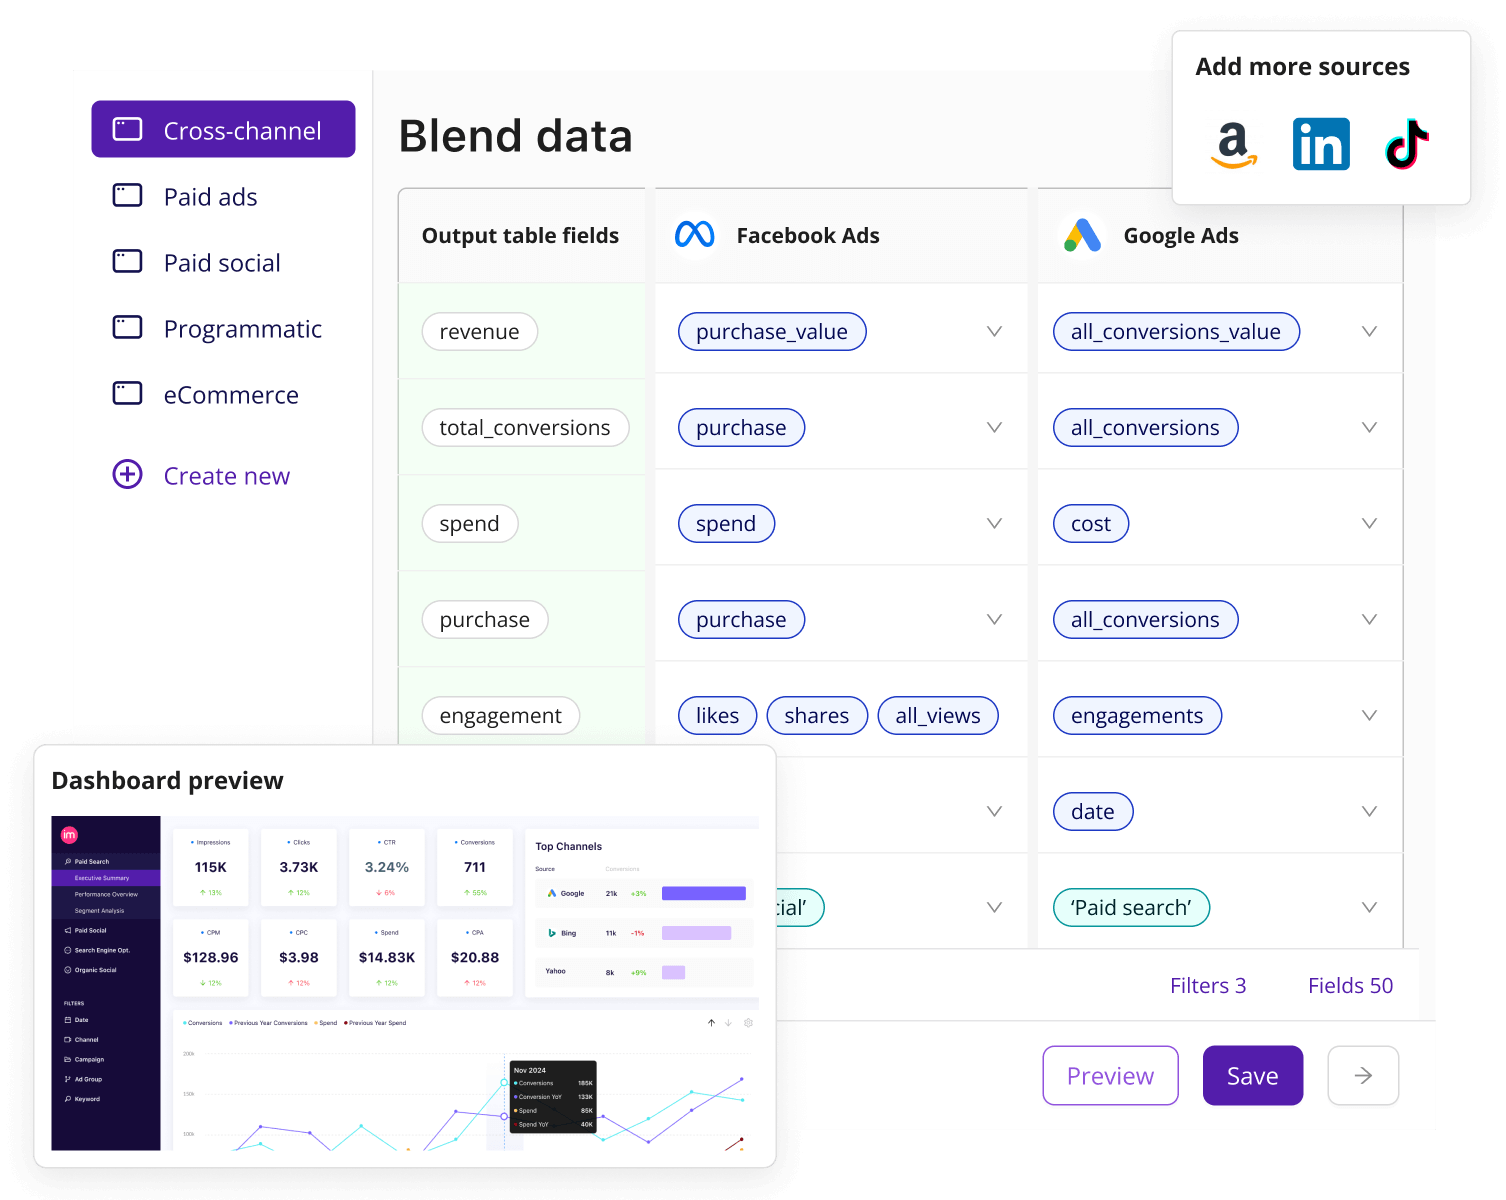
This is where Improvado comes in. Designed for complex, multi-channel environments, Improvado automates data aggregation, transformation, and governance across 1,000+ marketing, sales, and finance sources. It standardizes definitions, enforces naming conventions, and delivers clean, unified datasets directly to your warehouse or BI tool, removing the need for endless manual prep work.
With a solid data foundation in place, Looker and Power BI can operate at their full potential, delivering trusted insights to drive smarter decisions.
Ready to strengthen your analytics foundation? Book a demo and see how Improvado ensures your BI dashboards are accurate, consistent, and built for scale.
"Improvado helped us gain full control over our marketing data globally. Previously, we couldn't get reports from different locations on time and in the same format, so it took days to standardize them. Today, we can finally build any report we want in minutes due to the vast number of data connectors and rich granularity provided by Improvado."

Related reading: Power BI vs Improvado: Marketing Data Platform Comparison, Looker vs Sisense: 2026 Comparison for Marketing Teams, Looker vs ThoughtSpot 2026: Which Tool for Marketing?, Power BI Analytics for Marketing Teams: 2026 Guide, Power BI Dashboard Guide for Marketing Analytics (2026)

