Selecting the right enterprise business intelligence reporting tools is pivotal for extracting actionable insights and steering informed strategic decisions. With a multitude of options available, choosing the most suitable platform is challenging.
This article simplifies the selection process by spotlighting the top 5 enterprise BI solutions. Our goal is to equip you with the necessary information to pick a tool that meets your analytical needs and enhances your organization's data reporting and decision-making processes.
First Things First: Is Your Data Ready for BI and Visualization?
Before diving into business intelligence platforms, ensure your data is primed for BI tools. Here's a concise checklist to get started:
- Data accuracy: Conduct audits to verify the accuracy of your data sources. Inaccurate data can mislead decision-making processes. Consider implementing automated validation rules where possible.
- Data consistency: Harmonize data formats and units across different sources to ensure consistency. Discrepancies can lead to faulty analysis. Standardize data entries through a centralized data management platform if available.
- Data completeness: Identify and address any missing values or gaps in your datasets. Incomplete data can result in biased insights.
- Data organization: Logically structure your data, using clear categorization and tagging to facilitate easy access and analysis. Implement a metadata management strategy to enhance data discoverability.
- Data integration readiness: Assess whether your datasets are ready for seamless integration into BI tools. This may involve data format conversion or schema alignment to ensure compatibility with your BI software.
- Data security: Review your data handling and analysis processes for compliance with industry-specific data protection regulations such as GDPR or HIPAA.
- Data governance: Develop and enforce data governance policies that define how data is collected, stored, and used within your organization. This ensures ongoing data quality and integrity, crucial for reliable analysis.
Ensuring your data meets these critical criteria is key to any BI and visualization projects. Improvado can complete all these steps for you, from data aggregation from any marketing source to its encrypted transit to the BI solution of your choice.
As a comprehensive marketing data aggregation and management solution, Improvado seamlessly gathers data from any source and ensures it meets the criteria for accuracy, consistency, completeness, and security.
What Makes a Great Enterprise Business Intelligence Tool?
Selecting the right enterprise business intelligence platform goes beyond mere features. It's about finding a solution that aligns with your strategic goals and analytical demands.
In this section, we'll uncover the essential qualities that distinguish top-tier enterprise BI solutions, offering you a clear roadmap to choose a system that enhances decision-making.
Seamless integration capabilities
The best enterprise BI tools can integrate with everything from legacy systems to modern cloud applications without requiring extensive custom coding. They use APIs and connectors to simplify data ingestion, ensuring a holistic data landscape.
Advanced analytics and data modeling
These tools support sophisticated data modeling techniques, allowing users to analyze data across multiple dimensions. Best enterprise data analytics platforms incorporate AI and ML algorithms to automate pattern recognition, anomaly detection, and predictive analytics, turning raw data into actionable insights.
Real-time data processing
Real-time processing is enabled by in-memory computing, drastically reducing query response times and enabling the analysis of streaming data. This feature is crucial for capitalizing on market movements as they happen.
Scalability and performance
A great BI tool scales horizontally and vertically, accommodating more data and users without degrading performance. It uses techniques like data sharding and load balancing to manage large datasets and concurrent user queries, ensuring all stakeholders have swift access to insights.
Robust security framework
A good enterprise business intelligence platform offers fine-grained access control, encryption in transit and at rest, and compliance with industry standards like GDPR, HIPAA, and SOC-2. It should also provide audit trails for data access and changes, helping organizations maintain data governance and regulatory compliance.
Automated reporting and alerts
Automation features include scheduling reports to run at specific intervals and setting up alerts based on data thresholds. This not only saves analysts' time but also ensures that stakeholders are immediately informed about critical metrics, trends, or issues, enabling rapid response to dynamic market conditions.
Best Enterprise Business Intelligence Software Solutions
Based on detailed criteria and hands-on experience, here are the top five picks for the best enterprise business intelligence platforms. These tools excel in data integration, analytics, user experience, and scalability, offering robust support for data-driven decision-making.
1. Microsoft Power BI
Data integration capabilities
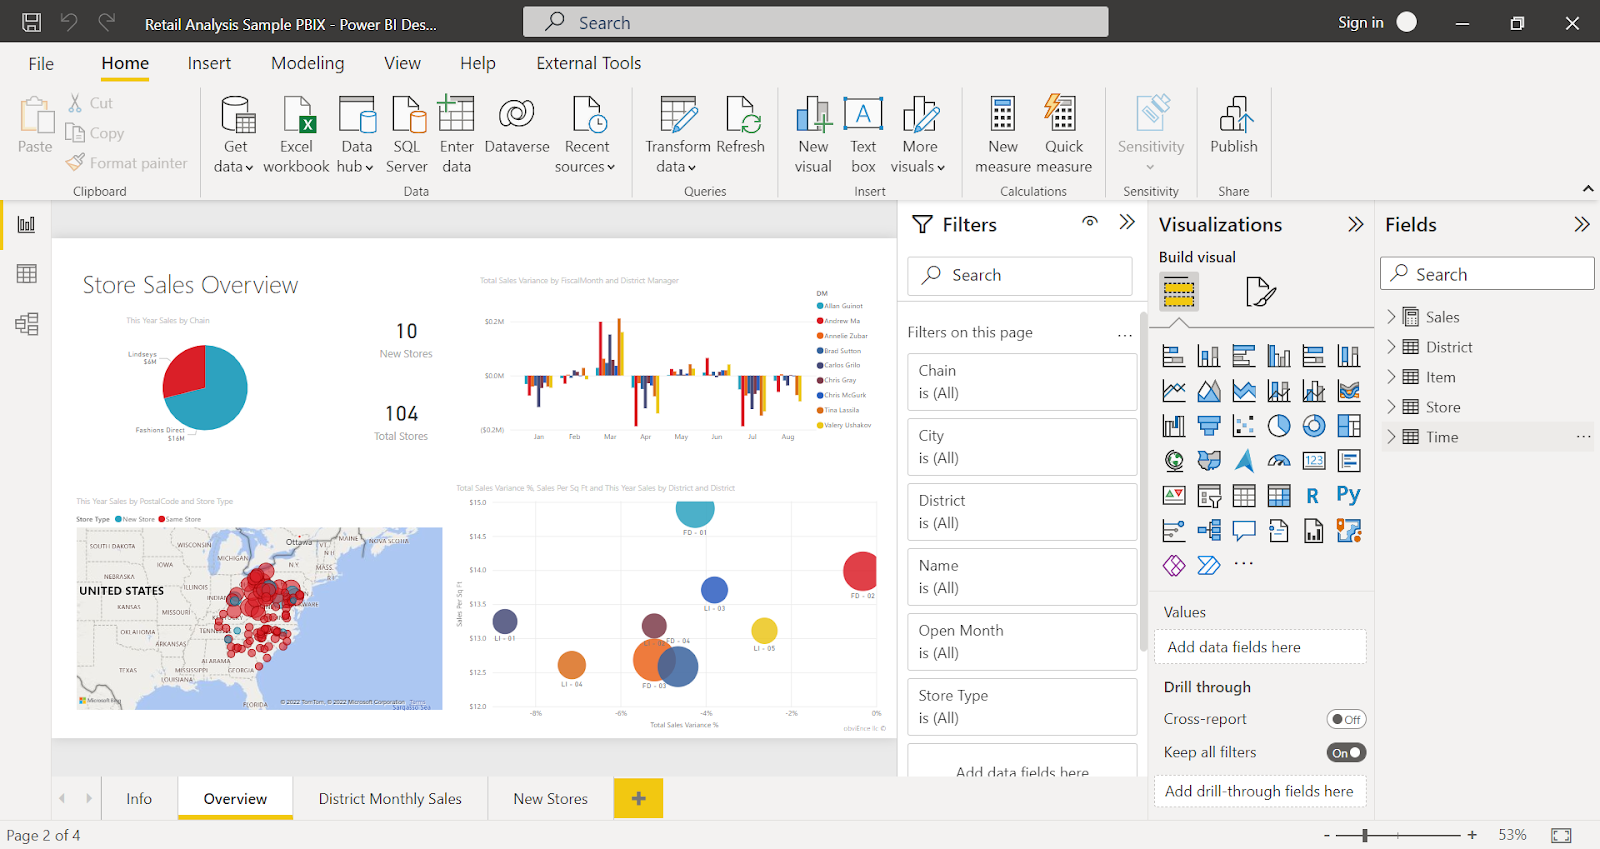
Microsoft Power BI is a popular enterprise business intelligence solution that supports a wide array of data sources, from spreadsheets to complex on-premises hybrid data warehouses. It enables users to consolidate disparate data sets into a unified view, facilitating a comprehensive analysis landscape. This level of integration is particularly beneficial for enterprises looking to leverage data from multiple business units or platforms.
Beyond the direct API connectors, Power BI offers several other data aggregation and integration options:
- DirectQuery allows for real-time data querying without the need for importing or copying data into Power BI which is particularly useful for working with large datasets or when up-to-the-minute data is required.
- On-premises data gateway enables secure data connectivity from on-premises data sources to Power BI service in the cloud.
- The composite models feature allows users to combine data from multiple sources into a single model. This enables analysts to create reports that draw on data from both imported datasets and DirectQuery sources, offering flexibility in handling complex data scenarios.
Data transformation and analysis
At the core of Power BI's data transformation capability is the Query Editor. The Query Editor supports a variety of transformations, including filtering, sorting, and merging datasets, making it easier to clean and prepare data for analysis. Its intuitive interface enables users to apply complex transformations with minimal coding.
Power BI's DAX (Data Analysis Expressions) language is a standout feature, offering advanced capabilities for creating custom calculations and measures. This feature empowers analysts to uncover deeper insights and drive more informed strategic decisions.
Dataflows are another key feature for enterprises managing data across multiple Power BI models or needing to share data between different reports. Dataflows allow users to define and automate data preparation processes, storing the resulting data in the Power BI service. This centralized approach to data management ensures consistency across reports and models, reducing redundancy and improving efficiency in data processing.
Data visualization and customization
Power BI offers a wide variety of visualization options, from basic charts to complex diagrams, all customizable to fit the brand and reporting needs of the enterprise. The drag-and-drop functionality makes it accessible for non-technical users, while still offering depth for those who wish to dive deeper.
AI and advanced analytics
One of the platform's most innovative aspects is its integration of artificial intelligence and machine learning capabilities. Power BI enables predictive analytics, trend indicators, and even natural language processing for querying data.
Furthermore, Power BI enhances accessibility through Paginated Reports. This feature caters to users without extensive SQL knowledge, enabling them to generate detailed, formatted reports. Paginated Reports make comprehensive data insights accessible to all skill levels within an organization.
Practical insights for enterprise users
Power BI is a powerful enterprise analytics platform. Its scalability and integration with other Microsoft products, such as Azure and Office 365, make it a seamless addition to the existing IT ecosystem. Its security features and compliance with industry standards ensure that data governance and privacy concerns are adequately addressed, which is crucial for large organizations.
2. Tableau
Data integration capabilities
Tableau is one of the best enterprise business intelligence tools that connects seamlessly with an extensive array of data sources. This includes cloud services, big data solutions, and SQL databases such as MySQL and SQL Server. As part of the Salesforce family, Tableau benefits from native integrations with Salesforce products.
Data transformation and analysis
Tableau Prep, a key component, simplifies the process of cleaning, reshaping, and combining data, making it analysis-ready. The drag-and-drop interface simplifies complex data preparation tasks, enabling users to focus more on analysis and less on data wrangling.
In terms of analysis, Tableau allows users to dive deep into predictive analytics without the need for advanced statistical knowledge. Features such as trend analyses, forecasting, and what-if scenarios are accessible directly within the platform, offering powerful tools to discover insights that can drive strategic marketing decisions.
Data visualization and customization
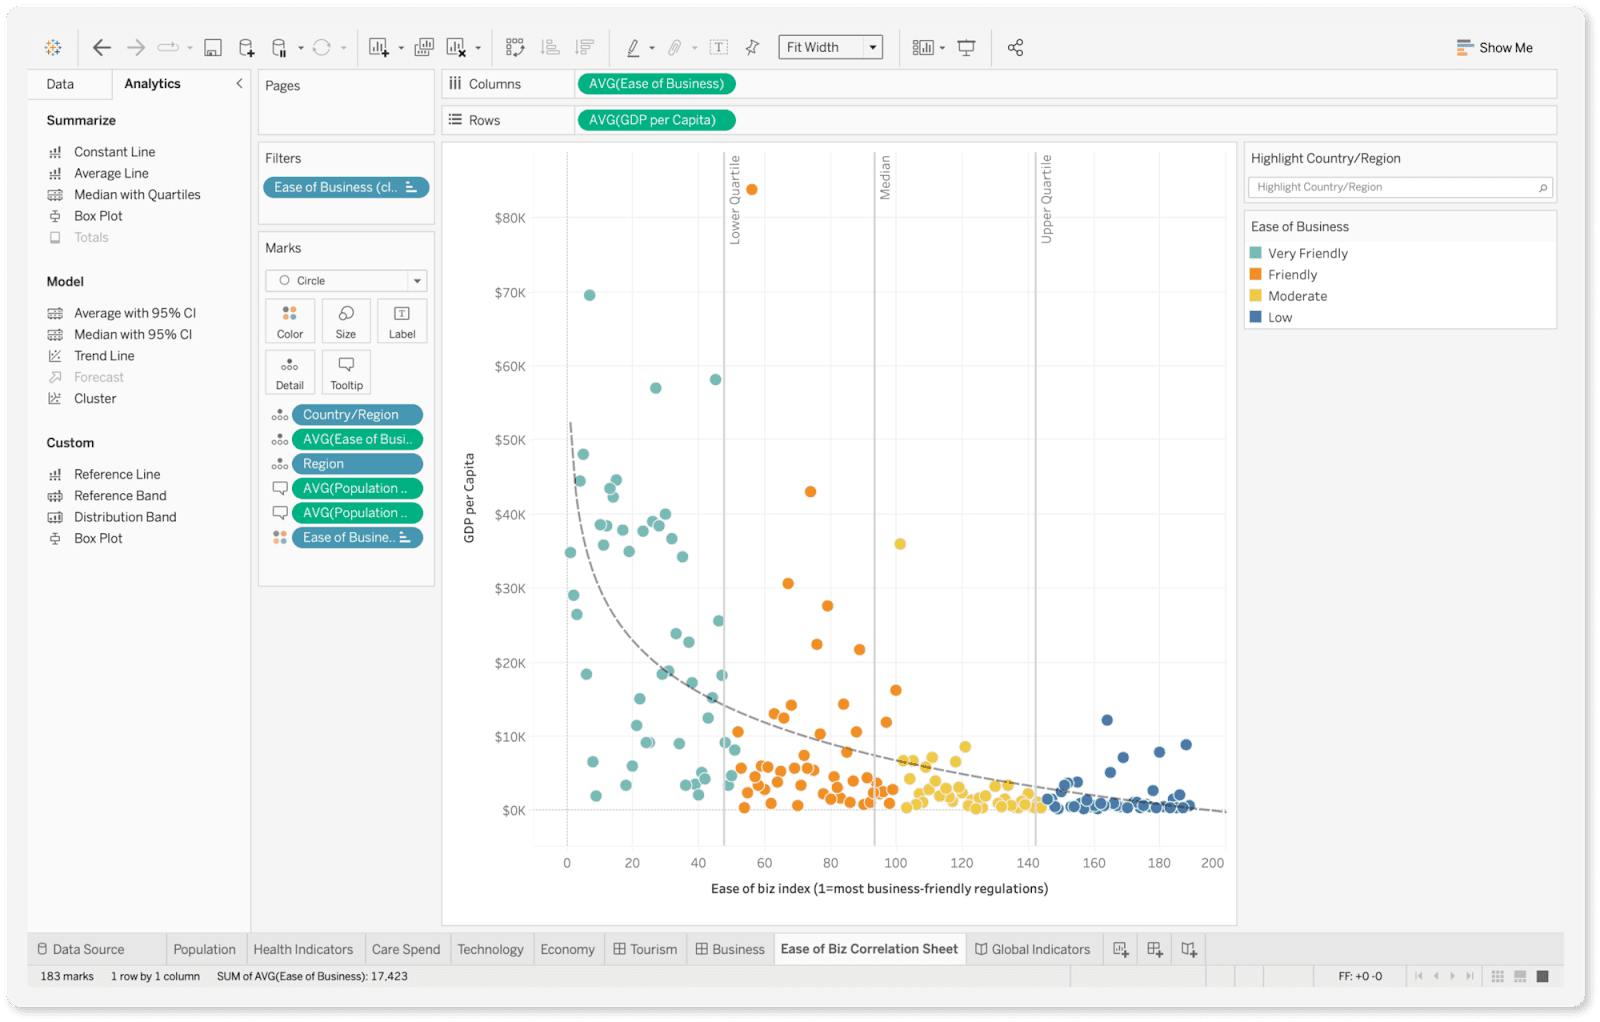
Tableau supports a comprehensive range of visualization types, enabling users to convey complex data stories through simple charts, intricate interactive maps, and everything in between.
The platform allows for the creation of interactive dashboards and worksheets. Dashboards combine multiple visualizations into a single view, offering a comprehensive snapshot of data insights. Worksheets are more focused, usually containing a single visualization for detailed analysis.
Tableau provides extensive options for personalization, including the ability to tweak visual elements such as colors, fonts, and layouts to align with company branding or specific presentation requirements. This level of customization extends to incorporating images and web content into dashboards.
Tableau has its language for data querying and visualization called VizQL Technology. VizQL translates users' drag-and-drop actions on the Tableau interface into data queries. Essentially, it allows users to create visualizations and conduct analyses without needing to write a line of code.
AI and advanced analytics
Tableau integrates advanced AI capabilities to streamline the analytics process:
- The Ask Data feature allows users to pose questions in natural language and receive visual answers, making data exploration intuitive for all skill levels.
- With Explain Data, users get automatic insights into data points, uncovering underlying trends or anomalies without manual analysis.
- Through its connection with Salesforce's Einstein Discovery, Tableau offers predictive analytics and actionable recommendations, enabling businesses to forecast trends and optimize strategies based on data-driven insights.
For those seeking deeper analysis, Tableau facilitates the incorporation of external analytics models from R or Python, empowering users to leverage advanced statistical and machine learning algorithms directly within their dashboards.
Practical insights for enterprise users
While Tableau offers some capabilities for basic data manipulation, its functionality is primarily geared toward analyzing data that is already properly structured, formatted, and cleaned. That's why enterprise users often use custom SQL or third-party data transformation solutions to pre-process data before it hits Tableau. This can also significantly improve performance by reducing the load on Tableau and ensuring that only relevant data is imported.
3. Domo
Data integration capabilities
Another robust enterprise BI solution is Domo. The platform provides pre-built API connectors to over 1,000 data sources, including niche industry-specific systems. The platform also provides the Connector Dev Studio IDE to build custom connectors, data uploading features, and other options to ingest massive volumes of data.
Data transformation and analysis
Domo offers a range of data transformation tools designed to suit different levels of technical expertise and analytical needs:
- Drag-and-drop Extract, Transform, Load (ETL) allows users to define and sequence operations visually and perform easy transformations like map values, split columns, filter rows, etc.
- SQL-based ETL allows analysts to perform complex transformations and combine datasets.
- The Data Science Suite, supporting R and Python, serves advanced users aiming to conduct complex analyses or develop predictive models. Integration with tools like Amazon Sagemaker Autopilot facilitates the deployment of machine learning models directly within Domo.
It's crucial to acknowledge that Domo's comprehensive data transformation tools come with a steep learning curve. New users often underestimate the time and resources required to become proficient.
Data visualization and customization
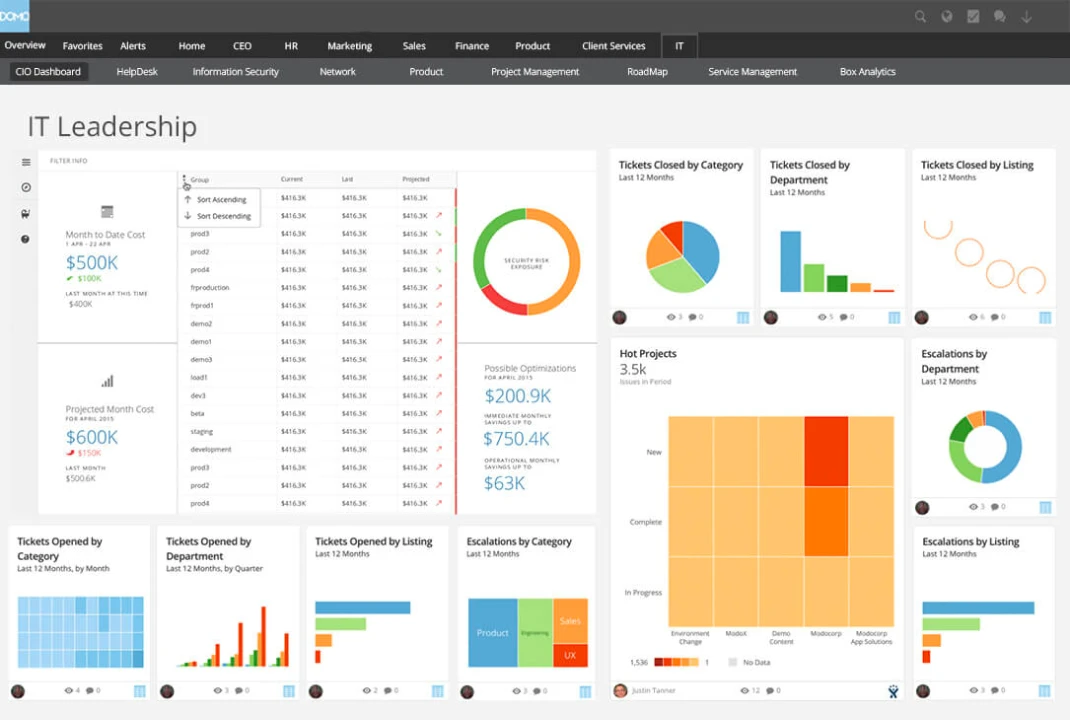
Similar to other enterprise business intelligence tools on the list, Domo supports a wide array of visualization types, from standard line and bar charts to more sophisticated options like bubble charts, radar plots, and custom visualizations developed through Domo's Visualization SDK. This SDK enables analysts to create visual components tailored to their specific analysis needs.
Another notable feature is Domo's mobile-first design ethos, ensuring that dashboards and visualizations are fully optimized for display on mobile devices. This consideration is particularly valuable for executives and field teams who require access to business insights on the go. Additionally, Domo incorporates collaborative features directly into its visualization suite, allowing users to share insights, annotate dashboards, and even initiate discussions within the platform.
AI and advanced analytics
Domo incorporates AI and machine learning to offer predictive analytics and automated insight generation. Its AI tool, Mr. Roboto, enables forecasting, pattern identification, and anomaly detection, offering actionable intelligence that can significantly influence strategic planning. For example, it can predict sales trends or highlight unexpected data shifts, like a drop in website traffic, enabling businesses to act swiftly.
Practical insights for enterprise users
Domo's wide array of enterprise analytics tools is both its greatest asset and challenge. The platform's rapid introduction of new features can sometimes leave existing tools in the dust, leading to concerns about the longevity and relevance of investments in specific Domo components. Users have expressed frustrations over what they perceive as neglected updates and inadequate responses to feedback.
Moreover, interactions with Domo's customer service highlight a gap in their technical understanding, as representatives often lack the product knowledge necessary to resolve complex issues.
4. Qlik
Data integration capabilities
Qlik supports a wide range of data sources, including cloud-based applications, databases, and on-premise systems, enabling enterprises to create a unified data repository.
What sets Qlik apart is its associative engine, which allows users to explore connections across all their data without being limited by pre-defined queries or linear exploration paths. This feature is particularly valuable for marketing decision-makers who need a holistic view of data to uncover insights that drive strategic decisions.
Data transformation and analysis
At the heart of Qlik's data transformation capability is its script editor. Analysts can leverage this tool to perform complex data transformations including conditional logic, aggregation functions, and data grouping, which are essential for preparing marketing data that often comes from varied sources and formats.
One of Qlik's lesser-known but highly valuable features for marketing data analysis is its ability to handle time-series data effectively. This is crucial for analyzing trends over time, such as customer behavior changes or seasonal impacts on sales. Qlik allows for the creation of calendar tables directly within the script editor, facilitating the comparison of data across different periods with ease.
Data visualization and customization
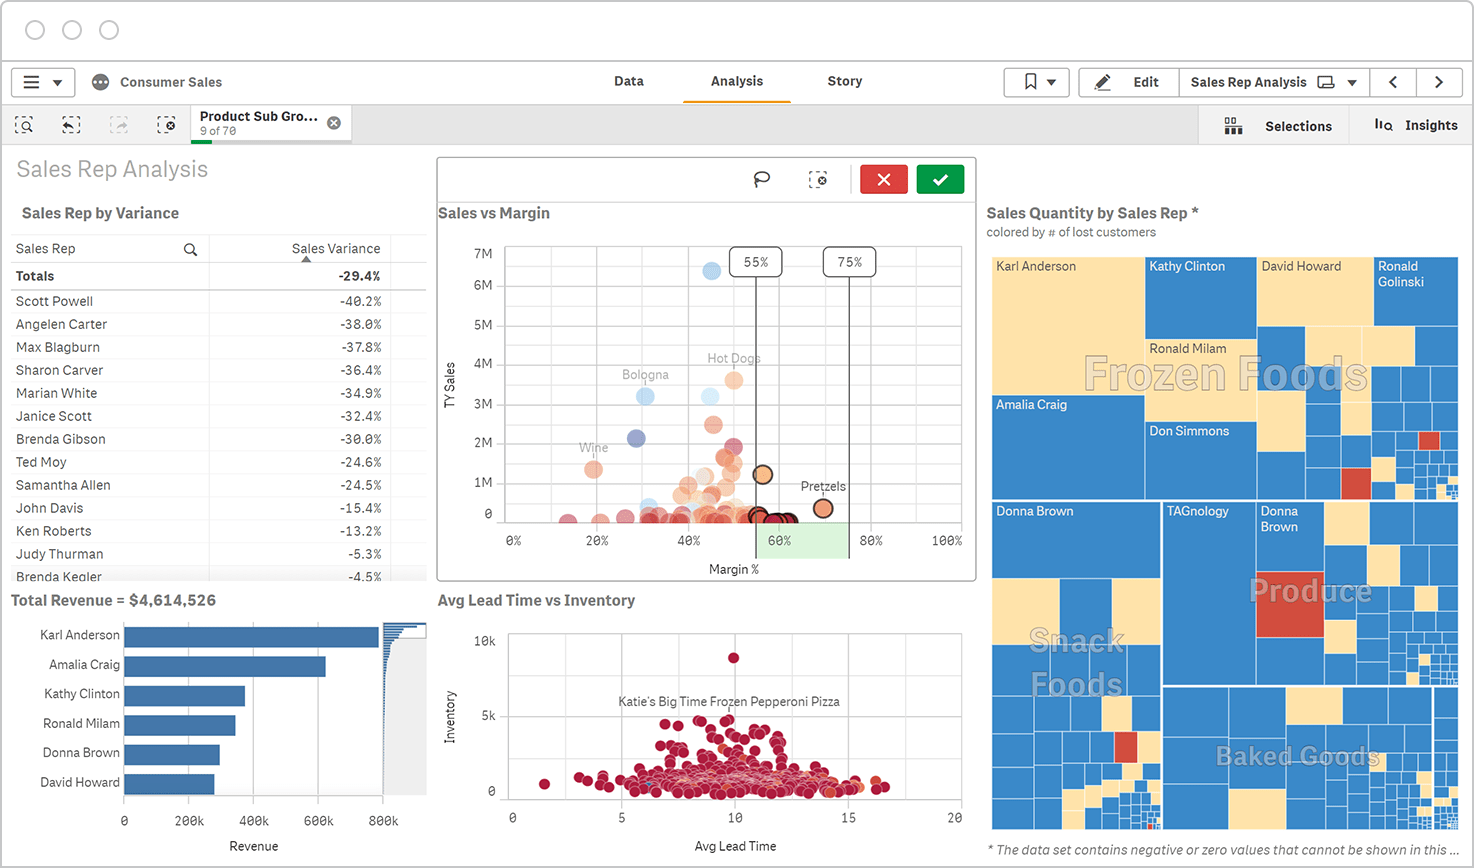
What distinguishes Qlik in the visualization space is its associative engine, which allows for dynamic data exploration. Users can interact with visualizations to drill down, filter, and explore data from multiple angles, all in real-time. This interactive capability is particularly valuable for marketers who need to delve deep into customer data, campaign performance, and market trends to extract actionable insights.
Qlik offers extensive customization options, enabling users to design dashboards that highlight the most relevant KPIs and insights for their specific objectives. Beyond just customizing the appearance, users can embed advanced analytics and predictive models directly into their dashboards.
AI and advanced analytics
The Insight Advisor is a prime AI-powered Qlik feature. It acts as an AI-powered assistant that generates automated insights, suggests associations, and recommends visualizations based on the data at hand.
The Advisor uses natural language processing (NLP) to understand user queries in plain language. This allows marketing professionals to ask complex questions about their data and receive insightful answers, simplifying the data analysis process for users with varying levels of expertise.
Qlik emphasizes AI governance, providing a framework for managing data ethics, privacy, and security within the AI functionalities. This is crucial for enterprises that handle sensitive customer data, ensuring that AI-enhanced analytics are conducted in a secure and compliant manner.
Practical insights for enterprise users
Qlik's unique associative model sets it apart in the enterprise analytics space, offering a more fluid and intuitive data exploration experience compared to traditional query-based BI tools. This model allows users to make connections between data points across multiple sources without predefined queries, enabling deeper insights and revealing hidden trends. However, mastering Qlik's environment, particularly its scripting language for data loading and transformation, requires a steep learning curve.
5. Looker
Data integration capabilities
Being a Google product, Looker Studio has seamless integration with Google services such as Google Analytics, Google Ads, Campaign Manager 360, and BigQuery, allowing for effortless aggregation of digital marketing and cloud data.
Native integration with Google BigQuery enables analysts to use BQML (BigQuery Machine Learning) to build and execute Machine Learning models using SQL queries. Later on, you can visualize the output of models in Looker.
Beyond Google's ecosystem, Looker Studio supports integration with external databases, CSV files, and a variety of third-party platforms, providing a total of 800+ pre-built data source connectors.
Data transformation and analysis
At the core of Looker's data manipulation capabilities is LookML, a specialized modeling language that enables users to define and transform data within the platform. LookML provides a flexible, code-based approach for creating complex data models, ensuring that analysts can tailor data structures and relationships to fit specific analytical needs.
Additionally, Looker Studio leverages Looker Blocks, pre-built pieces of code that further streamline the data modeling process. These Blocks can be used for various purposes, from defining common data patterns to integrating third-party data sources, significantly reducing development time and effort. This modular approach allows for the quick assembly of custom analytics solutions, making it easier for businesses to adapt to changing data requirements.
Beyond LookML and Looker Blocks, Looker Studio offers a range of features to support advanced data analysis. These include powerful aggregation functions, customizable metrics, and the ability to perform cohort analysis and funnel analysis directly within the platform.
Data visualization and customization
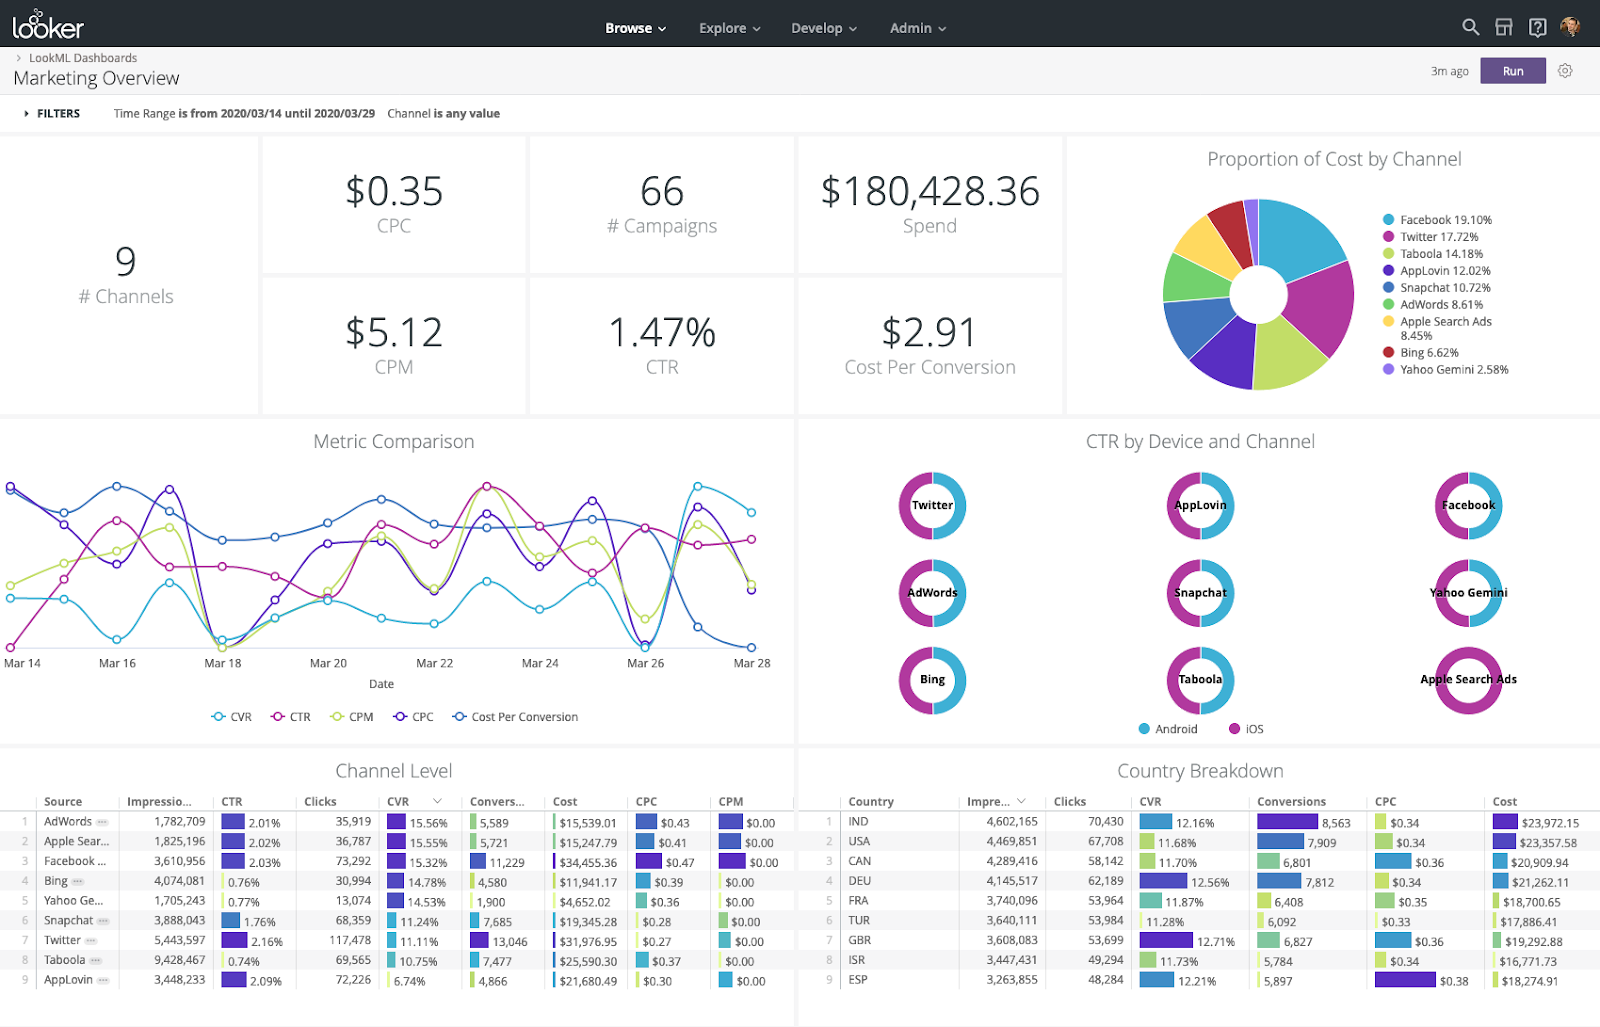
The platform offers a wide array of visualization options, from basic charts and graphs to more complex and dynamic visual representations like heat maps, scatter plots, and custom visualizations developed via Looker's extensive API.
Looker allows users to tailor every aspect of their reports and dashboards. From adjusting colors and fonts to align with branding guidelines to configuring the layout for optimal data presentation, Looker Studio provides the tools needed to create professional and engaging data visualizations. Moreover, interactive features such as filters and drill-downs enhance the user experience, enabling end-users to explore data in a self-service manner.
AI and advanced analytics
Looker Studio leverages AI and advanced analytics to enhance data exploration and insight generation. A notable feature, Duet AI, integrates machine learning directly into the analytics workflow, offering predictions, trend analyses, and smart data insights.
Beyond Duet AI, Looker Studio incorporates a range of AI functionalities designed to optimize the analytics process. These include automated anomaly detection, which alerts users to significant deviations in data trends, and natural language processing for intuitive data querying.
Practical insights for enterprise users
Enterprise users considering integrating Looker into their analytics suite should be aware of specific challenges, particularly regarding large datasets and scalability. Looker's performance can be impacted when handling extremely large volumes of data, leading to slower query times and potential delays in insight generation. This issue is pronounced in complex data models or when executing numerous concurrent queries.
Insightful Visualizations Start with Clear Data
Each of these enterprise business intelligence platforms will most certainly simplify complex analysis and make discovering insights easier far beyond what spreadsheets have to offer.
To make the right choice, consider factors like company size, budget constraints, specific use cases, and the data analysis experience within your team.
But don't forget that business intelligence and data visualization start with making sure your data is well-organized and of high quality. That's where tools like Improvado step in.
Improvado automates data aggregation from over 500 marketing and sales sources, streamlines data preparation, and seamlessly integrates with any enterprise BI solution mentioned on the list.
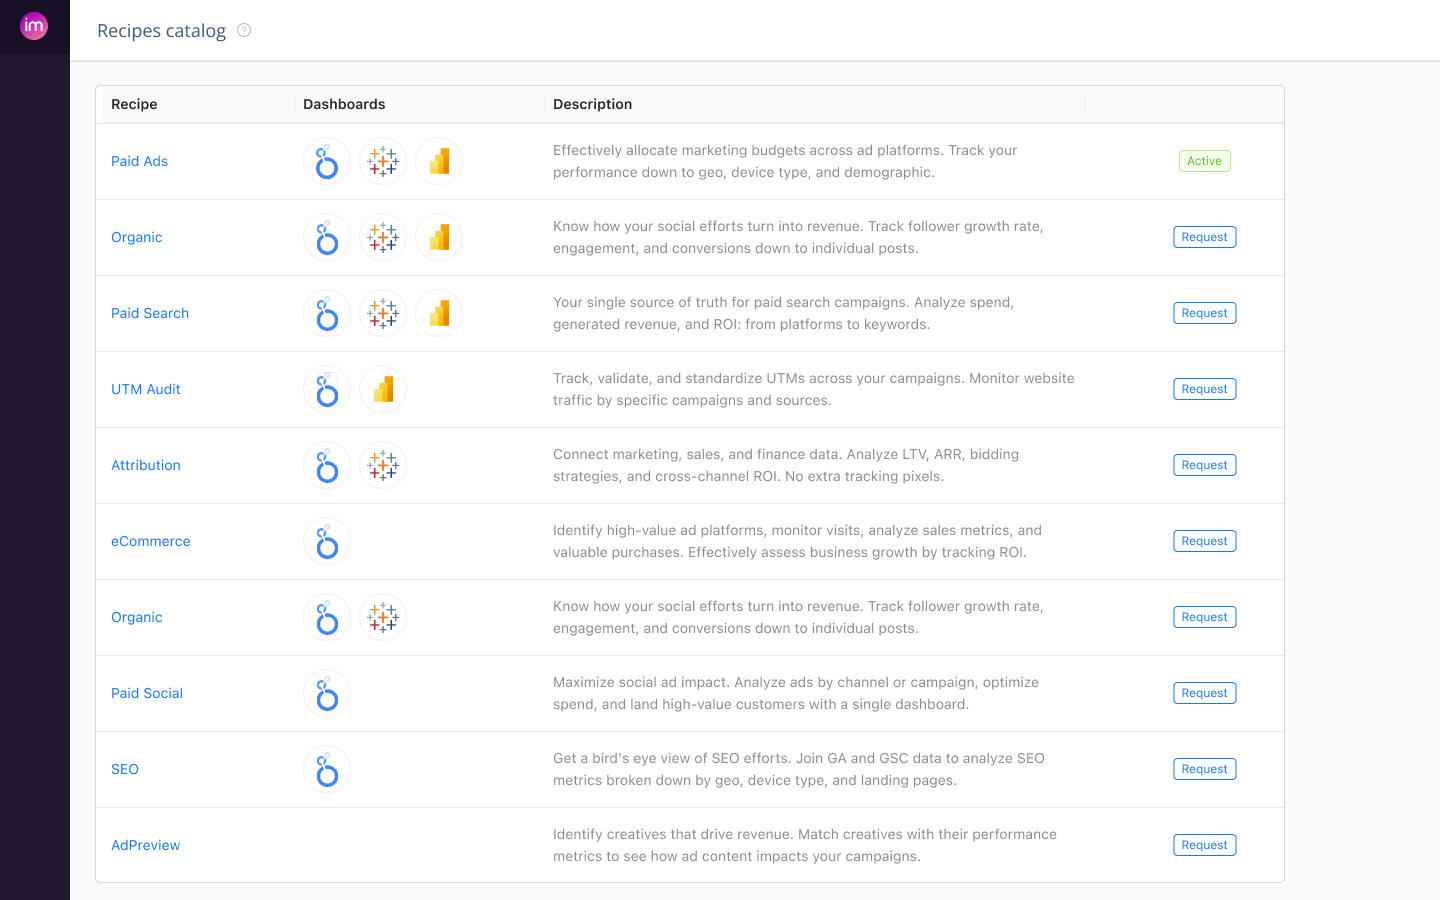
With pre-built recipes tailored for specific marketing scenarios, such as analyzing ad spend or attributing sales revenue, Improvado minimizes manual effort and reduces the risk of errors or misleading visualizations. This ensures a smoother transition to data analysis, enabling businesses to focus on deriving actionable insights.
Book a demo call to learn more about Improvado and how it can simplify business intelligence at an enterprise level.
.png)
.jpeg)


.png)
