Recent stats show that many companies waste 40-60% of their digital advertising budgets. Considering rising costs and intensifying competition, that’s an incredible budget drain. Poor Google Ads analytics can lead to further inefficiencies, requiring additional investments just to maintain past performance—let alone improve upon it.
This article explores how to effectively analyze Google Ads performance, from evaluating keywords and conversion metrics to understanding attribution and user behavior, helping marketers maximize their ad spend and drive better results.
1. Analyze Campaign Structure and Segmentation
Campaign structure directly impacts performance visibility and resource allocation, so let’s start Google Ads analytics from here.
Key segments to analyze
- Geography: Evaluate ad performance across regions to identify high-performing locations and underperforming areas. Use Google Ads’ geographic performance reports to analyze metrics like ROAS, CPC, and conversion rates.
- Audience types: Compare the effectiveness of different audiences. Remarketing often delivers high conversion rates but saturates quickly, while in-market audiences require subcategory analysis to identify top-performing segments. Custom intent allows precise targeting but needs regular refinement.
- Devices: Analyze campaign performance across mobile and desktop. Desktop users might have higher conversion rates in certain industries, while mobile often drives more clicks but lower conversion rates. Adjust device-level bid modifiers to align with device performance.
- Products or categories: Segment campaigns by product line or service category to identify which offerings generate the most engagement or conversions. Evaluate the effectiveness of ad copy, landing pages, and targeting for each category to optimize low-performing segments.
- Keyword management: Review keyword performance to ensure relevance and efficiency. Ad groups should contain 5 to 15 closely related keywords to maintain focus and match user intent. Overloaded or unrelated keywords dilute Quality Score and hinder performance analysis.
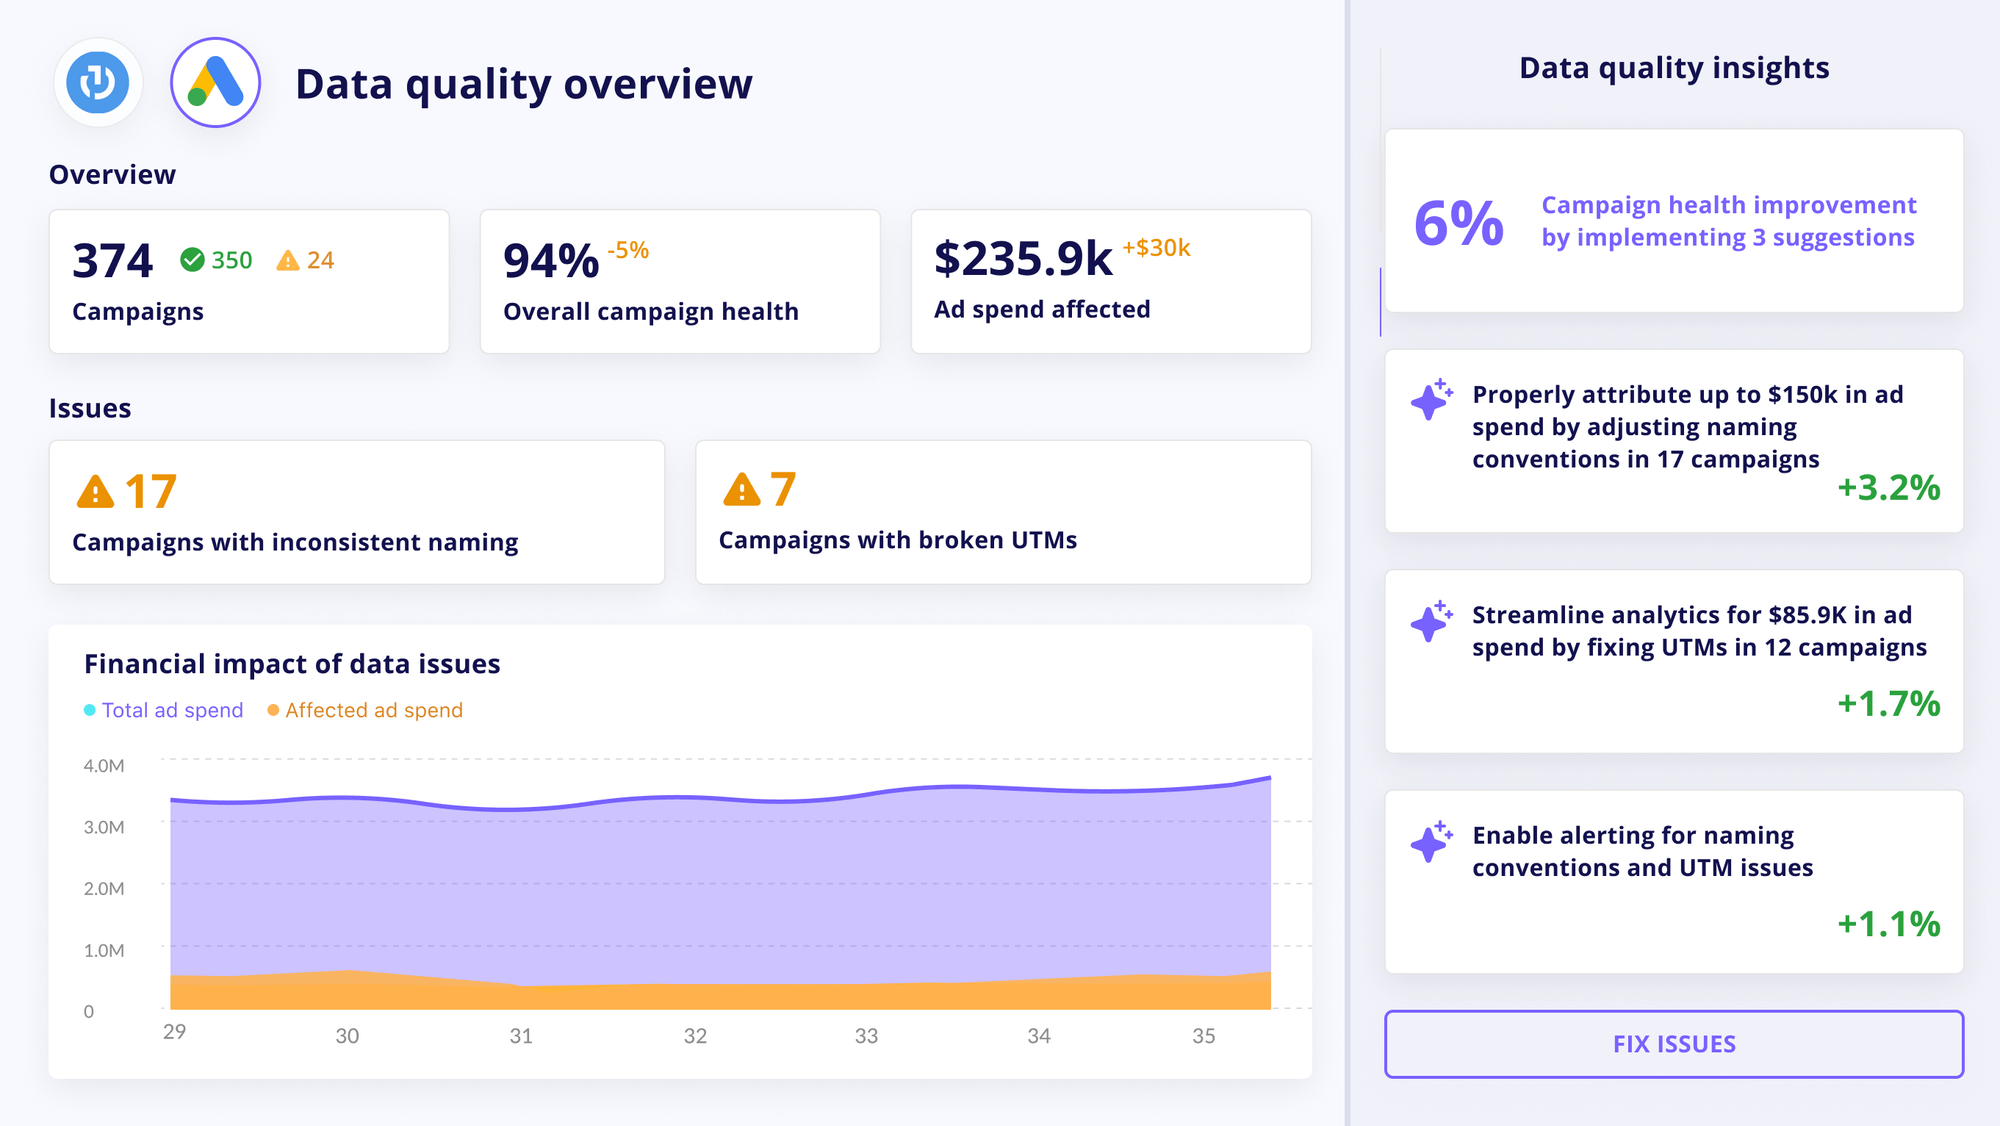
A structured setup—with validated targeting parameters, aligned budgets, proper UTMs and taxonomy, and accurate configurations—provides a foundation for meaningful performance analysis. It also minimizes the risk of ad spend wastage and costly mid-campaign adjustments.
2. Break down Conversion Metrics
Analyzing conversion metrics provides critical insights into the efficiency and impact of your Google Ads campaigns.
Here are key Google Ads metrics to assess both engagement and financial performance at a granular level.
CTR (Click-through rate)
CTR is a high-level indicator of ad engagement and cost-effectiveness:
- A high CTR often suggests strong relevance between your ad and the user’s search intent. Higher CTR typically results in cheaper ad clicks.
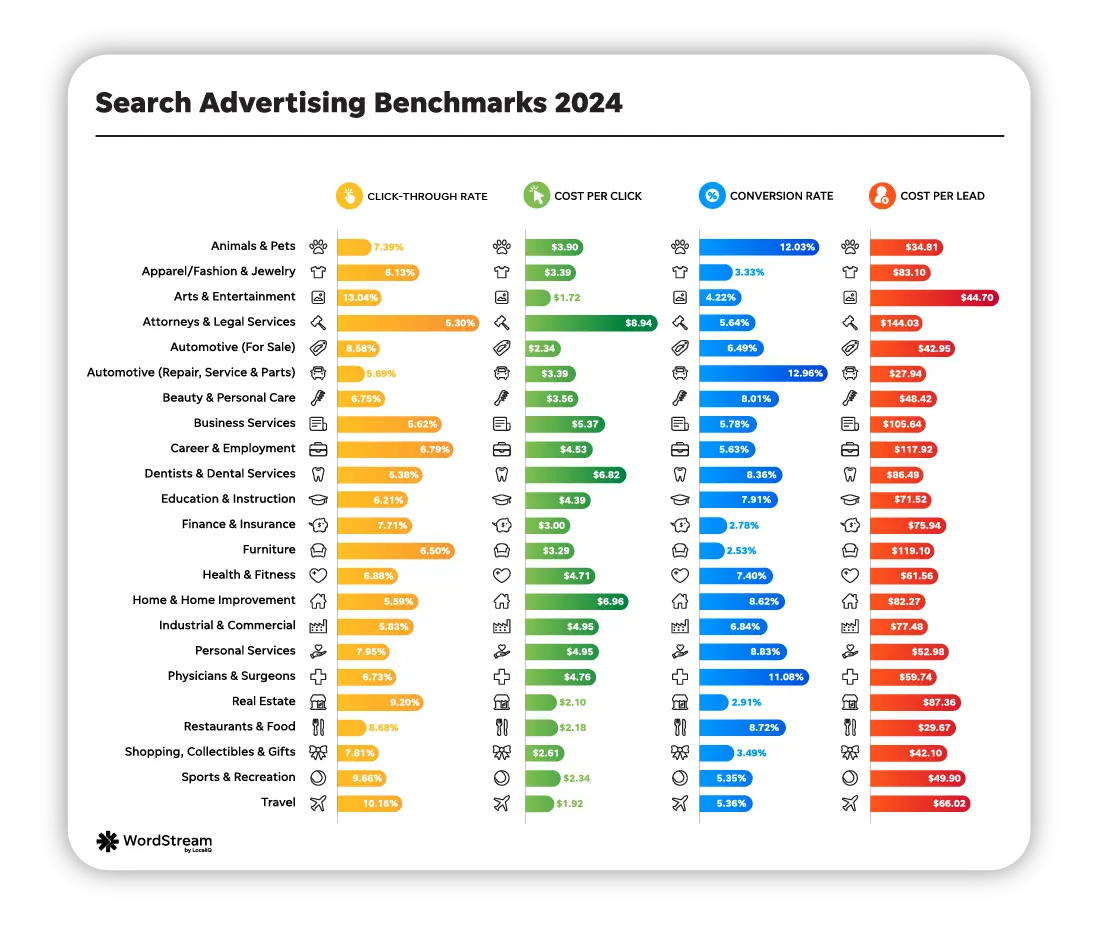
- Moderate click-through rate is typical for competitive, non-branded campaigns targeting broad or high-intent keywords.
- A low CTR signals issues with ad relevance, targeting, or visibility.
CTR trends can also indicate changes in competitive landscapes or audience behavior. A sudden drop in CTR may signal the need for refreshed ad copy and creatives or tighter targeting.
CTR is also a proxy for your competitive position in the auction. Monitoring CTR alongside metrics like impression share (that we will talk about later in the article) clearly shows how effectively your ads compete for attention in key markets.
Conversion rate
While CTR shows how effectively your ads attract clicks, conversion rates reveal what happens after users land on your page.
Low conversion rates often indicate issues with landing page relevance, load time, or alignment with user intent.
Break down conversion rates by ad group or campaign to identify specific elements impacting ad performance and to pinpoint areas for improvement.
- Start by analyzing conversion rates at the campaign level to determine which campaigns underperform relative to benchmarks or similar campaigns.
- Drill down to the ad group level to evaluate how targeted messaging, keyword relevance, or audience segments affect conversions.
Conversion volume
High conversion volume often indicates opportunities for scaling, especially if paired with a cost per conversion (CPC) that aligns with profitability targets.
At this point of Google Ads analysis, it’s important to analyze conversion volume and CPC across campaign segments, discussed earlier. Look for patterns and optimize campaigns accordingly.
Conversion types and value
Purchases, quote requests, and newsletter signups, for example, represent varying levels of intent and impact on revenue. Segmenting these conversions allows you to differentiate high-value actions, such as purchases or lead forms, from lower-priority ones like newsletter signups.
To assess conversion value, assign a monetary or relative weight to each conversion type based on its contribution to revenue or pipeline growth.
3. Analyze Competitive Performance and Identify Opportunities to Scale
This Google Ads metric helps assess your competitive position and identify whether it’s worth investing more into a campaign.
Branded campaigns
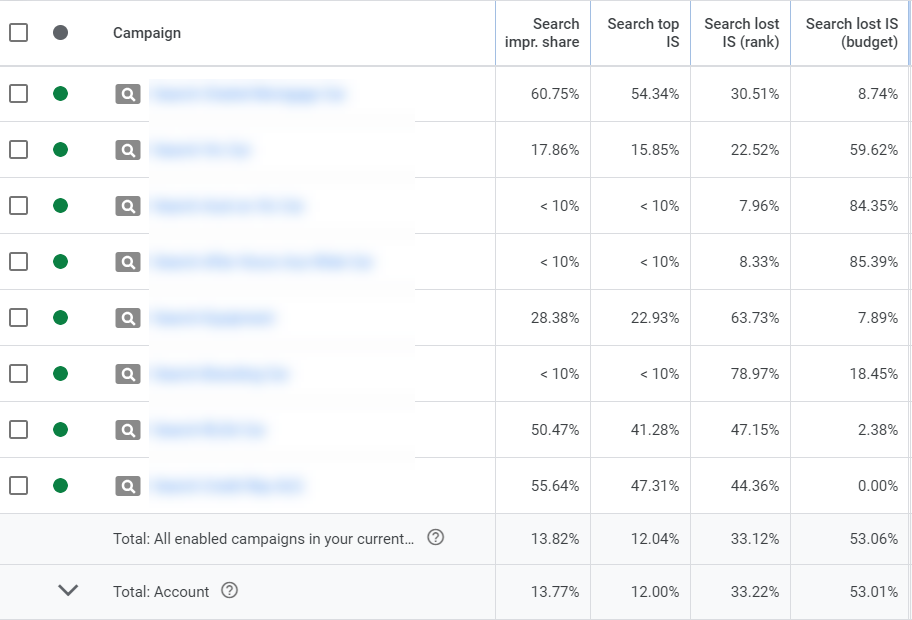
For branded campaigns, a Share of Impressions between 90-100% indicates strong coverage, ensuring your ads dominate for your own keywords.
If the share drops below 80%, it suggests competitors are outranking you on your own terms, which may warrant higher bids or expanded budgets.
Competitor branded keywords
When targeting competitor-branded keywords, achieving a Share of Impressions between 34-50% is reasonable, given the competition for these high-value terms.
Product campaigns
In product campaigns, impression share provides insights into your competitive position within specific categories, such as “running shoes” or broader terms like “sportswear.” The volume and specificity of keywords play a significant role in determining both achievable Share of Impressions and scaling potential.
- For high-volume, broad keywords, such as “sportswear,” the competition is typically intense, making it challenging to achieve a dominant Share of Impressions without significant budget investments. Even a moderate share in this context, such as 30-50%, can be highly effective if paired with efficient cost per click (CPC) and strong conversion rates.
- For low-volume, highly specific keywords, such as “men’s waterproof trail running shoes,” achieving a higher Share of Impressions—often exceeding 70%—is more feasible due to reduced competition. However, a high share in these niche categories may signal limited opportunities for growth. Scaling here typically involves expanding into related product categories, testing broader match types, or identifying adjacent keyword opportunities that share similar intent.
4. Analyze Keyword and Search Term Performance
Thorough keyword and search term analysis is critical to understanding how your ads perform.
Here's one analysis framework that will help deepen your understanding of Google Ads performance.
Begin by regularly reviewing keyword performance trends and segment keywords into two categories:
- Effective keywords: Those with strong ROI, acceptable cost per click and cost per conversion, and alignment with campaign objectives.
- Ineffective keywords: Those consuming budget but failing to generate conversions or simply mismatched keywords.
Establish weekly check-ins to review the data and remove irrelevant keywords.
At the end of the reporting period, calculate the proportion of your ad budget spent on relevant versus irrelevant keywords.
For instance, if 20% of your budget was wasted on ineffective keywords, this highlights a significant opportunity to optimize spend allocation.
By comparing these figures over time, you can track improvements in budget efficiency as irrelevant keywords are removed. This iterative approach allows you to maximize the efficiency and Google Ads ROI.
5. Understand Attribution and Assisted Conversions
Attribution analysis is essential for determining how your Google Ads campaigns contribute to overall results and identifying whether they are driving incremental growth or merely capturing existing demand.
Many campaigns, especially those focused on awareness or engagement, play a supporting role in the customer journey, influencing eventual conversions without directly driving last-click results. Understanding these contributions ensures smarter budget allocation and maximized ROI.
Campaign-level contributions
Start by examining top-of-funnel campaigns, such as display or video ads. These campaigns are often designed to build awareness and nurture leads, rather than drive immediate conversions.
For example, a display campaign with a high assisted conversion count but low direct conversions may indicate it successfully nurtures leads who later convert via branded search ads or retargeting ads.
Assessing key metrics like view-through conversions, engagement rates, and time lag between impressions and conversions can further clarify their role in influencing customer decisions.
Cross-campaign influence
Understanding how campaigns support each other across the funnel is critical for effective budget allocation. Metrics like interaction rate, cross-campaign assisted conversion percentages, and audience overlap are particularly useful here.
For example, a high number of assisted conversions in a video campaign supporting a branded campaign could justify increased spend on the video campaign, even if its last-click conversions are minimal.
Overlap in conversion sources
Cross-channel attribution analysis provides a broader context for how Google Ads interacts with other platforms in the customer journey, such as organic search or social media. High overlap in conversion sources may suggest that Google Ads is capturing demand already created by other channels.
For instance, if 70% of Google Ads conversions overlap with branded organic search, it could signal that users are being influenced by non-paid efforts but are ultimately converting through paid ads.
Conversely, low overlap suggests that Google Ads campaigns are generating unique contributions, driving customers who may not otherwise engage.
6. Evaluate effectiveness of Google Ads automated strategies
This step of Google Ads reporting is crucial if you rely on automated strategies. While these strategies operate autonomously, their setup and learning period demand careful oversight and detailed analysis to ensure optimal performance.
Google Ads automated strategies, like Target ROAS and Maximize Conversions, depend on machine learning to optimize performance. These strategies typically require 30-50 conversions per month to exit the learning phase and begin delivering consistent results.
During the initial two-week learning period, it’s essential to actively monitor performance, as campaigns often experience fluctuating costs and conversion rates.
In such cases, consider consolidating campaigns or ad groups with similar goals to pool conversion data. For instance, merging campaigns targeting overlapping audiences or similar products can provide the algorithm with the volume it needs to train effectively.
If conversion volume remains low despite consolidation, consider switching back to manual bidding strategies that provide more precise control over where and how much you allocate to campaigns.
By closely evaluating and managing the performance of automated strategies, marketers can ensure these tools deliver optimal results without unnecessary costs.
This analytics framework provides a clear path to evaluating Google Ads performance at a granular level, helping you uncover actionable insights and develop hypotheses for campaign optimization.
For those seeking additional support, Improvado offers a powerful marketing analytics platform combined with expert services to simplify and enhance your analytics process. Get a demo with Improvado to maximize your advertising efficiency through a data-driven approach.
.png)
.jpeg)


.png)
