
Dashboards: Click-to-Filter, Geo Maps, Sankey Charts, and More
Business Intelligence AI Agent
September 18, 2026 Dashboards · Product update
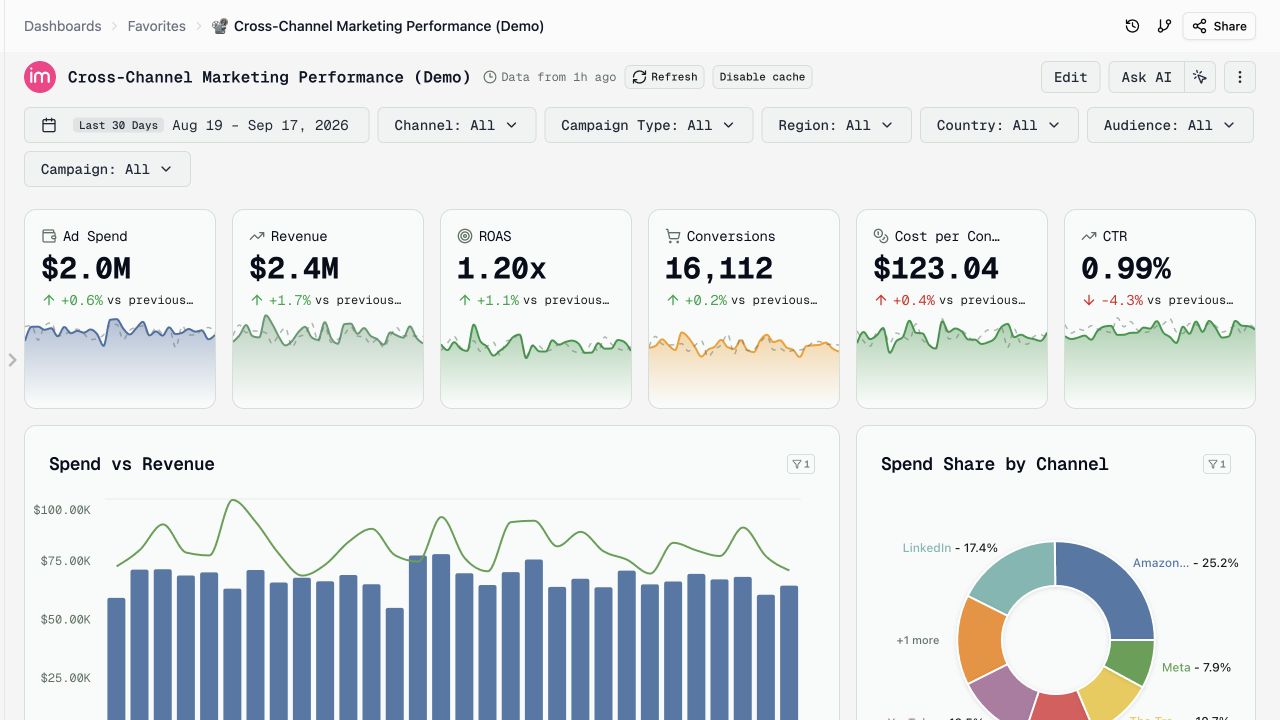
Explore your data with a click.
Select a bar, pie slice, or table row to filter compatible widgets.
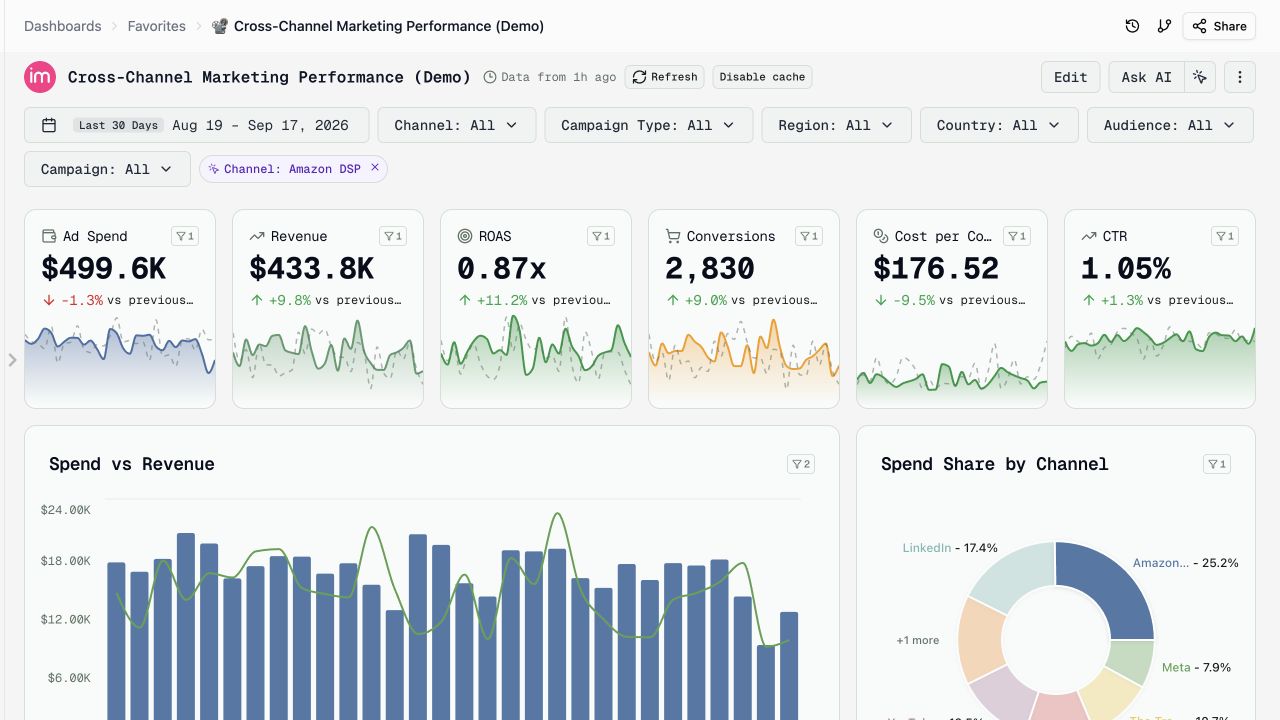
All channels → Amazon DSP
Explore data with a click, share filtered views, and reuse dashboards across workspaces.
- Click-to-filter. Select a bar, pie slice, or table row to filter compatible widgets on the page. Enable it in Customize. How it works →
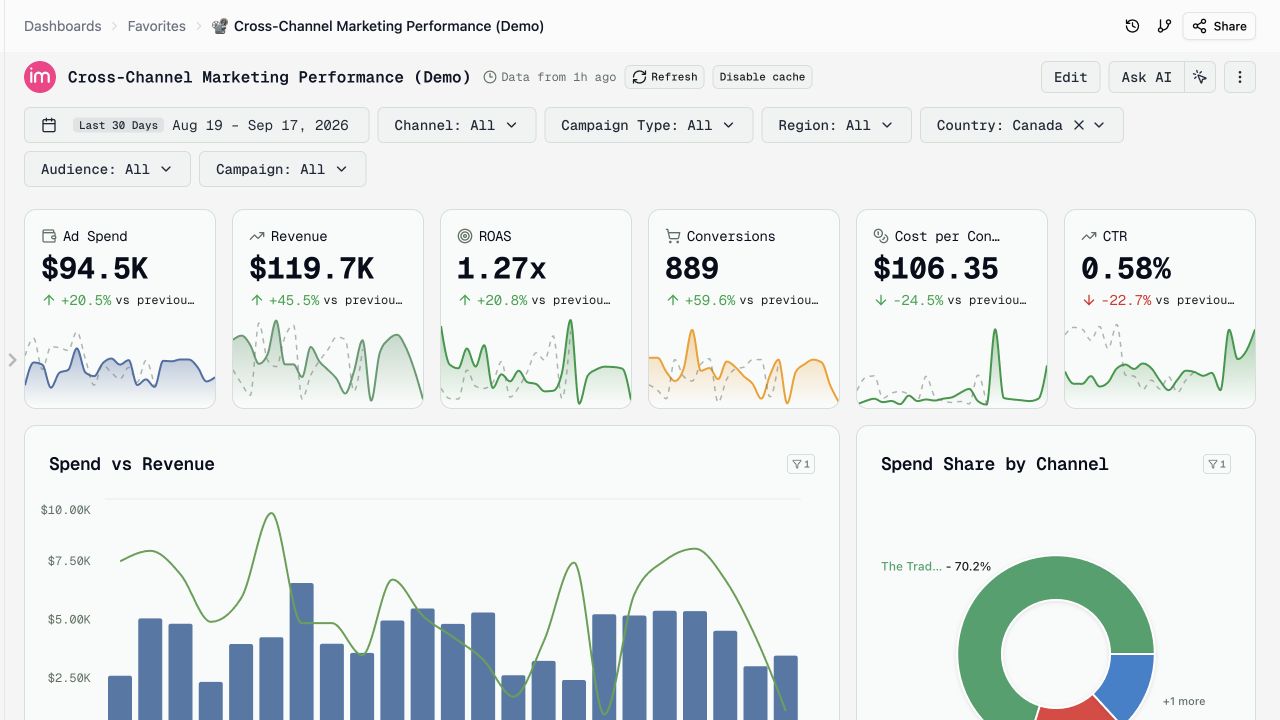
- Share a focused view. Links preserve your selected tab and dashboard filters. Temporary click-to-filter selections are excluded.
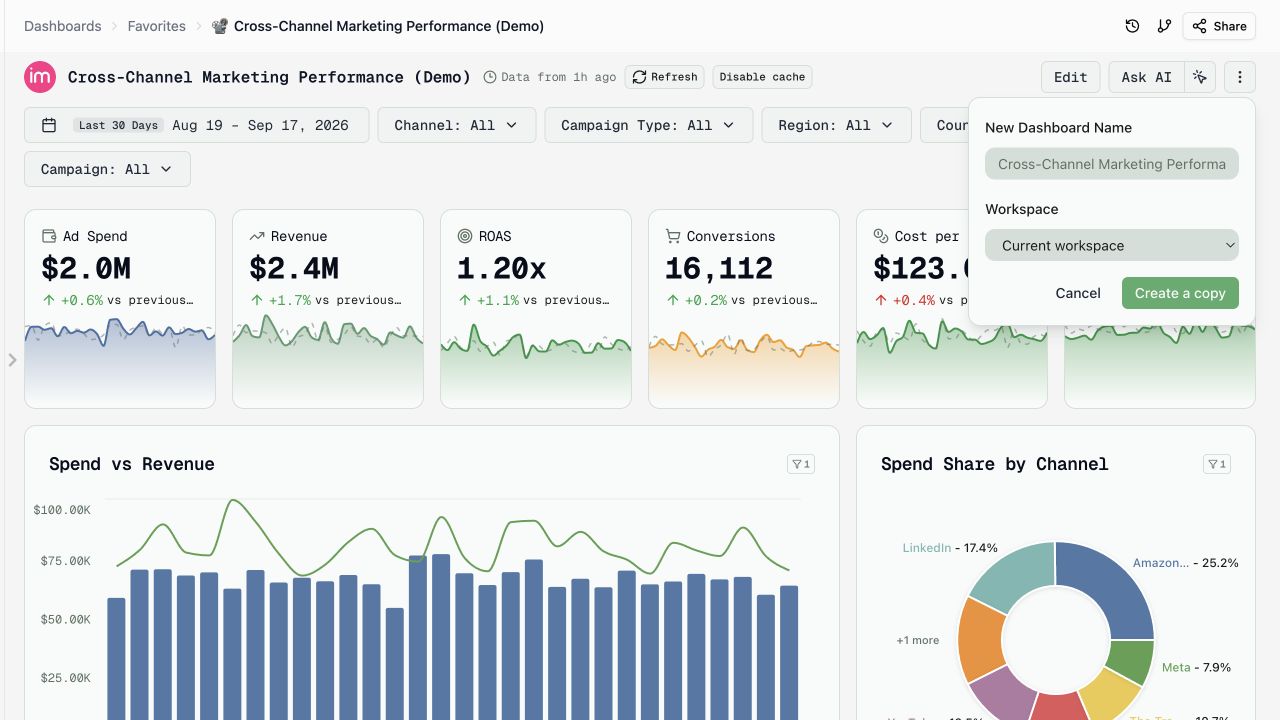
- Copy to another workspace. Choose a destination when duplicating a dashboard. Copies retain their original data source.
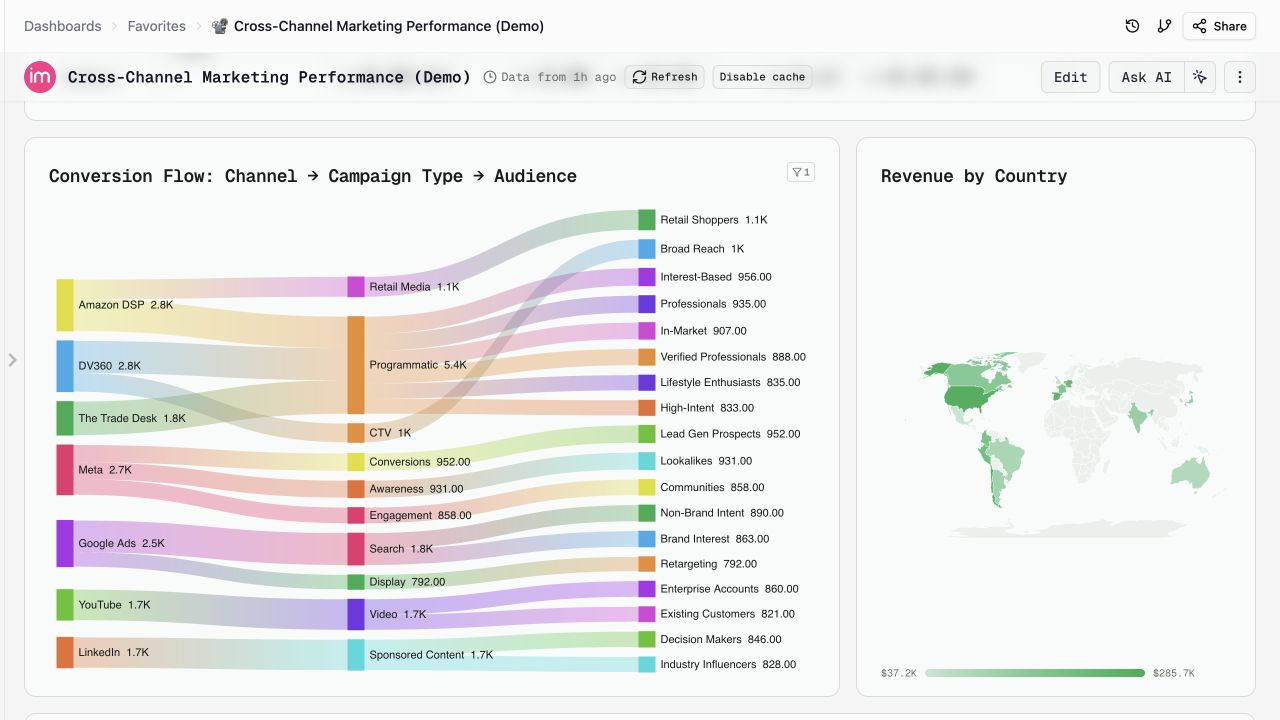
- Geo maps and Sankey charts. Compare countries or US states, and visualize flows across channels, campaigns, and audiences.
Other updates
- All tabs: include every page when duplicating or exporting to PDF or PowerPoint.
- Match dashboard layout: keep widgets arranged as they appear on the dashboard when exporting to PowerPoint.
- Color-coded table labels: show text values as colored tags and pin colors to specific values.
- Faster navigation: find overflow tabs in a searchable N more menu, and search both Customize and individual widget settings.
- Fonts and icons: choose a dashboard font and add an icon or emoji.
- Speed and UX: faster repeat visits with cached results (beta), freshness indicators, and smoother editing and filtering.
Was this page helpful?
Thanks for the feedback!
Questions? The Improvado team is always happy to help. Send us an email, contact your Customer Success Manager, or raise a request in the Improvado Service Desk.