
Export Dashboards to PowerPoint & Google Slides
Dashboards already export as branded PDF reports. Now they export as slide decks — and not as pictures of a dashboard. Charts keep their numbers, tables stay tables, text stays text.
Open a dashboard, click Export, set File Format to PowerPoint Presentation, and choose how the deck should be built.
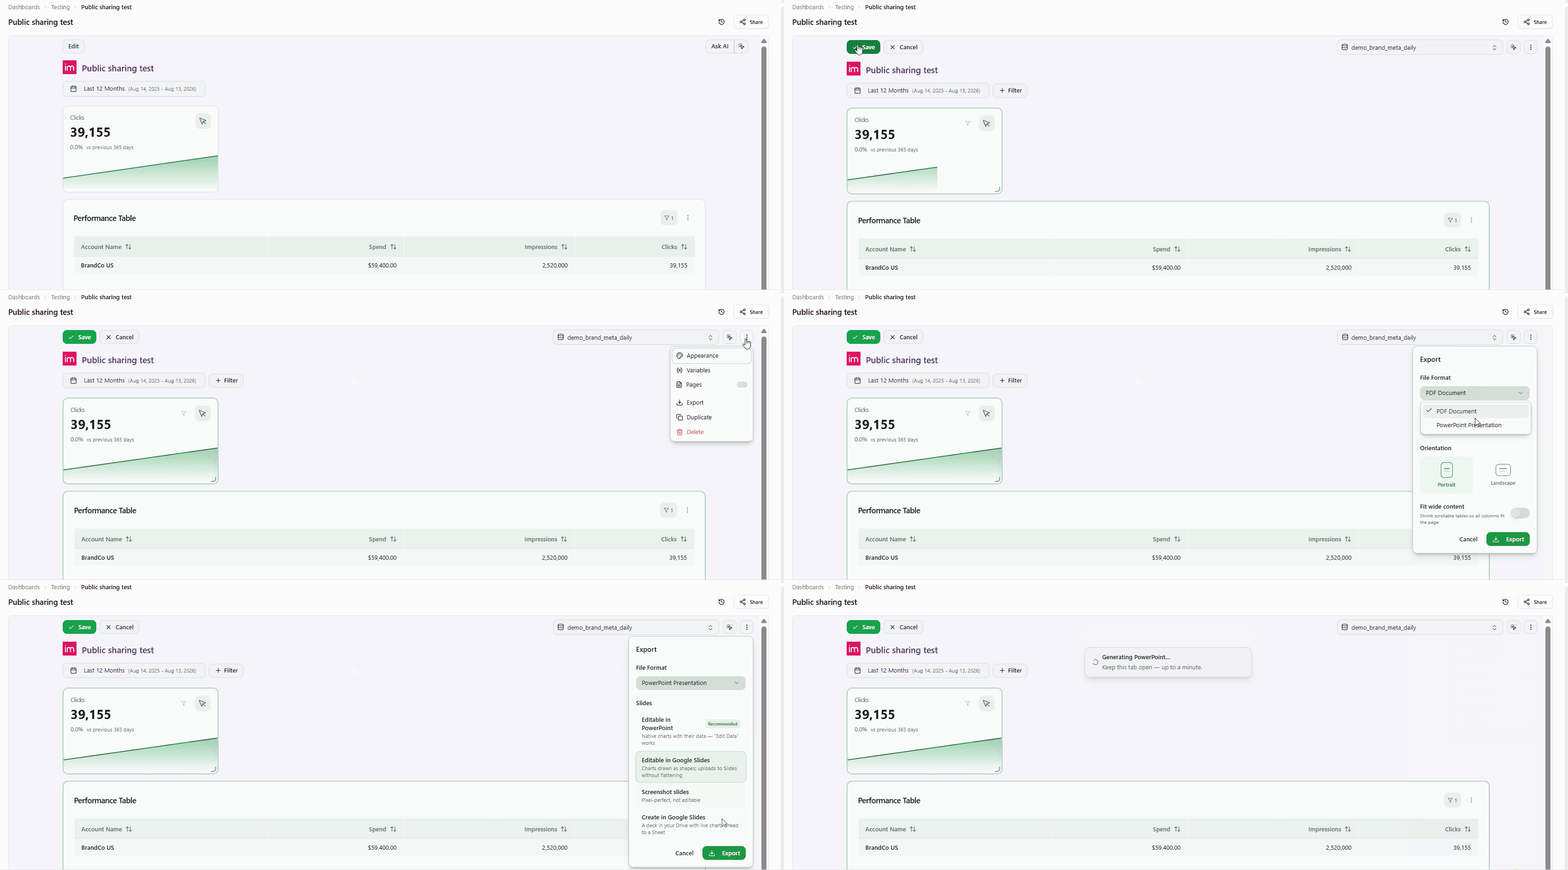
Four ways to build the deck
- Editable in PowerPoint — native charts that carry their own data. Right-click a chart, hit Edit Data, and the numbers are there.
- Editable in Google Slides — charts drawn as shapes, so Slides imports them without flattening them into images.
- Screenshot slides — pixel-perfect capture, for when the deck just has to look like the dashboard.
- Create in Google Slides — a presentation created straight in your Google Drive, with charts linked to a companion Sheet, so Slides' Update button stays wired to the data.
What carries over
- Your numbers, exactly as shown. The deck is built from what the dashboard renders — active filters and date range included — so a slide can never disagree with the screen it came from.
- Your look. Slide background, text, card and table colors follow the dashboard's appearance settings; charts and pies keep their own series and slice colors.
- KPI comparisons. Each KPI keeps its comparison line, not just the headline number.
- Every page, when you want it. On a multi-page dashboard, turn on Include all tabs to export all of its pages in one go, each behind its own section slide. By default, the tab you are viewing is exported.
Nothing quietly goes missing
Widgets with no slide equivalent — creative galleries, heatmaps, custom components — still get their own titled slide, as a picture of the real widget. So does a widget whose query is failing: the deck shows what the dashboard shows for it, instead of dropping it and leaving you to notice.
Why it matters
A dashboard exported as images is a dead end: every client tweak means going back to Improvado and exporting again. A deck that keeps its data is a starting point — reorder the slides, drop in a commentary slide, fix a label, adjust a chart, and send it. The reporting stays yours; the presentation becomes theirs.
Available now on every dashboard. Create in Google Slides needs a Google Sheets connection authorized read-write; the other three modes download a file and need no setup.