
Dashboard Lineage
Business Intelligence
August 21, 2026 "Where does this number actually come from?" used to be a manual answer: open the widget, find the view it reads, work out which recipe writes it, then track down the connection behind that. By the time you had the chain, you had lost the thread of whatever you were checking.
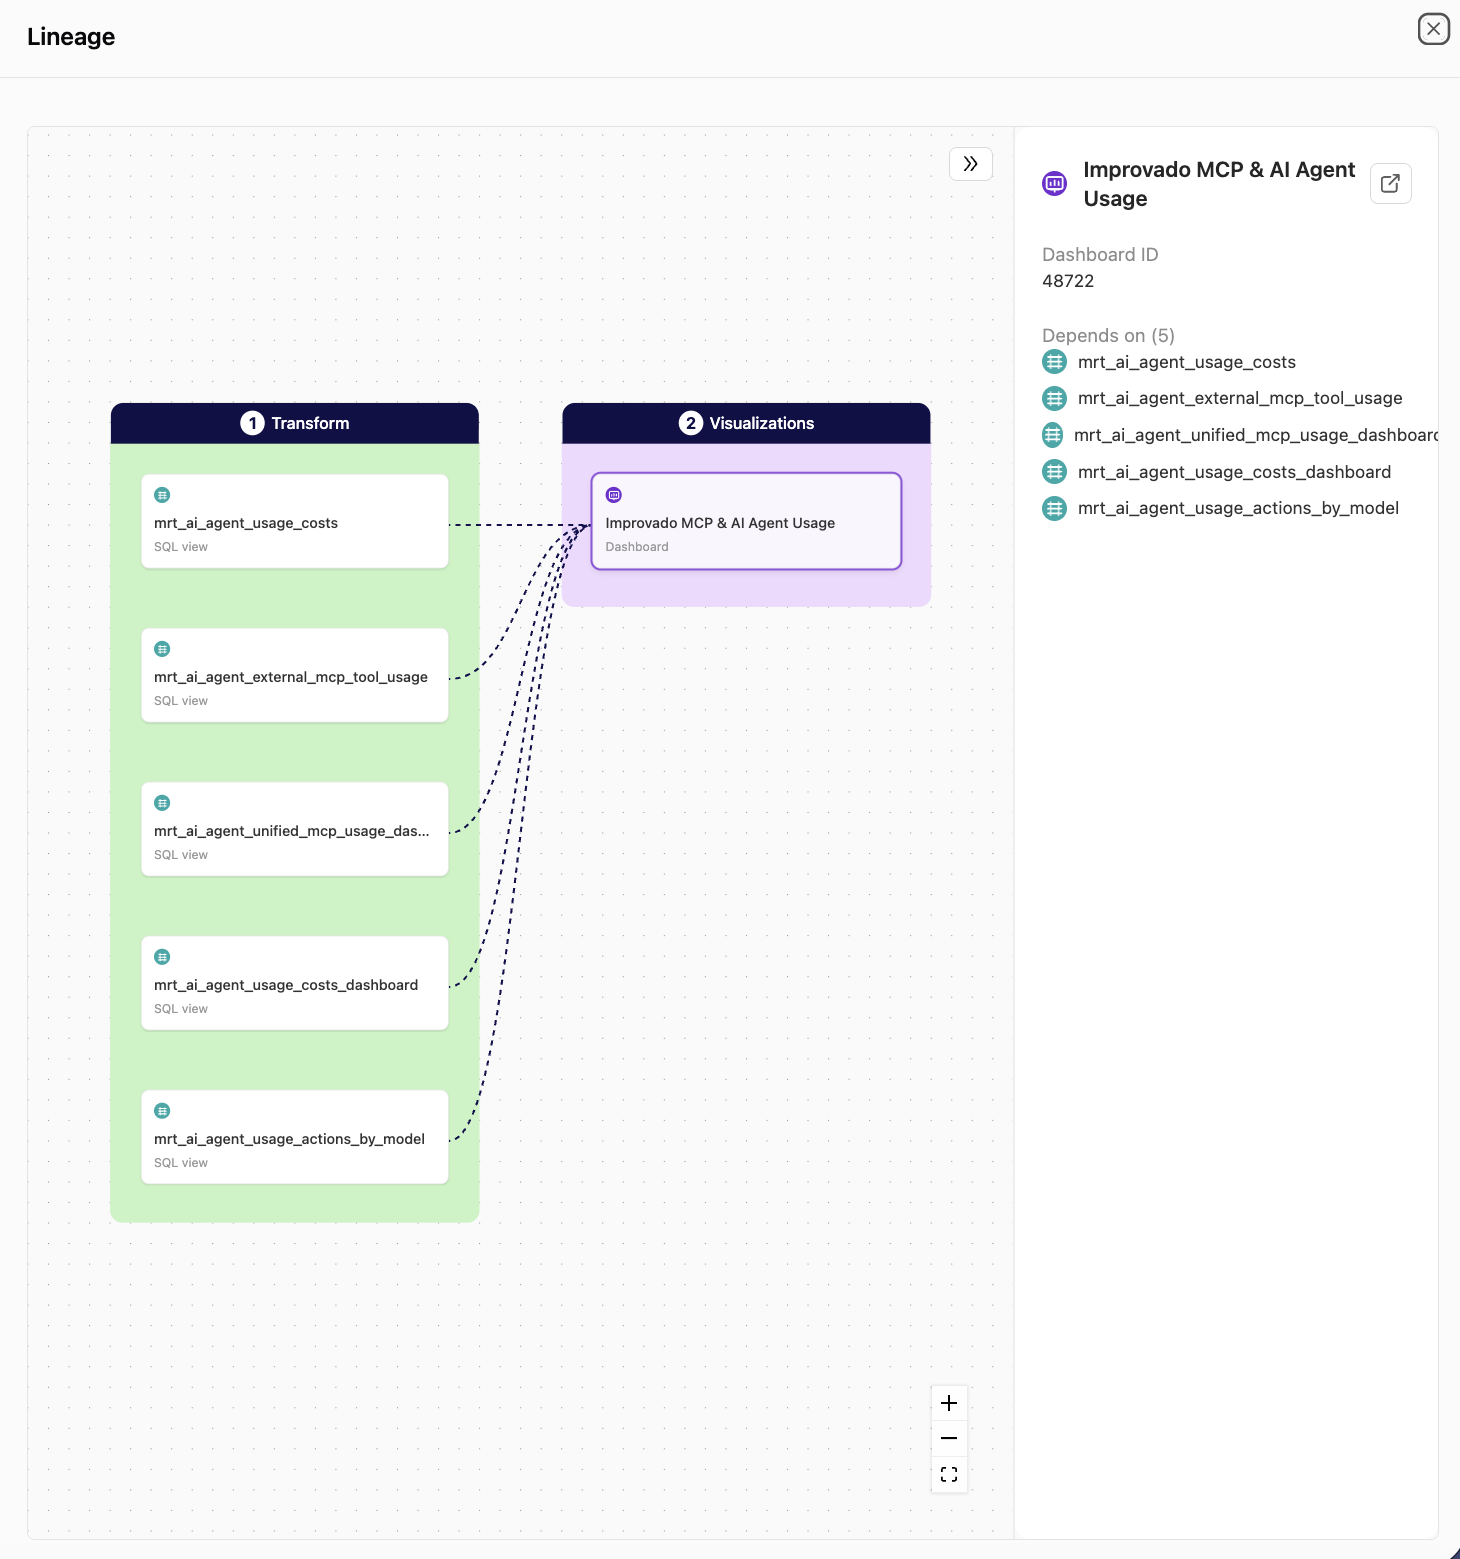
Dashboards now answer it themselves. Click the lineage icon in the dashboard header and a panel opens with the whole chain drawn out — the recipes and SQL views the widgets read, the data tables behind them, and the source connections the data arrived through.
What you can do
- See the whole chain at a glance — Extract, Transform and Visualizations laid out in order, with arrows into the dashboard.
- Check what a dashboard depends on before you change a recipe — the details panel lists every object feeding it.
- Jump straight to the source — open the data table, recipe or connection behind any card in a new tab.
- Hand it to someone new — the map explains a dashboard's plumbing without a walkthrough.
It is read-only and available on any dashboard you can open. Find it next to Share in the dashboard header.