




















Describe your TikTok Ads Dashboard.Your AI agent builds it in minutes.
Visualize TikTok Ads performance with a custom, AI-built analytics dashboard.
- Deploy in days, not months
- 1,350+ data sources
- SOC 2 · GDPR · HIPAA
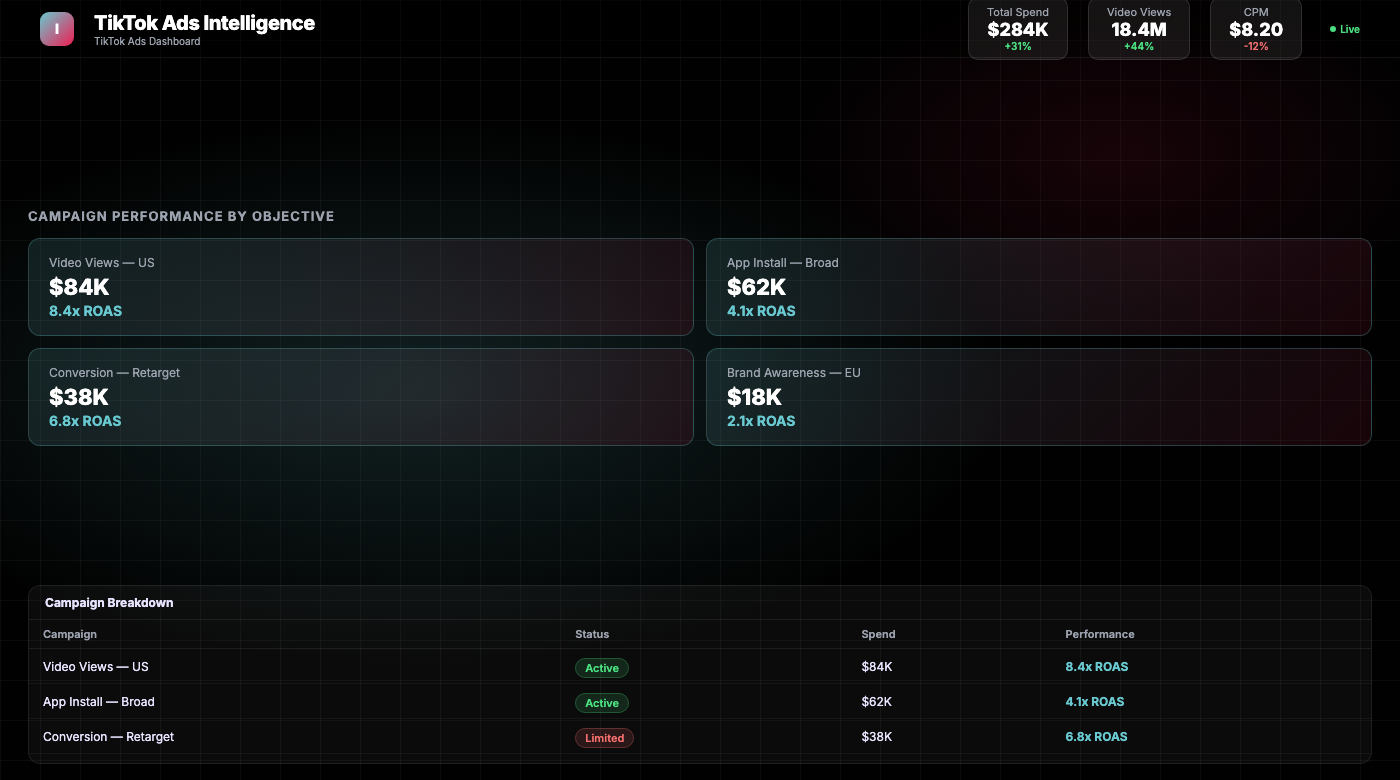
What the agent renders
Every view is live, editable, and connected to your real data.
TikTok Ads data scattered across platforms slows decisions.
The problem
Insightful dashboards will help you
- Identify top-performing TikTok creatives and reallocate budget to highest-ROAS ad groups before spend is wasted.
- Monitor video completion rates and engagement benchmarks to optimize creative length, hook quality, and call-to-action placement.
- Track cost-per-acquisition trends across campaigns and compare TikTok Ads efficiency against other paid channels in a single view.
- Share live, stakeholder-ready reports with your team or clients without manually exporting and reformatting data every week.
How to build this dashboard without Improvado
How to build this dashboard without Improvado
- Log into TikTok Ads Manager and manually export CSVs for each campaign, ad group, and creative — repeating this for every account and every reporting period you need to cover.
- Clean and reformat the raw exports in spreadsheets, reconciling inconsistent column names, handling API rate limit errors, and stitching together data from multiple ad accounts by hand.
- Build pivot tables and charts in Excel or Google Sheets, hard-coding date ranges and metric formulas that break every time TikTok updates its export schema or adds a new field.
- Manually refresh every data source each week before sending reports, spending hours on data wrangling instead of analysis — and hoping nothing has changed in the export format since last time.
The Improvado way
With Improvado, the AI agent handles everything.
- Connect: Authenticate your TikTok Ads account in one click — Improvado instantly discovers all campaigns, ad groups, and creatives across every linked account.
- Normalize: The platform automatically maps TikTok's raw fields to a consistent data model, resolving naming conflicts and aligning metrics with your other ad channels.
- Visualize: Describe the dashboard you need in plain language and the AI agent builds it — selecting the right charts, KPIs, and breakdowns without any manual configuration.
- Share: Publish a live, auto-refreshing dashboard link to stakeholders or embed it in your reporting stack — no more manual exports or stale screenshots.
From prompt to live dashboard in minutes.
No SQL, no data engineering tickets, no waiting. Describe what you need — the agent does the rest.
Connect your stack
Authorize your data sources via OAuth — ad platforms, CRM, email, analytics. The agent gets live read access in minutes, no engineering required.
Describe the dashboard
Type what you need in plain English: "TikTok Ads Dashboard, last 90 days, broken out by channel." The agent writes the queries, reconciles attribution across tools, and normalizes currencies.
Dashboard goes live
A fully interactive dashboard renders in your BI tool — Tableau, Looker, Power BI, or the Improvado UI. It refreshes automatically and stays current without re-prompting.
Great at answering questions. Not built to own a live dashboard.
| Claude / ChatGPT alone | Improvado AI Agent | |
|---|---|---|
| Data access | ✗ Manual CSV export | ✓ Live API connections |
| Data volume | ✗ ~25K row context limit | ✓ Unlimited warehouse queries |
| Output format | ✗ Text summary in chat | ✓ Interactive live dashboard |
| Auto-refresh | ✗ Re-prompt every session | ✓ Automatic, configurable schedule |
| Attribution model | ✗ None — trusts your CSVs | ✓ Cross-channel normalization built-in |
| Compliance | ✗ Data leaves your stack | ✓ SOC 2 · GDPR · HIPAA · your warehouse |
| Audit trail | ✗ No query log | ✓ Every query logged, replayable |
| Useful for exploration | Get your demo → |
Plugs into the stack your team already uses
Don't see yours? Explore all 1,350+ integrations →
Everything else you might ask
What metrics can I track in a TikTok Ads dashboard?
A TikTok Ads dashboard built with Improvado can track any metric available in TikTok Ads Manager, including impressions, clicks, CTR, CPM, CPC, spend, ROAS, CPA, conversions, video view rate, video completion rate, engagement rate, reach, and frequency. You can break down all metrics by campaign, ad group, creative, placement, device, audience segment, and date range. Improvado also supports custom calculated metrics — such as blended ROAS across channels or cost-per-qualified-lead — so your dashboard reflects the KPIs that matter most to your business.
How long does it take to build a TikTok Ads dashboard?
With Improvado's AI agent, a fully functional TikTok Ads dashboard can be up and running in minutes. You connect your TikTok Ads account, describe the metrics and layout you need in plain language, and the agent builds the dashboard automatically — no SQL, no manual chart configuration, and no waiting on a data engineer. More complex, multi-channel dashboards with custom metrics typically take under an hour to finalize.
Can I combine TikTok Ads data with other ad platforms?
Yes — Improvado supports 1,350+ data connectors, so you can combine TikTok Ads with Google Ads, Meta Ads, LinkedIn, Snapchat, Pinterest, and virtually any other paid channel in a single unified dashboard. All data is normalized into a consistent schema, enabling true cross-channel performance comparisons and multi-touch attribution analysis without any manual data blending. This makes Improvado ideal for teams that need a single source of truth across their entire paid media mix.
Other templates your agent can spin up
ABM Dashboard
Account-based marketing dashboard tracking engagement, pipeline influence, and deal velocity across target accounts.
View template →Amazon Performance Dashboard
All marketing performance data in one place for Amazon marketers.
View template →B2B Inbound Marketing Dashboard
Inbound marketing dashboard for executives and marketing departments of B2B companies.
View template →Ship your custom TikTok Ads dashboard this week.
Work with an Improvado expert and let the AI agent build a production-ready TikTok Ads dashboard — pulling live data, normalizing metrics, and delivering insights your team can act on immediately.