

Describe your Product Marketing Performance Dashboard.Your AI agent builds it in minutes.
All your key product marketing metrics in one dashboard.
- Deploy in days, not months
- 1,400+ data sources
- SOC 2 · GDPR · HIPAA
What the agent renders
Every view is live, editable, and connected to your real data.
Product and marketing data scattered. Attribution impossible.
All product marketers face similar problems
- Multiple business units in multiple regions need different data
- Too much time spent on generating reports each week
- Different marketing data stored in different places
Product marketing performance dashboard
How do you measure product performance in marketing? This digital KPI dashboard will allow you to:
- Provide multiple business units in multiple regions with different data
- Reduce the weekly time spent on generating reports by up to 10 hours
- Look at all of your marketing data in one place
Side-by-side performance and spend data from all your marketing platforms allows quick and easy channel optimizations.
Key product marketing performance metrics to track
Revenue - revenue is the total amount of income that a business generates through the sale of goods or services to customers
ROMI - return on your marketing investments
Churn - what percentage of clients you lose at the end of a subscription period
LTV -the lifetime value of your customer.
How to build this dashboard without Improvado
We're put the key metrics at the top, in order of importance, then added a filter by date and grouping by channels. In this particular case, we want to do more than just track key metrics. We want to compare them with those from previous periods. We're focusing on current values. Instead of previous values, we're using the percentage from the current value. It makes the dashboard small and insightful.
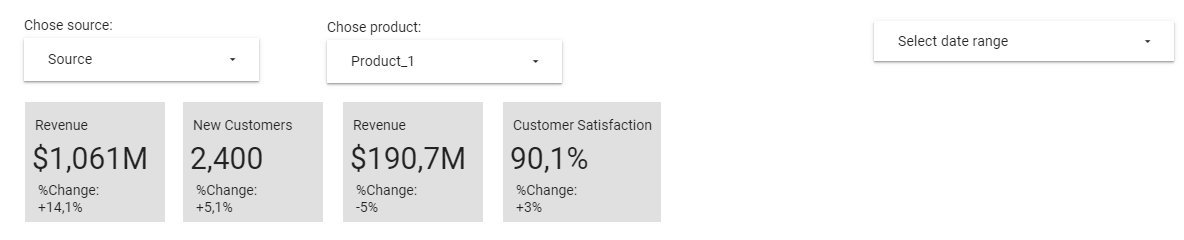
Graphs on this dashboard show:
- Sales dynamics,both by quarter and year to year
- Revenue division by groups of clients (upsell, renewal, new client) in total and by each product (there is a filter to choose a product)
- Month-to-month revenue divided by sources
- Month-to-month new clients divided by sources
The Improvado Way!
Automate data collection and update
Connect your product to Improvado and we will do everything for you on a turn-key basis.
Book a live demo call with our manager to learn more about how you can benefit from a business performance dashboard generated by Improvado.
Useful articles:

From prompt to live dashboard in minutes.
No SQL, no data engineering tickets, no waiting. Describe what you need — the agent does the rest.
Connect your stack
Authorize your data sources via OAuth — ad platforms, CRM, email, analytics. The agent gets live read access in minutes, no engineering required.
Describe the dashboard
Type what you need in plain English: "Product Marketing Performance Dashboard, last 90 days, broken out by channel." The agent writes the queries, reconciles attribution across tools, and normalizes currencies.
Dashboard goes live
A fully interactive dashboard renders in your BI tool — Tableau, Looker, Power BI, or the Improvado UI. It refreshes automatically and stays current without re-prompting.
Great at answering questions. Not built to own a live dashboard.
| Claude / ChatGPT alone | Improvado AI Agent | |
|---|---|---|
| Data access | ✗ Manual CSV export | ✓ Live API connections |
| Data volume | ✗ ~25K row context limit | ✓ Unlimited warehouse queries |
| Output format | ✗ Text summary in chat | ✓ Interactive live dashboard |
| Auto-refresh | ✗ Re-prompt every session | ✓ Automatic, configurable schedule |
| Attribution model | ✗ None — trusts your CSVs | ✓ Cross-channel normalization built-in |
| Compliance | ✗ Data leaves your stack | ✓ SOC 2 · GDPR · HIPAA · your warehouse |
| Audit trail | ✗ No query log | ✓ Every query logged, replayable |
| Useful for exploration | Get your demo → |
Plugs into the stack your team already uses
Don't see yours? Explore all 1,400+ integrations →
Everything else you might ask
What data sources can I connect to a product marketing performance dashboard?
How long does it take to set up a product marketing dashboard?
Can I customize the dashboard to track specific product features or user segments?
Other templates your agent can spin up
ABM Dashboard
Account-based marketing dashboard tracking engagement, pipeline influence, and deal velocity across target accounts.
View template →Amazon Performance Dashboard
All marketing performance data in one place for Amazon marketers.
View template →B2B Inbound Marketing Dashboard
Inbound marketing dashboard for executives and marketing departments of B2B companies.
View template →Ship your Product Marketing Performance Dashboard this week.
Talk to an Improvado expert to see how our AI agent can build your custom product marketing dashboard from live data in minutes. No engineering required—just connect your tools and start tracking what matters.