Data analysis software and tools help businesses with the often time-consuming process of collecting and organizing data, as well as identifying patterns that lead to meaningful insights.
However, there are so many different tools for data analysis that it can be difficult to know which one is best for what you want to accomplish. Here are the top options:
Improvado
What is Improvado?
Improvado is a tool built by marketers, for marketers to get all their data into one place, in real-time, with automated dashboards and reports.
Improvado is a "data pipeline" -- pulling data from your marketing platforms (Facebook, Google Analytics, Ad Servers, CRMs and email platforms, etc.) and "piping" it into any data warehouse or visualization tool you choose. Brands, agencies and universities all love using Improvado because it has saved them thousands of hours of manual reporting time and millions of dollars in wasted marketing spend
Who should use Improvado?
Improvado is best for marketing and analytics leaders who are looking to collect data from all their marketing platforms in one place. Brands, agencies and universities all love using Improvado because it has saved them thousands of hours of manual reporting time and millions of dollars in wasted marketing spend.
The integrations run deep, pulling in granular data from the keyword and ad level, to allow you to see the complete picture and even view ad creatives from within your dashboard. This simple and intuitive platform eliminates the need for developers to help you implement it or make changes (You don’t need to know SQL like you do for other platforms).
Improvado provides customer service reps included in every package who are highly attentive. A representative will work with you to customize dashboards and integrations to ensure that you're visualizing the data in exactly the way you need it.
Pros:
- Full support with a customer service rep included
- Marketing integrations are deep and granular, so you can see data at the keyword or ad level
- Ability to create custom metrics and map data across platforms
- Great for brands managing spend across multiple digital marketing channels
- Great for ad agencies managing campaigns for multiple clients
- View ad creatives from within your dashboard -- This feature is super helpful and I have not seen it offered anywhere else!
- Aggregate all your marketing data into one place, in real time.
- Reduce manual reporting time by 90%.
- No developers needed.
- Plug and play
- Completely customizable and will build out any custom integration
Cons:
- Some of the more granular features can be a bit complicated, but support is great about walking users through them.
- In order to get your dashboards and reports visualized in exactly the way you want, there may be some initial back and forth with your customer support rep.
Improvado Pricing
Improvado is customized for its users. The best way to customize the platform to your specific needs and receive pricing details is to set up a call with them.
Improvado Integrations
Improvado has 1,000+ integrations and growing. Don’t see the integration you need? They will build out custom integrations for any data source you request.
Tableau

What is Tableau?
Tableau helps people transform data into actionable insights that make an impact. Users can easily connect to data stored nearly anywhere, in nearly any format. The drag and drop feature help you create interactive dashboards with advanced visual analytics. With Tableau you can create charts, maps, graphs, and several other graphics. The company also gives users the option of installing the software on their own computer or cloud hosting the platform on Tableau’s server.
Who should use Tableau?
Data analysts, or really anyone who needs to make sense of any business data, can use Tableau to easily read data and gain valuable insights. The tool can be a helpful way of keeping track of progress for businesses that have many clients, and there is no need for any coding expertise to use Tableau. With an option for cloud hosting, it may also be a good option for those who don’t want more software installed on-site.
Pros:
- Data can be organized and sorted to appear how you want
- Access to files files using cloud and data warehouses
- Versatile
- Intuitive and user-friendly
- Connects with a large number of data sources
Cons:
- Sometimes large data files can take several minutes to load
- Graphs are somewhat limited at times
- The dashboard can be slow at times
Tableau Pricing
Tableau offers two different sets of prices for its software. One set of prices for installing the software on-premise and another for the software hosted by Tableau.
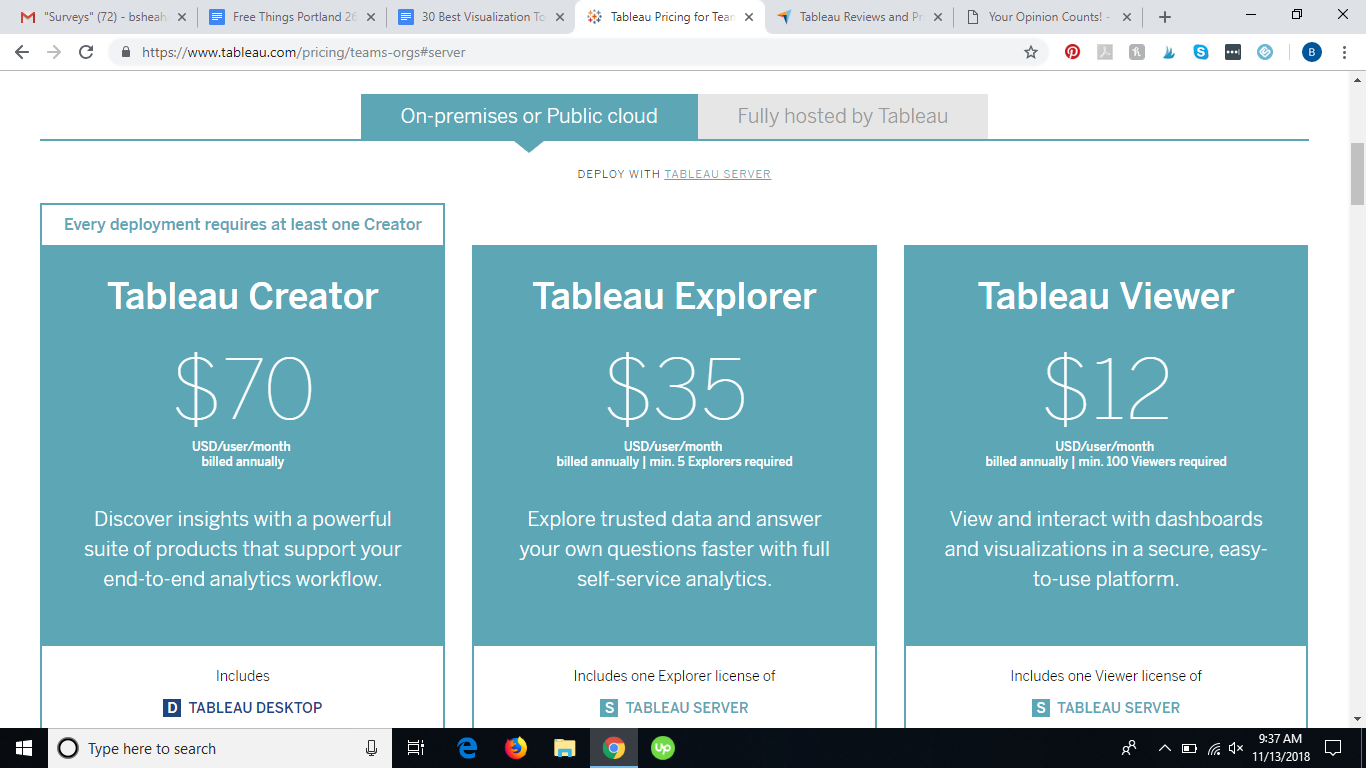
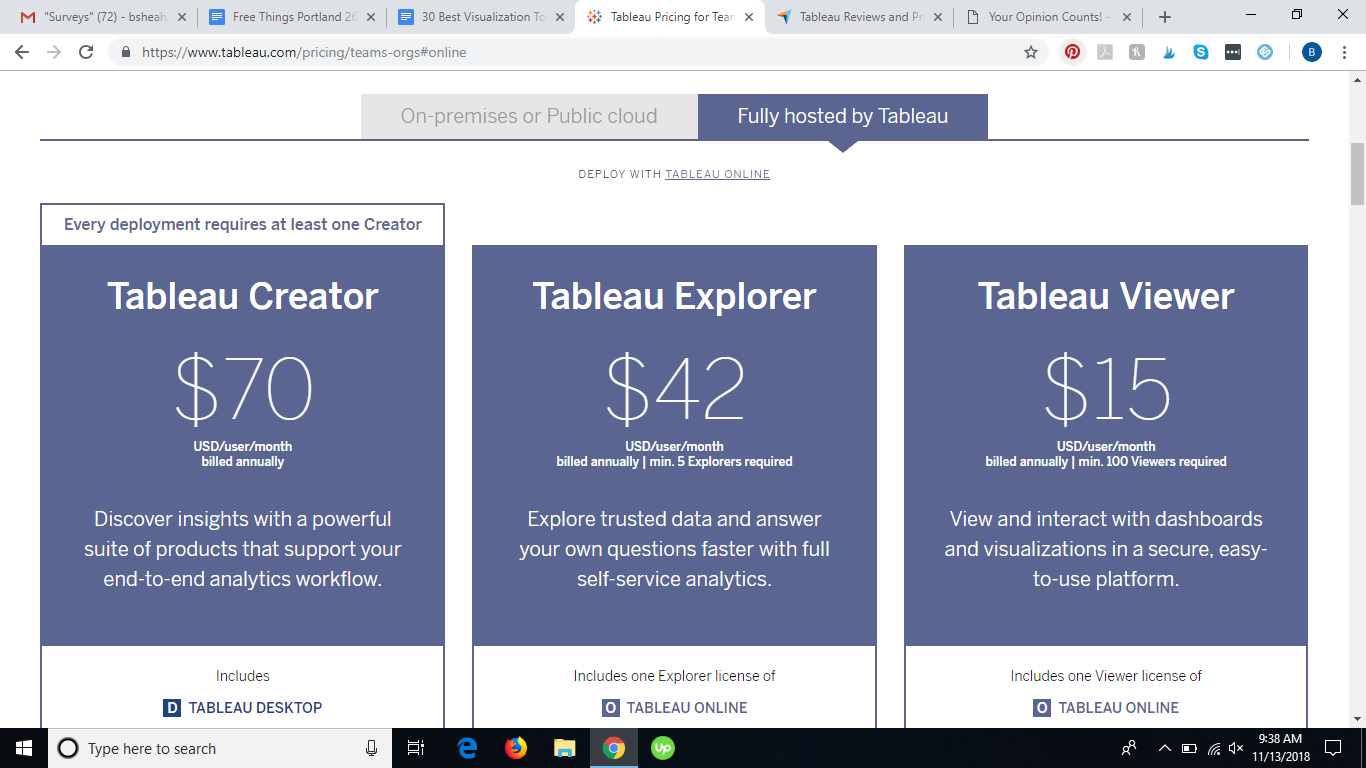
Tableau Integrations
Tableau offers the ability to connect to an extensive list of data sources.
Here you can find Looker vs Tableau comparison
Looker

What is Looker?
Looker is browser-based and offers a unique modeling language. Operating 100% in-database, it capitalizes on the newest, fastest analytic databases to get real results, in real time. Looker makes it relatively easy to choose, customize, and create a variety of interactive visualizations, providing a variety of graphs and charts to choose from.
Who should use Looker?
Looker is a useful business intelligence tool for teams across nearly all business departments. The tool is a good choice for anyone looking for something simple to use, but still provides plenty of insightful information in a visual way.
Pros:
- Great customization
- Very intuitive
- Integrates with big data platform and databases.
- Excellent customer support
- Custom install options along with their hosted solutions.
Cons:
- With simplicity comes lack of flexibility
- Large dashboards can take awhile to load
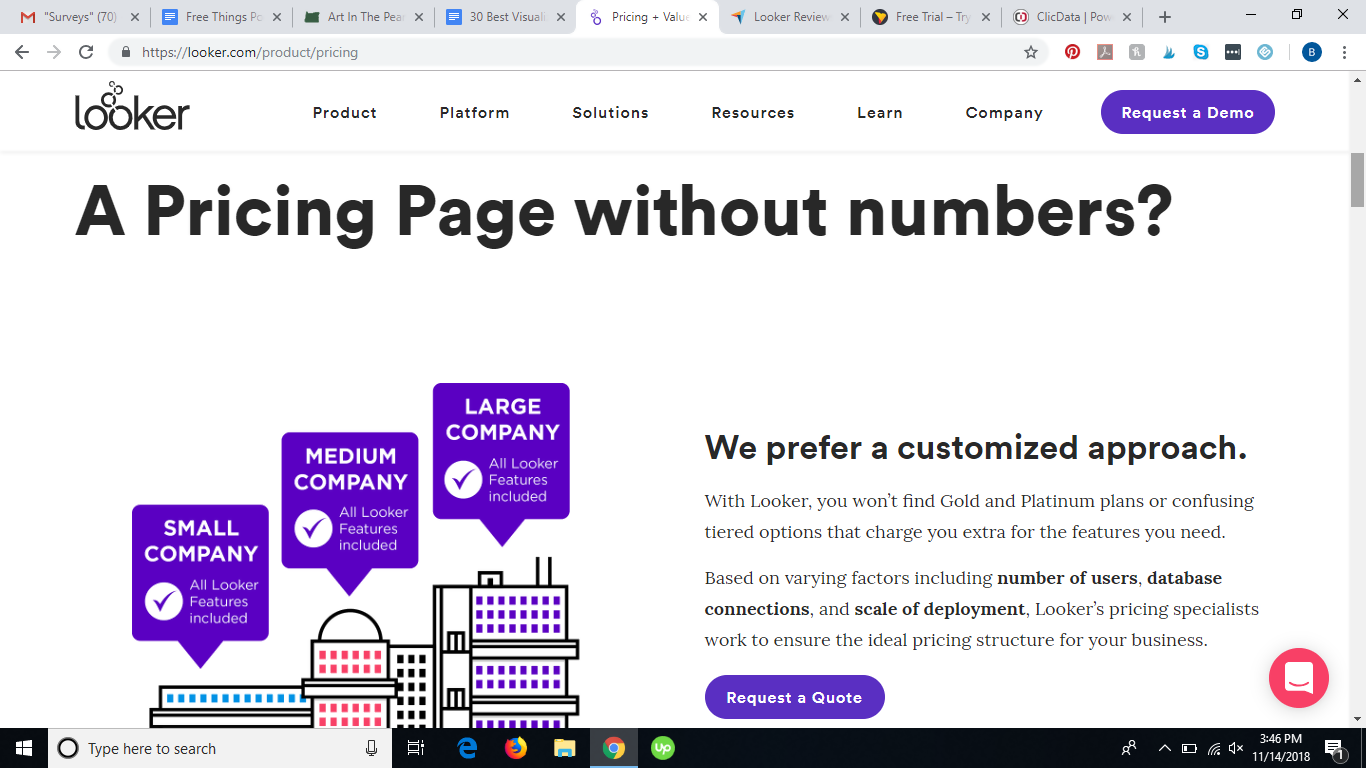
Looker Pricing
Looker does their pricing based on custom business needs, so you will need to contact the company for a quote.
Looker Integrations
Looker can be used with over 50 data sources.
Solver

What is Solver?
Solver BI360 is a comprehensive business intelligence platform, providing 360º insights into data, using reporting, data warehousing, and interactive dashboards. Users can view data in the Data Explorer and easily add dimensions and modules.
Who should use Solver?
Solver is designed for businesses of all sizes across numerous different industry verticals and can be implemented either on-site or in the cloud. BI360 drives effective, data-based productivity and includes features like user-friendly forecasting and budgeting, Excel-based reporting with predefined templates, and easy configuration.
Pros:
- Easy cross-platform reporting
- Flexibility
- Great customer support
- Ability to streamline reports
Cons:
- Lack of version and source control for reports on the Web portal
- Can be time consuming switching between design mode and run mode
- Error messaging is not always clear and concise.
Solver Pricing
You will need to contact the company to request pricing details.
Solver Integrations
Solver offers a wide variety of data integrations. You can view the full list here.
Dataiku

What is Dataiku?
Dataiku connects technologies, processes, and people to remove roadblocks along the data journey. The company boasts that it offers an all-in-one tool that integrates all the capabilities needed to turn raw data into business impacting predictions quickly.
Who should use Dataiku?
Featuring a controlled and centralized environment, Dataiku is good for both data explorers and data experts alike. The platform offers a shortcut to deployment and model management for data-powered companies.
Pros:
- Very intuitive
- Connects to nearly any database, including SQL, NOSQL, HADOOP, and FTP
- Data transformation, ML and scoring workflows can be exported
- Possibility to plug-in pre-existing scripts in Python
- Collaborative environment
Cons:
- Data visualization could be improved
- Doesn’t offer drill down functionality in visualizations or interactive charts
- License cost is on the higher end.
Dataiku Pricing
Dataiku offers a free edition with limited features, but for other editions, you will need to contact the company for pricing details. A 2-week free trial is also offered for each edition.
Dataiku Integrations
Dataiku offers 50+ data sources. You can view the complete list here.
Knime

What is Knime?
Knime is an open source platform for data analytics, integration, and reporting with a visual interface that includes nodes for a range of activities, from extracting data to presenting it. The software also has an emphasis on statistical models.
Who should use Knime?
The platform is designed primarily for data scientists and features advanced machine learning and predictive algorithms, workflow control, statistical functions, and more. Knime can be integrated with many different data science tools, such as H2O, Hadoop, Python, and R.
Pros:
- Visual user interface that doesn’t require programming knowledge
- Connect nodes by drag-and-dropping
- Open source platform
- 100+ modules
- Community continuously develops Nodes
Cons:
- Can run rather slow, particularly when more extensions and nodes are installed
- Nodes are not as customizable as Python/R libraries, though for that Python/R node can be used
- There can be a steep learning curve for users who haven’t used a similar tool
Knime Pricing
Knime is an open source platform.
Knime Integrations
Knime offers an assortment of integrations for their platform.
RapidMiner
What is RapidMiner?
RapidMiner brings artificial intelligence to companies through an open and extensible data science platform. The centralized solution that features a very powerful and robust graphical user interface that enables users to create, deliver, and maintain predictive analytics. The software also includes scripting support in several programming languages.
Who should use RapidMiner?
Built for analytics teams, RapidMiner unifies the entire lifecycle of data science, from data preparation to machine learning to predictive models. The platform’s visual interface features pre-built data connectivity, workflow, and machine learning components.
Pros:
- No coding skills required
- Can connect boxes on a canvas to conduct data analysis
- Free version available
- Plethora of data analytics and visualization tools
Cons:
- Can be very buggy
- Limitations with some versions
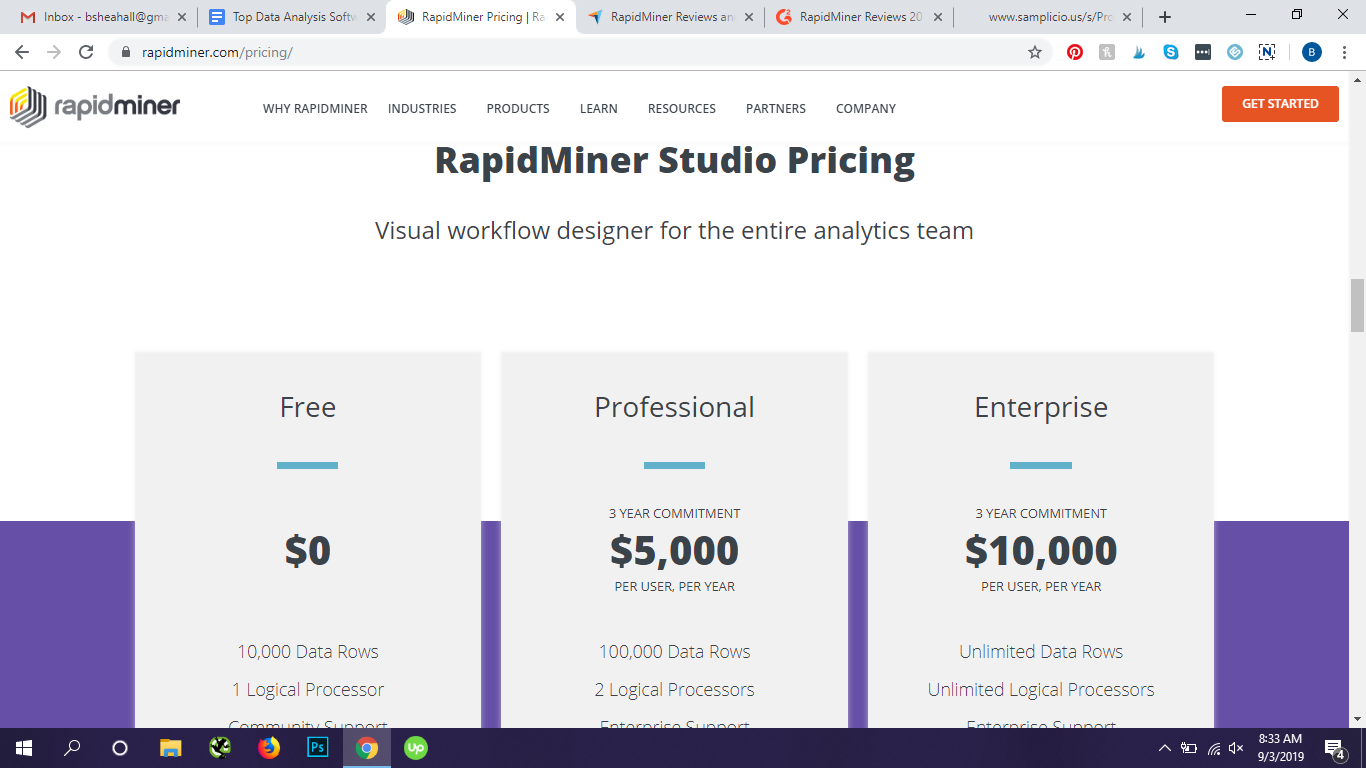
RapidMiner Pricing
Pricing for RapidMiner Studio is charged on an annual basis with a three-year commitment. There is a free version offered with limited features.
RapidMiner Integrations
RapidMiner offers a wide variety of data sources.
Pentaho
What is Pentaho?
Pentaho is an open source data warehouse and business analytics tool that is strives for continuous innovation with its modern, integrated, embeddable platform built for the future of analytics, including diverse and big data requirements.
Who should use Pentaho?
Pentaho features an interactive and simplified approach that allows users to access, discover, and merge data of any size or type. The tool features integration with big data without any need for coding, visualization of data with custom dashboards, and a platform for accelerating the data pipeline.
Pros:
- Automates the steps for execution
- Easy to use
- Wide range of tools
- Able to analyze data from multiple sources quickly and efficiently
- Versatile and effective tool
Cons:
- High basic requirements for execution.
- Lack of detailed comments in error messages
- Although it has a large community, there is not much reliable documentation
Pentaho Pricing
No pricing information is available for Pentaho.
Pentaho Integrations
Pentaho integrates with many different types of data sources.
Talend

What is Talend?
Talend is an ETL marketing tool famous for its versatility of use. It is able to interface with some of the most renowned cloud service providers including Google cloud, Microsoft Azure, and Amazon’s AWS.
Who should use Talend?
The company works with industry leaders in many different sectors and provides cutting-edge software technology for data integration, big data access, and data enrichment. Talend also comes with some of the best integration and data management utilities available.
Pros:
- The software can work with different formats including XML, JSON, and CSV.
- Can easily connect to databases on different platforms.
- JAVA technology allows users to integrate multiple scripts from libraries around the world.
Cons:
- High level of customization may require expertise in JAVA.
Talend Pricing
Talend has different pricing models including an open source one which is available to users all over the world for free. The service can be hosted on local premises or on the cloud.
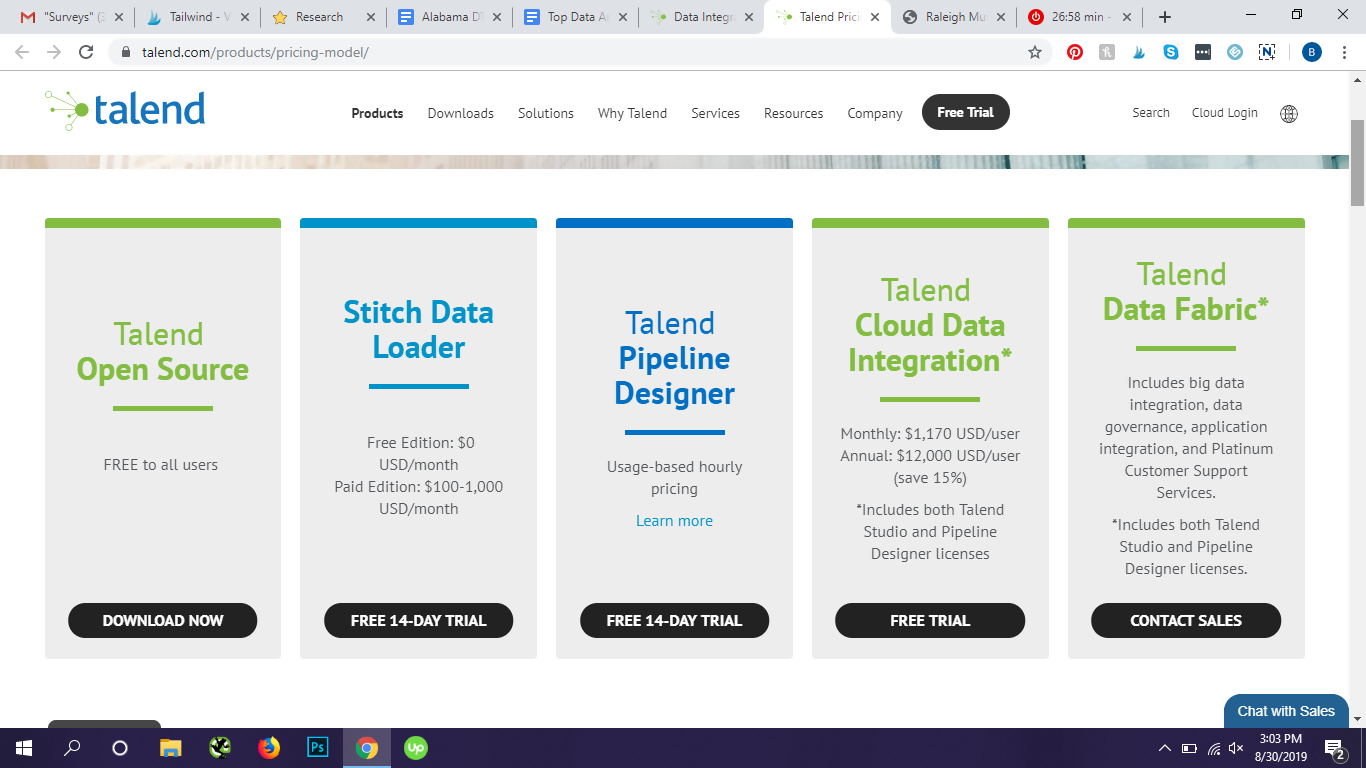
Talend Integrations
Talend offers 100+ data connectors.
Domo

What is Domo?
Domo is a data analysis platform that specializes in business intelligence and data visualization.
Who should use Domo?
The Domo platform is best for C-level executives at enterprise companies who are looking for a business intelligence tool that can be used company-wide and can create executive level dashboards.
Domo isn’t focused specifically on marketing data and instead is used for more general business data. This means that when it comes to company-wide business intelligence and executive dashboards, the software’s capacity is fairly vast, however, it probably isn’t the best choice for the aggregation and visualization for marketing data.
Pros:
- Offers over 500 connectors across Marketing and Sales, Operations, IT, HR, and Finance
- Real-time data in a single dashboard
- IT doesn’t need to be involved with implementation
Cons:
- Not specifically focused on marketing, resulting in limited marketing integrations
- You can only view data in the Domo dashboard. There is no way to export it, save it, or look at it on another BI tool.
- Entirely based in the cloud, which can cause difficulties if the majority of your data is on-site.
- There hasn’t been any significant refreshed of the tool in several years, or really any product innovation.
- The platform is rather secretive when it comes to pricing, and be cost prohibitive for many companies.
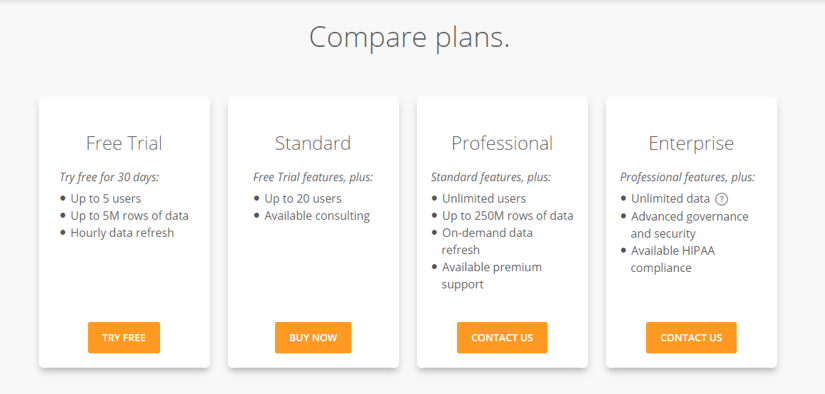
Domo Pricing
Pricing for Domo is based on a yearly subscription, and the cost varies depending on the number of people that need access to the tool. A 30-day free trial is offered.
Domo Integrations
Domo offer more than 50 integrations.
Sisense

What is Sisense?
Sisense boasts that it is the only BI reporting software that lets any user easily transform data into stunning interactive reports. Its visualization capabilities offer a simple drag and drop interface which allow charts and more complex graphics, as well as interactive visualizations, to be easily created.
Who should use Sisense?
Sisense is good for marketers or businesses who want a complete look at their data with minimal help from the IT department. The BI and data visualization tool offers actionable insights that lead to informed, data-driven decisions. You can connect directly to the relevant databases or apps, mash-up multiple data sources, & visualize data in dashboards or PDF reports.
Pros:
- Excellent customer support
- Bring together data from multiple data sources
- Drag and drop dashboard
- Wide range of widgets such as gauges, charts, and graphs
Cons:
- Lacking some flexibility with dashboards
- Sometimes images don’t look as good after exporting
- Drag and drop dashboard means less customization options
- Data sorting limitations
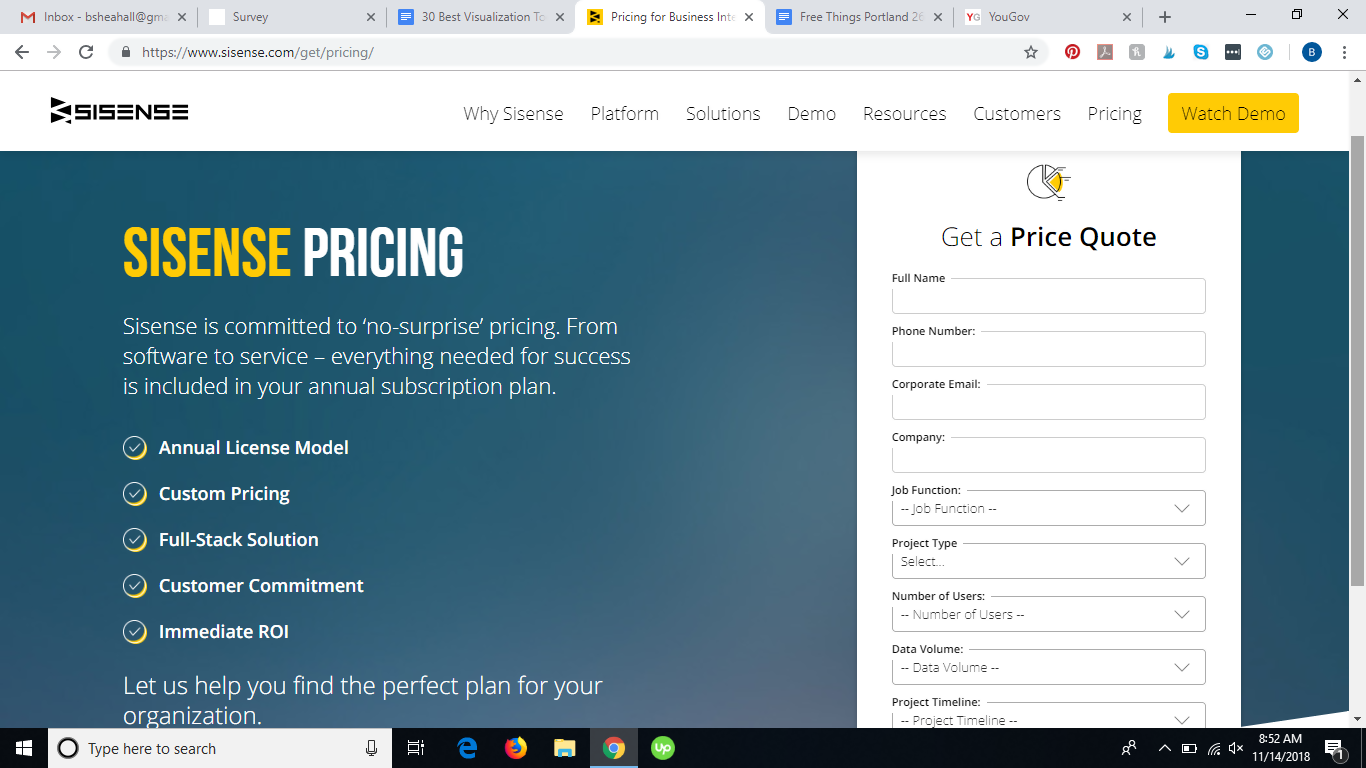
Sisense Pricing
Pricing for Sisense is done on a custom basis You will need to contact the company for a quote.
Sisense Integrations
Sisense boasts 100+ data connectors.
Qlik

What is Qlik?
Qlik, or more specifically Qlik Sense, connects to your data sources and provides the ability to discover insights beyond that of SQL queries. Users can search and explore their data, pivoting analytics to investigate data further. Qlik indexes all possible relationships in the data, without being restricted to a partial view of the data.
Who should use Qlik?
Qlik offers robust collaboration and visualization features, making it a great data analysis software for teams. The free Qlik Sense Desktop lets you create interactive dashboards and reports, along with great looking graphs and charts. This visualization software makes analysis easier, helping businesses make informed decisions quicker.
Pros:
- Customization
- Extended self-service capabilities
- Cloud-based and scalable
- Robust and fast aggregation
Cons:
- Security settings and complicated and can be difficult to comprehend
- No guided analytics aspects, even navigation between sheets can't be controlled.
- No supported data extraction capabilities.
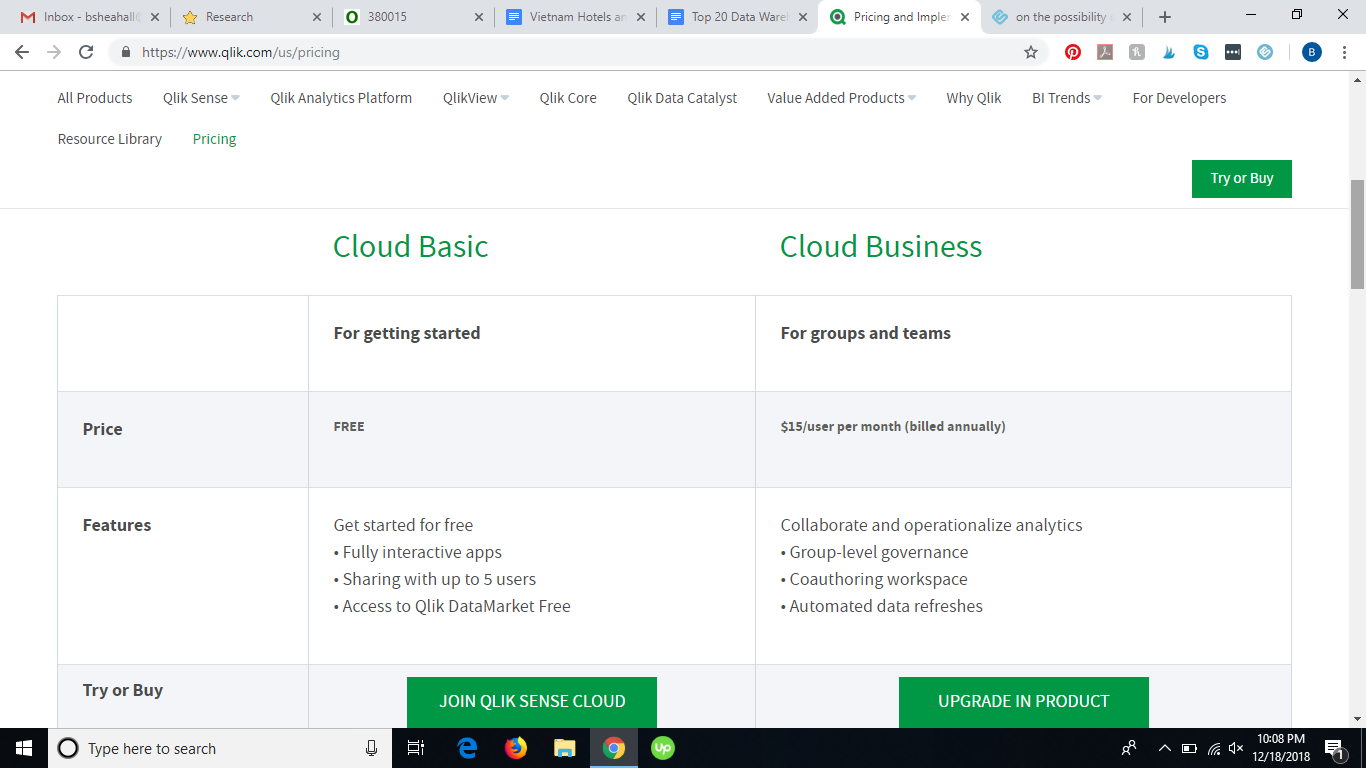
Qlik Pricing
Qlik is free for up to 5 users for Cloud Basic. Pricing for Cloud Business is starts from $15 per user.
Qlik Integrations
Qlik can be integrated with many different data sources.
Microstrategy

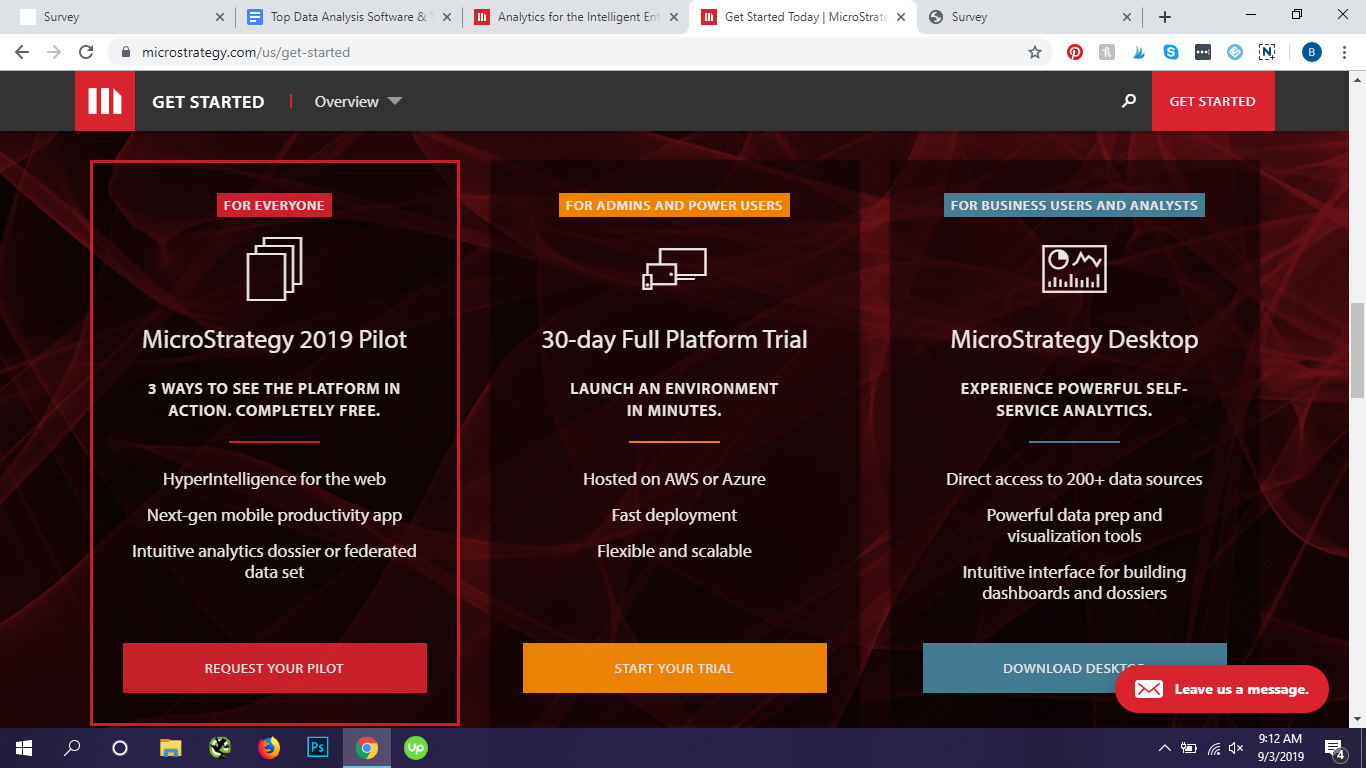
What is MicroStrategy?
MicroStrategy is a business intelligence software platform that provides integrated analytics, featuring mobile apps and showcasing enterprise-grade security. Its mobile intelligence platform enables companies and organizations to build, deploy, as well as maintain mobile apps across a wide range of solutions by embedding transactions, multimedia, and intelligence, into apps.
Who should use MicroStrategy?
The BI platform lets companies worldwide check the massive amounts of data that are stored across their organization to make better, data-driven decisions. MicroStrategy offers business intelligence, cloud-based, and mobile software services, along with a social intelligence platform for harnessing the power of social networks.
Pros:
- Versatile and flexible data analytics platform
- Tailor made reports with scheduled deliveries
- Ability to provide customers with access to reports and dashboards
- Access OnTheGo information via mobile
- User friendly interface
Cons:
- A bit of a learning curve
- Initial setup and configuration can take some time
- Reloading data can be a little slow
- A few bugs here and there
MicroStrategy Pricing
No pricing information is provided. You can contact the company to request price details and a demo.
MicroStrategy Integrations
MicroStrategy boasts offers 50+ big data integrations.
Thoughtspot
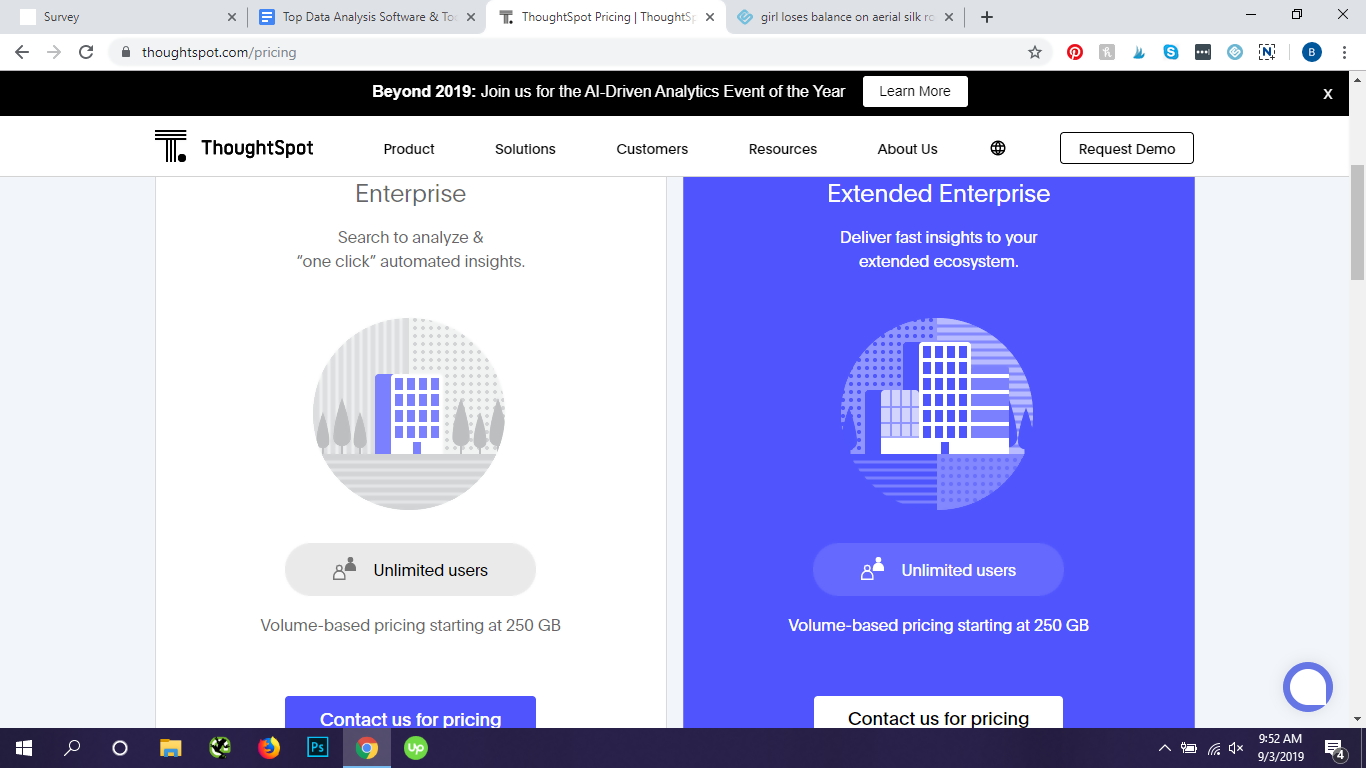
What is Thoughtspot?
ThoughtSpot is a data analytics software solution powered by a robust relational search engine. Working like Google or Bing, users are able to type in keyword terms into a search box and get answers to their data questions. Thoughtspot presents the search results as best-fit visualizations so users can easily analyze data, create reports and build dashboards without relying on help from the IT department.
Who should use Thoughtspot?
With ThoughtSpot, search makes it easy for anyone to build their own reports and dashboards without the help from IT.
Pros:
- Ability to set automatic system updates at set intervals
- User friendly
- Clean and organized interface
Cons:
- Initial learning curve
- Need IT help to get everything setup
- Inconsistency with bugs/errors
Thoughtspot Pricing
You will need to contact the company for details about about pricing.
Thoughtspot Integrations
Thoughtspot doesn’t provide a list of data integrations on their website. The company boasts that it connects with any on-premise, cloud, big data, or desktop data source.
Birst

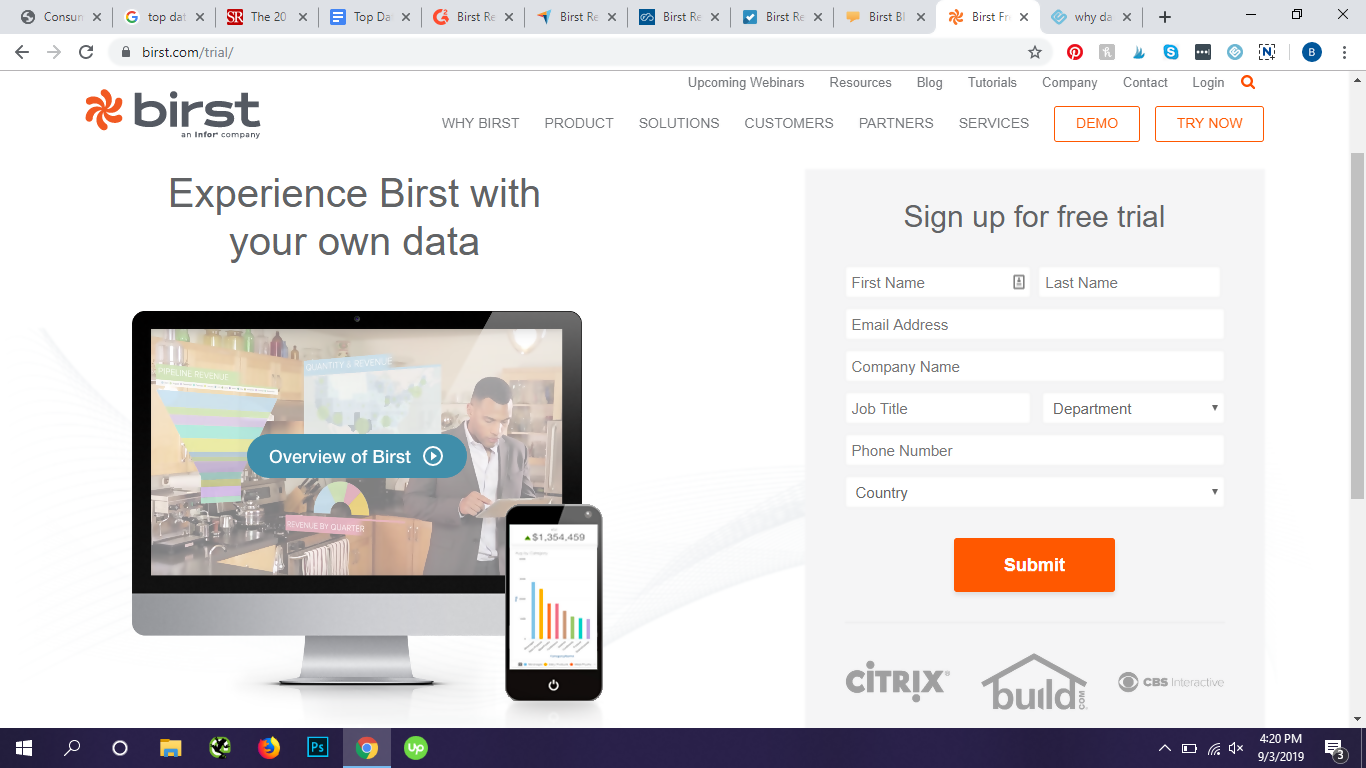
What is Birst?
Birst is a web-based networked business intelligence and analytics tool that connects insights from various teams, allowing them to make more informed decisions, and offering automation and optimization for the entire BI process. Birst’s unique BI approach connects every user to a shared analytical network that can easily be accessed and extended.
Who should use Birst?
The shared network of analytics offered by Birst delivers agility for business users while maintaining IT governed oversight. The tool focuses on solving one of the biggest challenges in data analytics, which is establishing trust in data from several different sources within the enterprise.
Pros:
- Collaborative workspace makes it easy to share data
- Great customer support
- Easily integrate/implement into existing sites
- Visualizer and designer tools provide the ability for custom reports
Cons:
- Setting up a report and drilling across to the desired view can take a while
- Users say it is fairly expensive
- Can take a long time to load if it is a big data set
- Tedious to update all different instances
- Steep learning curve
Birst Pricing
Birst offers a free trial of its tool. You will need to contact the company, however, for price details.
Birst Integrations
Birst doesn’t provide any list of data integrations on its website.
Our recommendation:
Check out Top 17 Marketing Analytics Tools and Software for 2023
Best agency management software for marketing agencies
The Best Marketing Dashboard Software of 2023 and How to Set it Up
Supermetrics VS Funnel.io VS Improvado - A Comprehensive Comparison
The Best Data Analysis Tools For Every Business in 2023
14 Best ETL Tools For Enterprise Businesses to Try in 2023
Best Data Visualization Tools: Tableau vs Looker vs Power BI [2023]
Top 16 Data Ingestion Tools to Jumpstart your Data Strategy
Top 15 enterprise marketing tools that will skyrocket your marketing performance in 2023
Top 12 Data Analysis Software: How to Choose the One That Will Drive Your Growth
Data Ingestion: Where Every Healthy Data Ecosystem Starts
Learn about Best Dashboard Software
FAQ
How does Improvado integrate with business intelligence tools like Looker, Tableau, and Power BI?
What software is used for data analysis?
How does Improvado integrate with BI platforms for deeper analysis?
How does Improvado compare to Datorama?
What internal dashboarding tools does Improvado support?
What are the available marketing intelligence platforms and how does Improvado compare to them?
How does Improvado compare to other marketing data platforms?
How does Improvado assist teams in improving their use of data?


.png)