Proving marketing ROI in 2026 requires navigating a landscape that is more complex and dynamic than ever. Rapid shifts in privacy regulations, the rise of AI-driven campaigns, and evolving customer journeys have made traditional measurement models increasingly unreliable.
At the same time, teams are under pressure to deliver real-time insights while managing larger data volumes, integrating offline and online signals, and maintaining compliance across multiple regions and platforms.
This guide examines modern data analytics frameworks built to meet these demands. It outlines the core components of a scalable measurement strategy, highlights practical approaches for connecting analytics to business outcomes, and reviews tools and techniques for attribution, forecasting, and optimization.
Quick answer
A data analytics framework is a structured approach for managing the full analytics lifecycle, from data collection and integration to modeling, visualization, and decision-making. It provides the architecture, processes, and governance needed to ensure data remains accurate, consistent, and actionable across an organization, transforming raw data into insights that support business objectives.
Key Takeaways
- Data analytics frameworks are essential for scaling marketing measurement, unifying fragmented data, and aligning analytics with business outcomes like ROI and revenue impact.
- A complete framework includes nine core components, from ingestion and quality control to governance, activation, and automation, each serving a distinct role in the analytics lifecycle.
- Strong governance and anomaly detection are critical for maintaining trust, ensuring compliance with evolving regulations, and preventing reporting errors as data pipelines grow more complex.
- Tool selection should focus on interoperability, scalability, and alignment with business needs rather than vendor hype, with platforms like Improvado providing end-to-end centralization and AI-driven insights.
- A future-proof analytics strategy prepares organizations for growth and emerging technologies like AI by building a clean, governed, and flexible data foundation that supports advanced analytics at scale.
What Is a Data Analytics Framework?
The framework defines how raw data is transformed into insights that support business objectives. This typically involves:
- Ingesting data from multiple marketing, sales, and operational systems
- Standardizing and validating data to eliminate inconsistencies and gaps
- Applying analytical models for attribution, forecasting, segmentation, and optimization
- Delivering insights through dashboards, automated reporting, and AI-driven recommendations
Unlike ad hoc analysis, a framework creates repeatable, scalable workflows that align technical teams and business stakeholders around shared definitions and metrics. This alignment improves decision-making, reduces manual effort, minimizes errors, and accelerates time to insight.
A well-implemented analytics framework serves as the foundation for advanced initiatives, including multi-touch attribution, marketing mix modeling, predictive analytics, and real-time performance monitoring.
Why Is a Data Analytics Framework Important in 2026?
Frameworks matter because the volume, velocity, and complexity of marketing data are growing faster than most organizations can manage.
Marketing teams now operate in an environment where campaigns run across dozens of platforms, generating massive amounts of streaming data that needs to be captured, standardized, and analyzed in near real time. Yet many organizations lack the infrastructure to connect these signals into a coherent view, making it nearly impossible to measure true ROI.
At the same time, compliance risks are accelerating. As vendor ecosystems grow, every new integration introduces potential vulnerabilities. In fact, more than 60% of enterprises have experienced at least one vendor-related data breach in the past two years.
Without a structured analytics framework, these issues multiply as martech stacks expand. Teams end up with fragmented reporting, conflicting metrics, and blind spots in compliance, all while struggling to meet the demand for faster, more reliable insights.
A modern framework provides the structure needed to scale analytics, enforce governance, and keep pace with the speed and complexity of today’s marketing landscape.
What Are the Key Components of a Data Analytics Framework?
Every durable analytics framework is built on nine essential components that together move data from raw input to business-ready insight.
1. Data collection and ingestion
Data centralization starts with bringing together signals from every relevant system. This includes CRMs, ad platforms, email tools, ecommerce systems, offline conversion feeds, financial systems, and increasingly, real-time sources such as IoT or streaming events.
Manual extraction from each platform is slow, error-prone, and expensive. API limits, schema changes, and failed exports frequently disrupt pipelines, creating blind spots in reporting.
Modern ingestion layers rely on APIs, managed connectors, and stream processing to unify these flows into a single, continuous pipeline. This significantly reduces latency and ensures that downstream processes receive complete, reliable data.
2. Data processing and cleaning
Raw data is rarely ready for analysis. Inconsistent naming conventions, duplicate records, missing values, and fragmented schemas create major barriers to accurate reporting and modeling.
Processing and cleaning involve standardizing data across all sources, validating its completeness, and enriching it with additional context such as campaign metadata or geographic hierarchies.
At this stage, many teams leverage AI-powered schema mapping and rules-based normalization to enforce consistent taxonomies. This ensures that when data enters the warehouse, it is already in a structured, trusted state, ready to support advanced analytics such as attribution modeling and forecasting.
To simplify and speed up the data transformation process, Improvado provides a no-code data transformation framework and a number of pre-built data models for common marketing use-cases.
One client decided to test Improvado's scalability, combining 15 data sources and mapping up to 50 fields in a complex custom data model. The platform's capacity to handle such complex transformations far exceeded their previous experiences.
“Once the data's flowing and our recipes are good to go—it's just set it and forget it. We never have issues with data timing out or not populating in GBQ. We only go into the platform now to handle a backend refresh if naming conventions change or something. That's it.”

3. Data storage
Data must be stored securely and efficiently, with the flexibility to support a wide range of query types and workloads.
Options include:
- Relational databases for highly structured, transactional data
- Cloud data warehouses such as Snowflake, BigQuery, or Redshift for analytics-ready datasets
- Data lakes or lakehouses for storing raw or semi-structured data, streaming events, and historical archives
The most mature frameworks adopt a multi-tier storage design with raw, refined, and semantic layers. This architecture balances governance with performance, allowing analysts to work with the right data at the right stage while maintaining compliance controls.
4. Governance and security
As data volume grows, so does regulatory risk.
Breaches tied to third-party vendors now cost enterprises 61% more than internal incidents. A strong framework must enforce:
- Role-based or attribute-based access controls to manage permissions at scale
- Complete audit trails that log who accessed what data and when
- Compliance with standards such as SOC 2, GDPR, CCPA, and HIPAA
5. Decision engines
Beyond reporting, analytics frameworks must help teams act on insights. Decision engines use machine learning and optimization algorithms to generate recommendations, for example, shifting budgets between campaigns, adjusting bids, or prioritizing audience segments.
For trust and accountability, outputs from these systems typically pass through approval gates. This ensures that high-impact actions are reviewed by analysts or marketing managers before they are deployed into activation platforms.
6. Anomaly detection and observability
Without visibility into pipeline health, analytics teams are forced to troubleshoot issues reactively, often under executive pressure when numbers suddenly change.
Anomaly detection monitors three dimensions:
- Freshness: Is data arriving on schedule?
- Volume: Are record counts within expected ranges?
- Value: Are metrics aligned with historical trends and projections?
Observability tools set clear SLAs and define alerting paths so problems are caught early. This prevents data quality issues from cascading into inaccurate reports and broken models.
7. Integration and activation
Centralizing data is only the first step. To drive value, insights must flow back into the platforms where decisions are executed, CRMs, marketing automation platforms, and ad networks.
Modern frameworks emphasize reverse ETL, pushing cleaned, governed data into these systems to power personalization, audience targeting, and campaign automation.
This last-mile delivery ensures data does not remain trapped in BI dashboards, but actively drives revenue and operational outcomes.
8. Visualization and reporting
Data must be interpretable by stakeholders across functions, from analysts to executives.
Effective dashboards simplify complexity, providing clear narratives and actionable metrics. Self-service BI platforms like Tableau, Power BI, and Looker empower users to explore data independently.
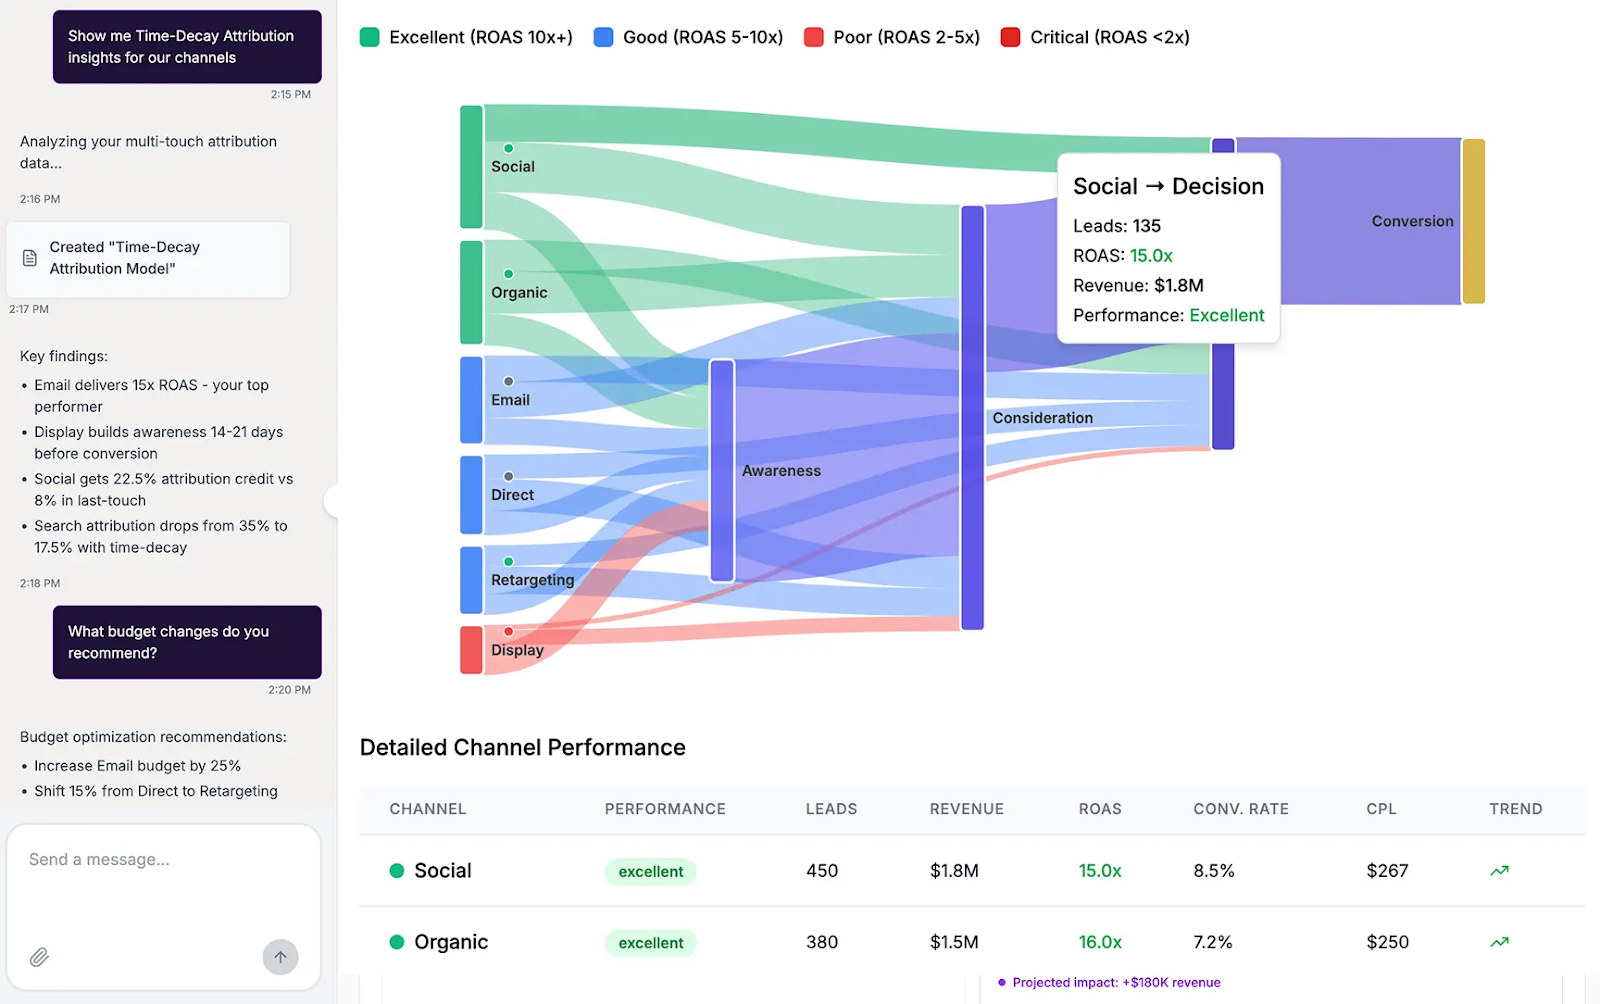
Emerging generative dashboards, such as those built by Improvado AI Agent, enable teams to query data in natural language, accelerating access to insights and reducing dependency on technical staff.
9. Automation and reduced IT overhead
As martech stacks grow, manual maintenance of pipelines becomes unsustainable. Automation is critical for reliability and scale.
Automated workflows handle everything from ingestion to anomaly detection, drastically reducing the need for engineering support. Enterprises that fully automate their pipelines often cut 90% of marketing-related IT tickets, allowing analytics teams to focus on advanced modeling, strategy, and experimentation instead of firefighting broken connectors.
How Do Capabilities Map to Measurable Business Outcomes?
For a data analytics framework to gain executive support, it must directly connect technical capabilities to business outcomes that drive growth, efficiency, and risk reduction. This alignment ensures analytics is not perceived as a cost center but as a strategic enabler with quantifiable ROI.
Each capability within the framework plays a distinct role in moving from raw data to actionable insight. When clearly mapped, these connections help stakeholders understand why investment in infrastructure, automation, and governance is essential.
The table below illustrates how key capability areas translate into measurable impact and the controls required to sustain that impact at scale.
| Capability Area | What It Does | Measurable Outcome | Controls Needed |
|---|---|---|---|
| Ingestion and Harmonization | Automates collection and standardization of 1,000+ marketing and revenue data sources into a single structure | -75% reduction in manual reporting time; faster time-to-insight | Schema contracts, connector SLAs, automated failure recovery |
| Data Quality | Cleanses, validates, and enriches datasets to maintain integrity across pipelines | 99.9% accuracy rates; minimal reconciliation effort; reduced error-driven rework | Automated validation rules, anomaly detection, lineage tracking |
| Governance and Security | Centralizes compliance and enforces access policies across all integrations | -60% audit preparation time; reduced compliance risk and breach exposure | Role-based access control (RBAC), PII masking, activity logs, policy enforcement |
| Decision Engines | Generates predictive and prescriptive recommendations for spend allocation, audience targeting, and retention strategies | Faster budget reallocation cycles; proactive churn prevention; improved revenue forecasting | Bias checks, approval workflows, model performance monitoring |
| Visualization and Activation | Delivers insights through dashboards and pushes governed data back into operational systems via reverse ETL | Faster, trusted decisions; reduced reporting bottlenecks; operationalized insights | Version control, standardized metric definitions, change management protocols |
What Are the Top 10 Data Analytics Frameworks and Tools?
Choosing the right data analytics frameworks and tools is critical for building an ecosystem that is both scalable and compliant, while also reducing operational complexity.
Below are ten leading frameworks and tools that represent the core pillars of a modern analytics stack.
- Improvado: An end-to-end marketing analytics platform that aggregates data from 1,000+ sources, normalizes and models it for analysis, and enables BI and advanced reporting. It also includes an AI Agent that delivers instant insights and natural language queries, reducing time-to-insight and reliance on manual analysis.
- Snowflake: A cloud data warehouse designed for scalability and performance, enabling storage and querying of massive datasets with near-infinite elasticity and strong support for structured, semi-structured, and streaming data.
- BigQuery: Google’s serverless warehouse offering, known for speed, native machine learning integrations, and seamless connectivity to other Google Cloud services and marketing platforms.
- Databricks Lakehouse: Combines data warehouse and data lake capabilities into a single architecture, supporting both analytics and data science workflows, especially useful for machine learning model training on raw and processed data.
- Fivetran: A managed ETL solution focused on automated data extraction and loading. It minimizes pipeline maintenance by automatically adapting to API changes, which is critical for dynamic martech ecosystems.
- dbt (Data Build Tool): Provides a framework for transformation and modeling directly inside the warehouse, enforcing version control, modular code, and reproducible workflows that scale across teams.
- Tableau: A mature BI platform for interactive data visualization and exploration, allowing stakeholders to self-serve insights and collaborate around trusted, centralized dashboards.
- Power BI: Microsoft’s business intelligence solution with deep integrations into the broader Microsoft ecosystem, ideal for organizations already operating on Azure or leveraging Excel-based workflows.
- Monte Carlo: Specializes in data observability and quality monitoring, detecting anomalies, pipeline failures, and schema drift to prevent inaccurate data from reaching production reporting.
- Hightouch: A leading reverse ETL tool for pushing clean, governed data from the warehouse back into operational systems like CRMs, marketing automation platforms, and ad networks, closing the loop between analytics and activation.
These tools collectively represent the foundation of a modern analytics framework.
When integrated correctly, they enable seamless movement of data from ingestion to action, ensuring accuracy, compliance, and scalability at every stage of the process.
The right mix depends on the complexity of the martech stack, regulatory requirements, and the level of automation required for decision-making.
How Should Enterprises Compare Leading Tools?
Selecting analytics tools is less about individual feature checklists and more about how well each tool fits into the broader data ecosystem. Enterprises should evaluate platforms based on scalability, governance, integration depth, and total cost of ownership.
Key considerations include:
- Interoperability with existing data infrastructure and APIs
- Automation capabilities to minimize engineering overhead
- Governance and compliance support, including audit trails and access control
- Flexibility to handle both current and future use cases, such as AI-driven insights or real-time activation
The most effective approach is to map tools against specific business objectives and identify gaps in the current stack. This ensures technology decisions are driven by measurable outcomes rather than vendor positioning.
How Should Enterprises Choose the Right Data Analytics Framework?
The right framework must balance business objectives with technical architecture, future growth, team capabilities, and regulatory demands. Rather than starting with tools or vendors, the focus should be on building a sustainable, business-aligned foundation.
Key steps for making the right choice include:
- Define measurable KPIs tied to revenue and cost efficiency: Establish clear success metrics such as pipeline contribution, marketing ROI, and customer acquisition cost. These metrics will guide architecture decisions and prevent tool-first thinking, where technology is implemented without a clear business case.
- Audit data sources and flows: Map every source of marketing, sales, and operational data, distinguishing between batch ingestion and real-time streaming needs. This audit informs architectural choices such as whether a data lake, warehouse, or lakehouse model is best suited for current and future requirements.
- Evaluate scalability for future growth: Plan for at least 5× growth in data volume over the next three to five years. This includes considering query performance, storage optimization, and the ability to support new channels, markets, and analytics use cases without major redesigns.
- Align architecture with team skill sets: The framework should match the technical proficiency of internal teams. Operations teams may require low-code or no-code interfaces for managing workflows, while data science teams may need open access to Python, SQL, and machine learning frameworks for advanced modeling.
- Prioritize integration depth and flexibility: Ensure seamless connectivity with all critical systems, including CRMs, ad platforms, marketing automation, and offline data sources. API stability, connector coverage, and reverse ETL capabilities are essential for both centralization and activation.
- Lock down security and compliance from day one: Implement enterprise-grade security practices such as encryption at rest and in transit, role-based access control (RBAC), and PII masking. Ensure the framework can support certifications and regulatory requirements like SOC 2, GDPR, HIPAA, and CCPA.
- Model total cost of ownership: Compare cloud versus on-premises options and evaluate managed services against custom-built solutions. Factor in not only licensing and infrastructure but also engineering overhead, support costs, and long-term maintenance.
- Plan for AI adoption and advanced analytics: Harmonized, well-governed data is the prerequisite for AI-driven insights and automation. Build a framework that supports advanced use cases such as predictive modeling, anomaly detection, and real-time optimization without adding excessive complexity.
By following these steps, organizations can select a framework that not only solves immediate reporting challenges but also supports scalable, future-proof analytics capabilities aligned with business strategy.
Build a Future-Proof Analytics Strategy
To future-proof analytics, enterprises need a framework that is scalable, automated, and designed to adapt to changing business requirements. This is where Improvado provides a significant advantage.
Improvado functions as an end-to-end marketing analytics platform, centralizing data from over 500 marketing, sales, and revenue sources. Instead of stitching together multiple point solutions, teams can manage the entire data lifecycle within a single environment. The platform handles:
- Automated data ingestion and harmonization: Improvado’s pre-built connectors continuously pull data from diverse platforms, normalize schemas, and standardize taxonomies at the source. This eliminates hours of manual work and ensures consistency before data reaches the warehouse.
- Modeling and transformation at scale: Data can be structured into business-ready models directly within Improvado or pushed to warehouses like Snowflake or BigQuery for further processing with tools such as dbt.
- Governance and compliance controls: Enterprise-grade features including role-based access, PII masking, and SOC 2-level security are embedded across all integrations, simplifying regulatory compliance while reducing risk.
- BI enablement: Once data is clean and governed, it flows seamlessly into BI tools like Tableau and Power BI or data warehouse.
- AI Agent for natural language insights: Improvado’s AI Agent enables stakeholders to query data in plain language, receive instant recommendations, and even detect anomalies proactively. This shortens the time between question and insight, freeing analysts to focus on strategic modeling.
By consolidating ingestion, transformation, governance, and activation into a single platform, Improvado reduces operational overhead and accelerates decision-making.
Organizations can shift their focus from maintaining fragile pipelines to driving measurable business outcomes, such as improved ROI attribution, faster budget reallocation, and higher data trust across teams.
Book a demo call with Improvado to create a resilient foundation for continuous optimization and innovation.
Related reading: 7 Big Data Analytics Privacy Problems & Solutions (2026), PESO Marketing Guide 2026: What Does PESO Stand For | Improvado, Seismic Analytics Guide for Marketing Teams (2026), SEMrush Analytics Guide for Marketing Data Teams 2026, SendGrid Analytics Guide: Track Email Performance in 2026, Sisense Analytics Guide: Features, Pricing & Setup 2026, Stripe Analytics Guide: Metrics, Dashboards & Best Practices, Taboola Analytics Guide: Tracking & Attribution 2026