
Quick data analysis is key to leveraging market opportunities, adjusting strategies on the fly, and outperforming competitors. Ad-hoc analysis tools are at the core of this capability. These tools enable marketing teams to dissect customer data, campaign effectiveness, and market trends in near-real-time, facilitating agile decision-making.
This article introduces 5 leading ad-hoc analysis tools that range from AI-driven platforms to adaptable BI tools. These tools have seamless integration capabilities, intuitive use, and comprehensive exploration features, making them ideal for handling ad-hoc requests.
Quick answer
Ad-hoc reporting enables instant data exploration, allowing users to investigate specific questions and create reports as needed. Unlike scheduled reports with predefined parameters, ad-hoc reports are dynamic, user-generated custom reports built to address specific, immediate business questions. They empower users to manipulate data sources, choose specific dimensions and measures, and create unique data visualizations without waiting for the next scheduled report.
What Is Ad-Hoc Reporting?
Ad-hoc analytics enables instant data exploration, allowing users to investigate specific questions and create reports as needed. Unlike scheduled reports, which operate within predefined parameters, ad-hoc analytics offer flexibility, allowing users to tailor their investigations to current questions or problems.
This means having the capability to swiftly address and adapt to emerging trends, performance metrics, and customer behaviors without waiting for the next scheduled report.
How is it different from static reporting?
The primary distinction between ad hoc reporting and static reporting lies in their flexibility and purpose:
- Static Reports: These are pre-designed, standardized reports that provide a fixed set of metrics and insights on a regular schedule (for example, weekly sales reports, monthly website traffic summaries). They are excellent for consistent monitoring and tracking, but offer limited flexibility for deeper data exploration or answering novel questions.
- Ad Hoc Reports: These are dynamic, user-generated custom reports built to address specific, immediate business questions. They empower users to manipulate data sources, choose specific dimensions and measures, and create unique data visualizations to uncover insights that pre-built reports might miss. This makes them ideal for in-depth investigations, troubleshooting, and reacting swiftly to emerging trends or challenges.
The Core Benefits of Ad Hoc Reporting
The ability to perform ad-hoc analysis yields substantial benefits across an organization, particularly for marketing, sales, and operations teams striving for agility and efficiency.
1. Faster, Data-Driven Decision-Making
Ad hoc reporting dramatically accelerates the insight-to-action cycle. When a critical business question arises – "Which campaigns are driving the most MQLs this quarter?" or "What's the ROI of our latest product launch?" – teams can generate the necessary data-driven reports almost instantly.
This rapid access to information enables faster, more informed decision-making, allowing businesses to pivot strategies, optimize spending, and seize opportunities without delay.
2. Empowering Non-Technical Teams with Self-Service BI
One of the most transformative benefits of ad hoc reporting tools is their ability to enable self-service BI.
Modern tools, equipped with user-friendly interfaces and drag-and-drop functionalities, enable business users, even those without a background in SQL or data science, to access, analyze, and visualize their own data.
This democratization of data empowers marketing, sales, and other departmental teams to become more independent in their data analysis, reducing bottlenecks and fostering a culture of curiosity and insight.
3. Reducing Reliance on IT and Data Analysts
Historically, every unique business question requiring data often meant a request ticket for the IT department or a data analyst. This process could be time-consuming, leading to delays and frustration.
Ad hoc reporting tools significantly reduce this reliance, freeing up valuable technical resources to focus on more complex data infrastructure and strategic projects. Non-technical users can perform their own on-demand queries, getting answers as needed, without waiting.
4. Uncovering Deeper, Actionable Insights
Pre-defined reports, while useful, can sometimes mask nuances or emerging patterns.
Ad hoc reporting enables users to delve deeper, experiment with various data cuts, and connect seemingly disparate datasets. This granular data exploration can lead to the discovery of hidden trends, unexpected correlations, and root causes of performance fluctuations, transforming raw data into truly actionable insights that drive growth.
Key Features of Ad-Hoc Analytics Tools
Ad-hoc analysis tools should be able to handle the dynamic nature of data, offer real-time insights, and provide easy-to-use interfaces for all team members. Without these capabilities, the process of generating reports becomes time-consuming and cumbersome, defeating the purpose of ad-hoc reporting and agile optimization, which is designed for speed and flexibility.
This section outlines the key features to look for in an ad-hoc analysis tool.
- Intuitive query interfaces: Ad-hoc analysis tools are designed with user-friendly query interfaces that enable users to easily create and modify queries without extensive SQL knowledge or the use of SQL at all. This accessibility allows for swift data exploration and analysis.
- Dynamic reporting: These tools offer dynamic reporting capabilities, allowing users to generate reports on-the-fly based on the latest data. Customization options enable the creation of reports that align with specific business needs and objectives.
- Data visualization: Advanced data visualization features are a cornerstone, providing interactive charts, graphs, and dashboards. This enhances the interpretability of complex datasets, facilitating quicker and more informed decision-making.
- Real-time data access: Access to real-time data ensures that the insights derived are timely and relevant, enabling businesses to make decisions based on the most current information available.
- Cross-database support: The ability to integrate and pull data from various databases and data sources is vital, allowing for a holistic view of the business landscape and enabling comprehensive analysis.
- Collaboration features: Collaboration tools within ad-hoc analytics platforms enable teams to share insights, reports, and dashboards seamlessly, fostering a collaborative data-driven culture.
- Scalability: As business needs grow and evolve, ad-hoc analytics tools scale to handle increasing volumes of data and more complex analysis requirements, ensuring they remain a valuable asset over time.
Top 15 Ad-Hoc Analytics Tools
This section introduces the top 15 ad-hoc analytics tools, each selected for their unique capabilities to support swift, insightful analysis and reporting. From customizable dashboards to seamless data integration, these tools are designed to meet the diverse needs of marketing teams.
| Tool | Best for | Limitations | Pricing |
|---|---|---|---|
| Improvado AI Agent | Instant, AI-driven ad-hoc insights over centralized marketing datasets | Built on top of the Improvado platform—less suitable if standalone ad-hoc reporting is needed | Custom |
| Looker Studio | Quick, free ad-hoc dashboards tied to Google ecosystem; ideal for simple reporting | Limited blending, widget limits, slower with large datasets | Free |
| Zoho Analytics | Self-service ad-hoc reports for small-to-mid teams; low-code friendly | May lack performance for very complex queries or large data volumes | Starting at $24/user/month |
| Google Analytics 4 | Web behavior ad-hoc exploration with event-level granularity | Cannot generalize beyond web/app event data; limited for cross-channel data | Free |
| Tableau | Visual, flexible ad-hoc analysis with rich interactivity | Steeper learning curve for quick one-off reports; licensing even for viewers | Starting at $70/user/month |
| Power BI | Rapid ad-hoc reporting for users within Microsoft ecosystem | Requires DAX expertise for advanced queries; licensing layers may be restrictive | Starting at $20/user/month |
| Helical Insight | Developer-friendly open-source platform with embedded ad-hoc features | UI can feel technical; less polished for non-technical self-service use | Open-source core (free); enterprise editions are paid |
| LayerNext | AI-assisted ad-hoc insights via semantic modeling and natural language interaction | Overkill for simple queries; not suited for teams that prefer full manual control | Custom |
| Qlik Sense | Interactive, associative ad-hoc exploration across multi-dimensional datasets | Less ideal for pixel-perfect reporting or locked-format outputs | Custom |
| Whatagraph | Visually rich, cross-channel ad-hoc marketing reports quickly assembled | Limited data modeling or deep query customization | Custom |
| Databox | Rapid KPI dashboards and goal tracking; good for frequent fast snapshots | Not suited for deep analytics or complex transformations | Custom |
| Domo | Enterprise-grade with drag-and-drop ad-hoc reports and strong integration | Full platform may be heavyweight for basic one-off reporting | Custom |
| SAP Analytics Cloud | Live, ad-hoc reports in SAP environments with governance | Complex interface; rooted in broader planning workflows | Custom |
| Dotnet Report | Embedded ad-hoc reports within .NET apps; great for internal ops use | Not a standalone BI solution; limited advanced analytic depth | Custom |
| Sisense | Self-service, scalable ad-hoc analytics via ElastiCube modeling | Overkill for simple reporting needs; heavy setup for occasional users | Custom |
1. Improvado AI Agent
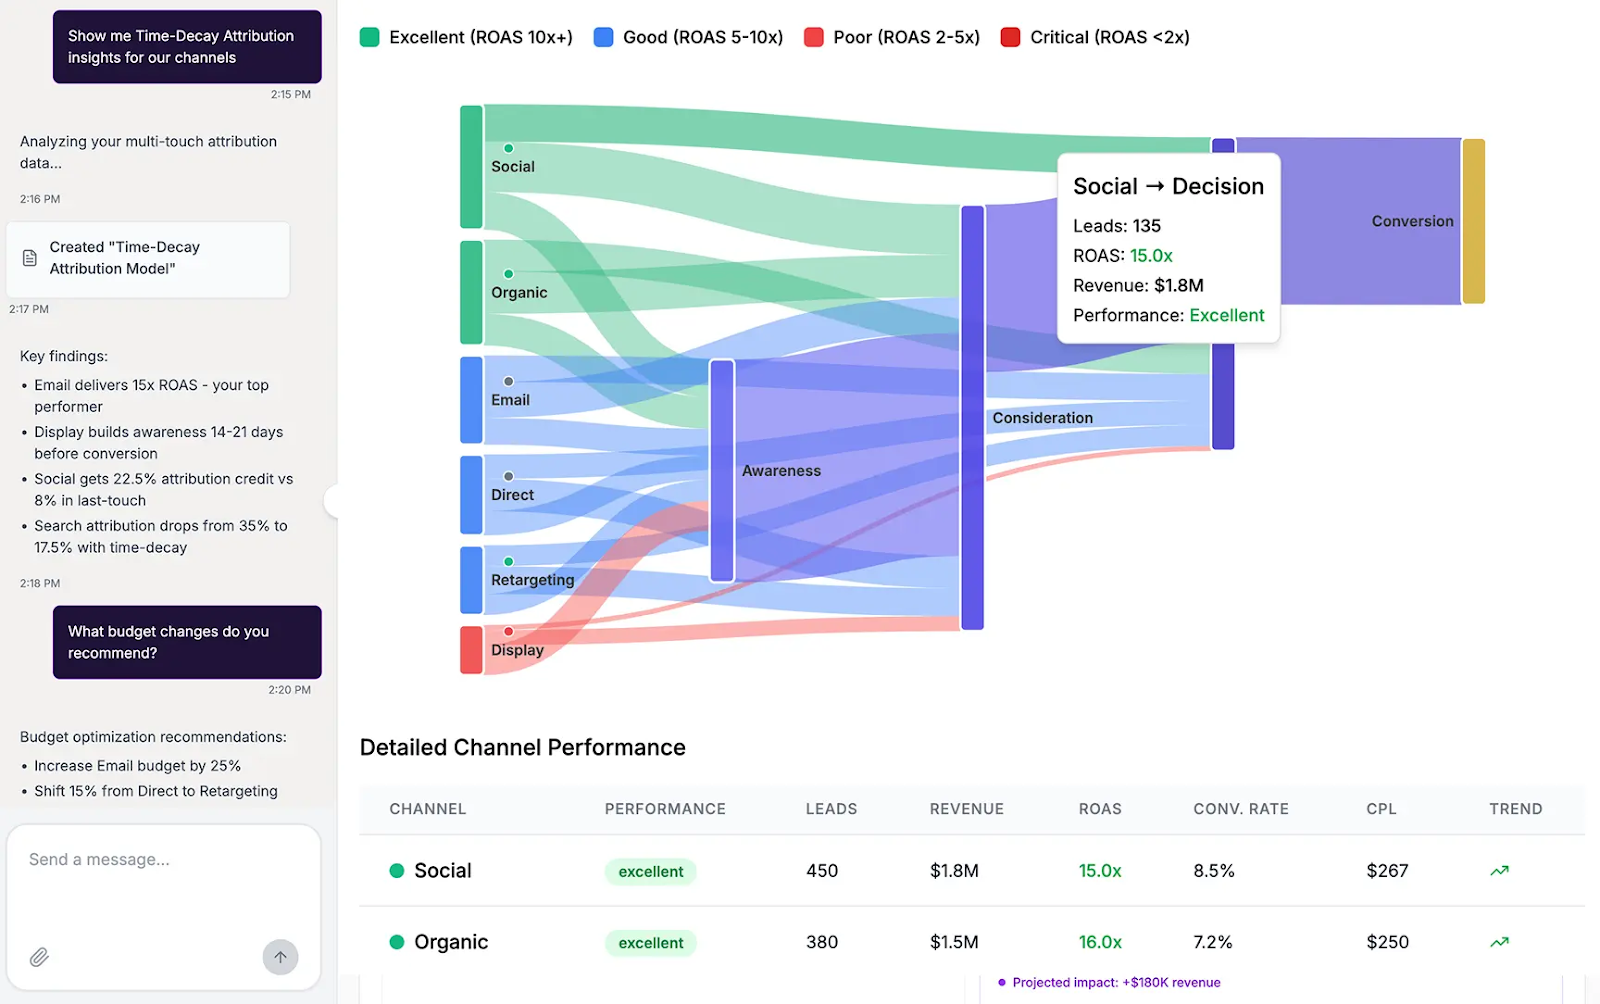
Improvado AI Agent is an AI-powered marketing analytics tool that enables natural language queries and seamless data exploration, analysis, and interpretation for technical and non-technical users.
AI Agent is connected to your marketing dataset and has a chat-like interface where you can ask any ad-hoc questions, build dashboards, pace ad spend, and more.
Key features for ad-hoc reporting:
- Intuitive query interfaces: AI Agent is powered by natural language processing (NLP) technology, meaning you can handle any ad-hoc request without writing a single line of SQL code.
- Proactive data insights: AI Agent is connected to your dataset and constantly monitors the data, alerting you to anomalies and opportunities.
- Accessible data visualization: Following your text commands, AI Agent can build any kind of reports and dashboards based on your data. Simple and easy-to-implement visualizations help with timely data analysis and agile strategy optimization.
- Robus data infrastructure: AI Agent is built on top of the Improvado data pipeline that ensures the accuracy and completeness of the data and Agent's output. Improvado automatically collects data from 1,000+ data sources, both online and offline, prepares it for further analysis, and loads the data to the warehouse or storage of your choice.
- Model agnostic: The Agent is model-agnostic, allowing users to switch between models for various task types. Organizations can customize the Agent, feeding it their business context, custom metrics, and other relevant data.

Improvado AI Agent is one of the best ad-hoc analysis tools suitable for technical marketing analysts and non-technical business users. The platform is built on top of a robust data pipeline, which ensures the agent's ability to swiftly access and manipulate data sets from various sources and generate accurate and relevant insights.
2. Looker Studio (Google Data Studio)
Looker Studio, previously known as Google Data Studio, is a dynamic ad-hoc analytics tool tailored for creating custom reports and dashboards. It integrates seamlessly with various data sources, including Google Ads, Analytics, Cloud Storage, and more, enabling a comprehensive view of your data landscape.
Key features for ad-hoc reporting:
- Customizable dashboards: Users can create tailored dashboards that highlight key metrics and trends, providing a clear snapshot of performance at a glance. The Looker Studio gallery features dozens of free dashboard templates for multiple use cases, which helps kick off analytics fast.
- Interactive reporting: Looker Studio reports are interactive, allowing users to drill down into the data for more detailed insights, which is crucial for ad-hoc analysis.
- Data source integration: It offers robust integration capabilities, pulling data from multiple sources into a single report. This feature simplifies the process of analyzing data across different platforms.
- Collaboration tools: Looker Studio supports real-time collaboration, enabling teams to work together on reports and dashboards. This facilitates a more cohesive data analysis process.
- Accessible data visualization: With a variety of visualization options, Looker Studio makes it easier to interpret complex datasets, aiding in the quick identification of trends and anomalies.
Looker Studio's emphasis on customization, integration, and collaboration makes it a great ad-hoc analysis tool suitable for conducting thorough ad-hoc analyses without extensive technical know-how.
3. Zoho Analytics
Zoho Analytics offers a robust platform for ad-hoc analysis, combining advanced reporting capabilities with an intuitive interface. Designed to facilitate deep data analysis, it provides a broad range of features from drag-and-drop report creation to AI-assisted insights, catering to the diverse analytical needs.
Key features for ad-hoc reporting:
- Drag-and-drop interface: Simplifies the creation of reports and dashboards, making data analysis accessible to users of all skill levels without the need for extensive technical knowledge.
- Wide range of visualization options: Offers a variety of charts, widgets, and pivot tables, enabling users to present data in an easy-to-understand way.
- AI-powered assistant: Zia, Zoho's AI-powered assistant, provides users with intelligent insights, making data analysis and interpretation quicker and more intuitive.
- Seamless data integration: Capable of integrating with multiple data sources, including both Zoho apps and external services, to provide a holistic view of business data.
- Collaboration and sharing: Features robust collaboration tools, allowing teams to share insights and make data-driven decisions together, enhancing the collective understanding of the data.
Zoho Analytics is tailored for those who require a detailed, yet straightforward approach to data analysis, offering powerful features that streamline the ad-hoc reporting process, from data integration to visualization and collaboration.
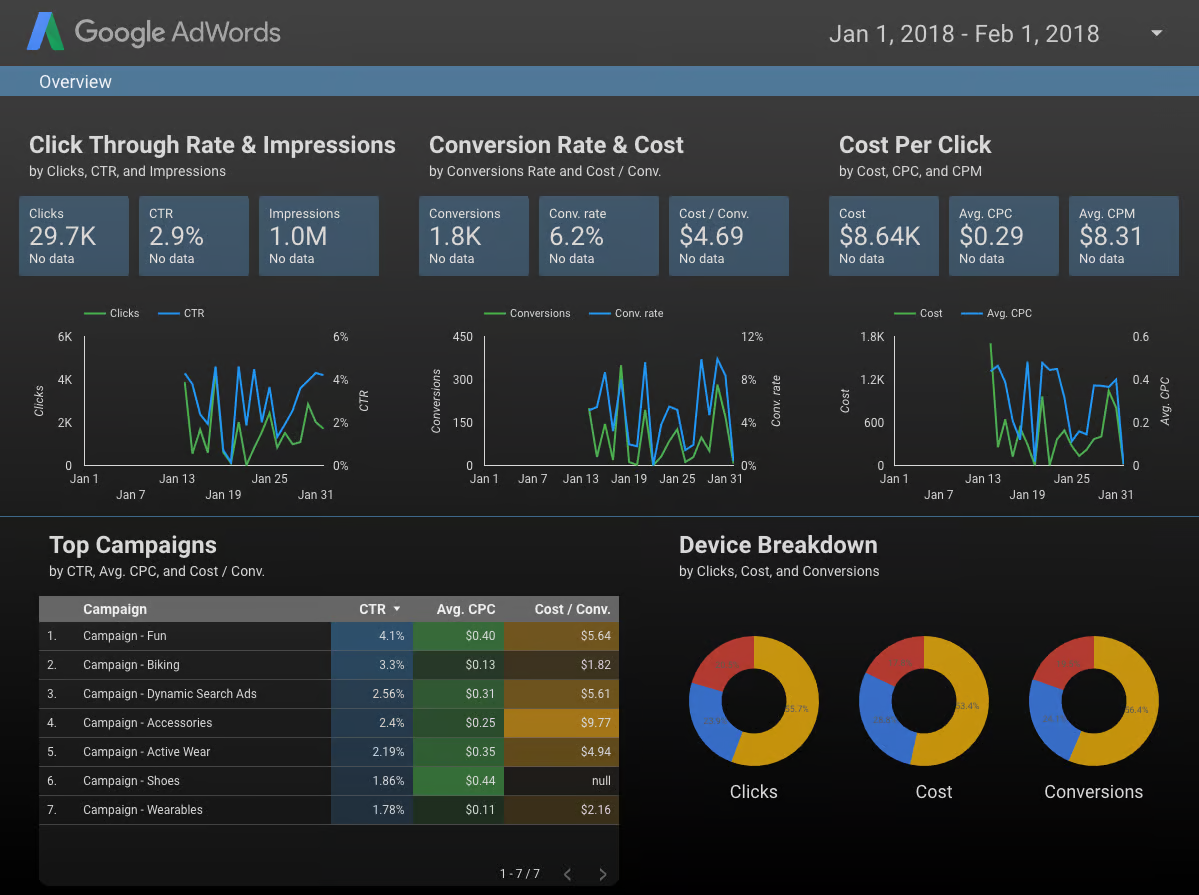
4. Google Analytics 4
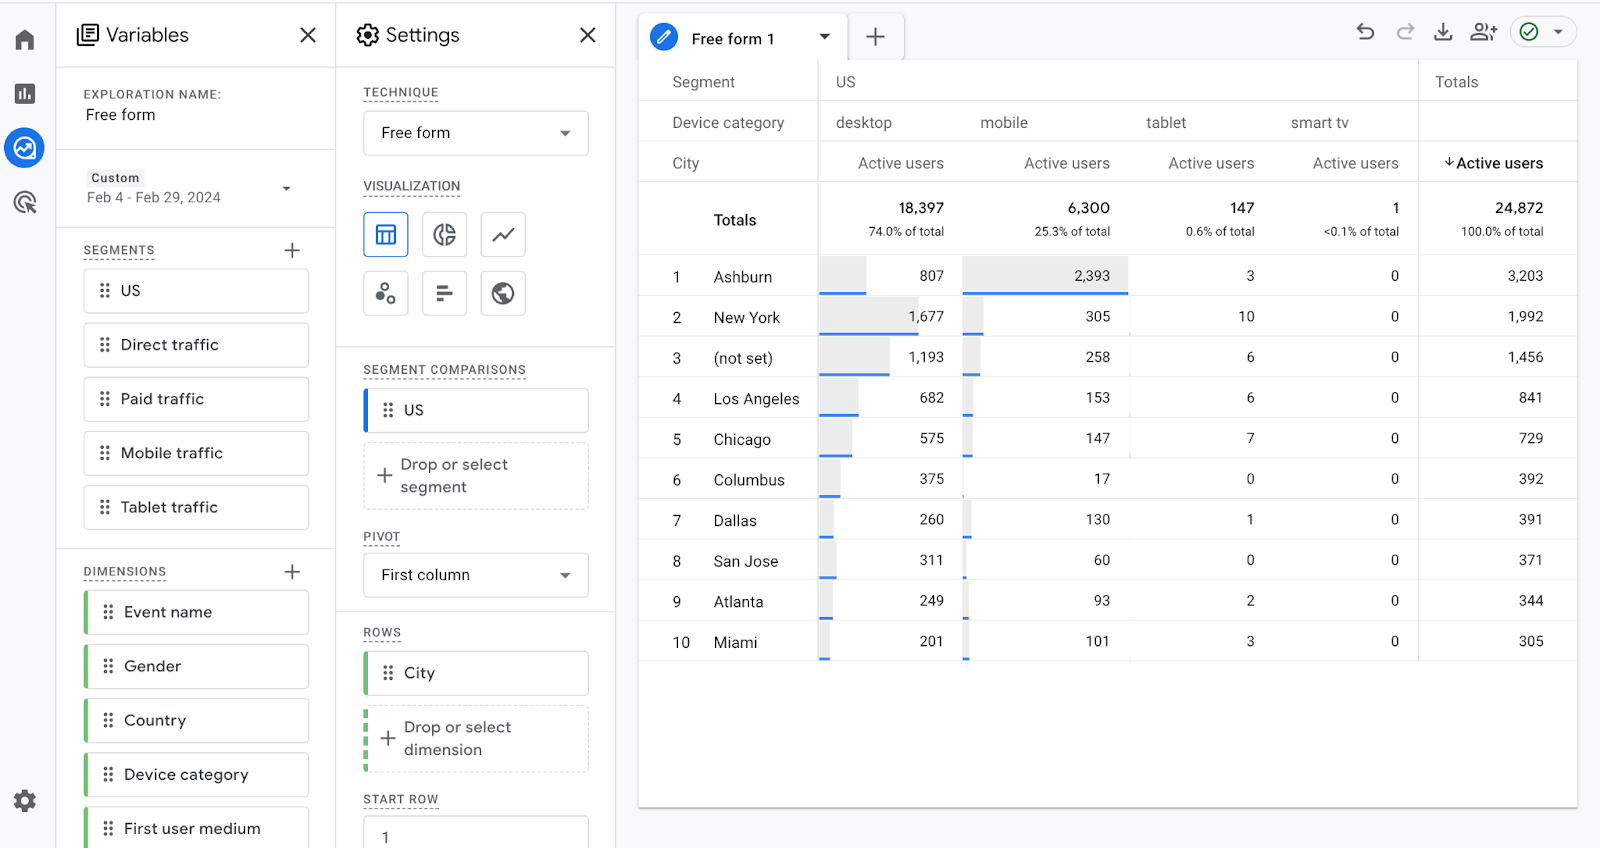
Even though Google Analytics 4 is primarily known as a web analytics tool, it offers extensive capabilities for overall marketing ad-hoc reporting, enabling marketers and analysts to delve deep into user behavior and website performance insights. These features support real-time decision-making and strategic action based on detailed user interactions.
Key features for ad-hoc reporting:
- Event-based data model: Unlike its predecessors, GA4 uses an event-based data model that allows for more flexible and detailed tracking of user interactions across websites and apps.
- Advanced segmentation: Users can create custom segments based on a wide array of user behaviors and attributes, enabling more granular analysis of specific user groups.
- Enhanced reporting interface: GA4 offers a more intuitive reporting interface, with customizable reports that can be tailored to meet specific business needs.
- Predictive metrics: Leveraging machine learning, GA4 provides predictive metrics such as potential revenue from specific customer segments, helping to forecast future actions and trends.
- Cross-platform analysis: With its focus on a unified user journey, GA4 enables cross-platform tracking and analysis, offering insights into how users interact with a brand across different devices and channels.
Google Analytics 4 is tailored for brands aiming to leverage advanced web analytics for detailed ad-hoc reporting, offering deep insights into user behavior and the effectiveness of digital marketing efforts.
5. Tableau
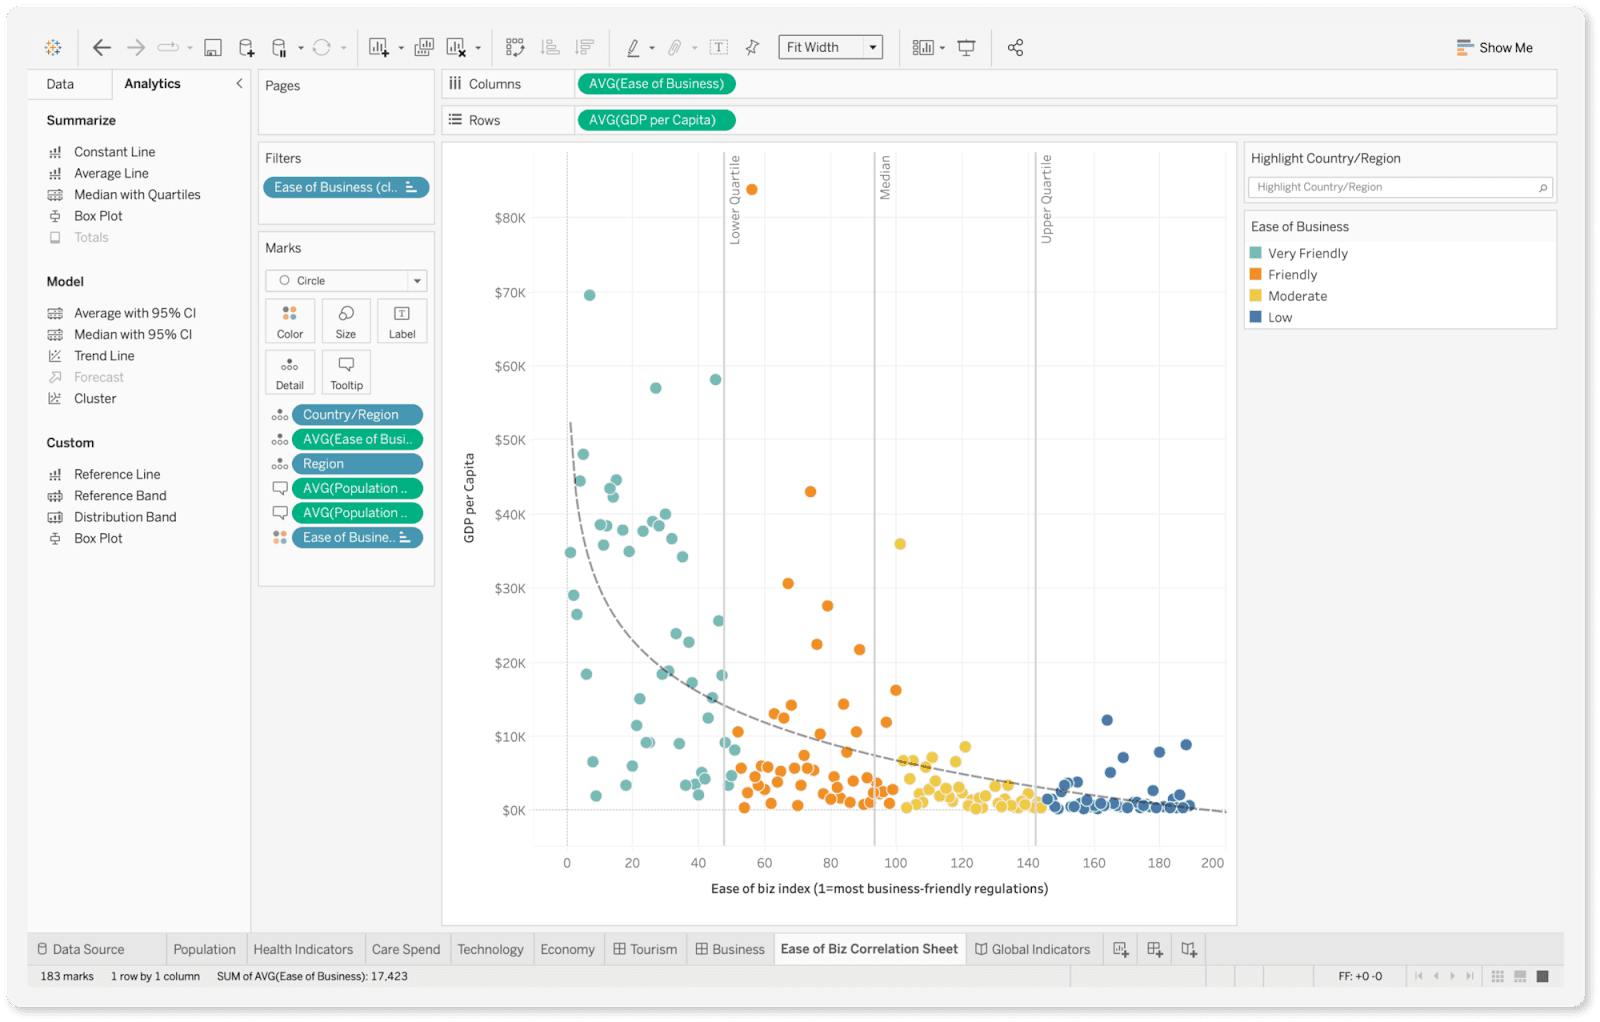
Tableau is an enterprise-grade business intelligence solution known for its sophisticated data visualization features. Despite its advanced capabilities, its user-friendly interface makes it equally suitable for ad-hoc analysis.
Key features for ad-hoc reporting:
- Drag-and-drop interface: This enables users to easily create and customize reports without needing extensive technical skills, facilitating quick data exploration and visualization.
- Highly interactive dashboards: Offers dynamic dashboards that allow users to drill down into specifics, making it simpler to uncover detailed insights from large datasets.
- Flexible data connectivity: Connects to a wide array of data sources, including cloud databases, spreadsheets, and even big data, ensuring comprehensive analysis across multiple data points.
- Advanced data blending: Allows for the combination of data from different sources, enabling deeper, more nuanced analysis without the need for external data processing tools.
- Real-time data updates: Supports real-time data refreshes, ensuring that reports and dashboards always reflect the most current data available for timely decision-making.
6. Power BI
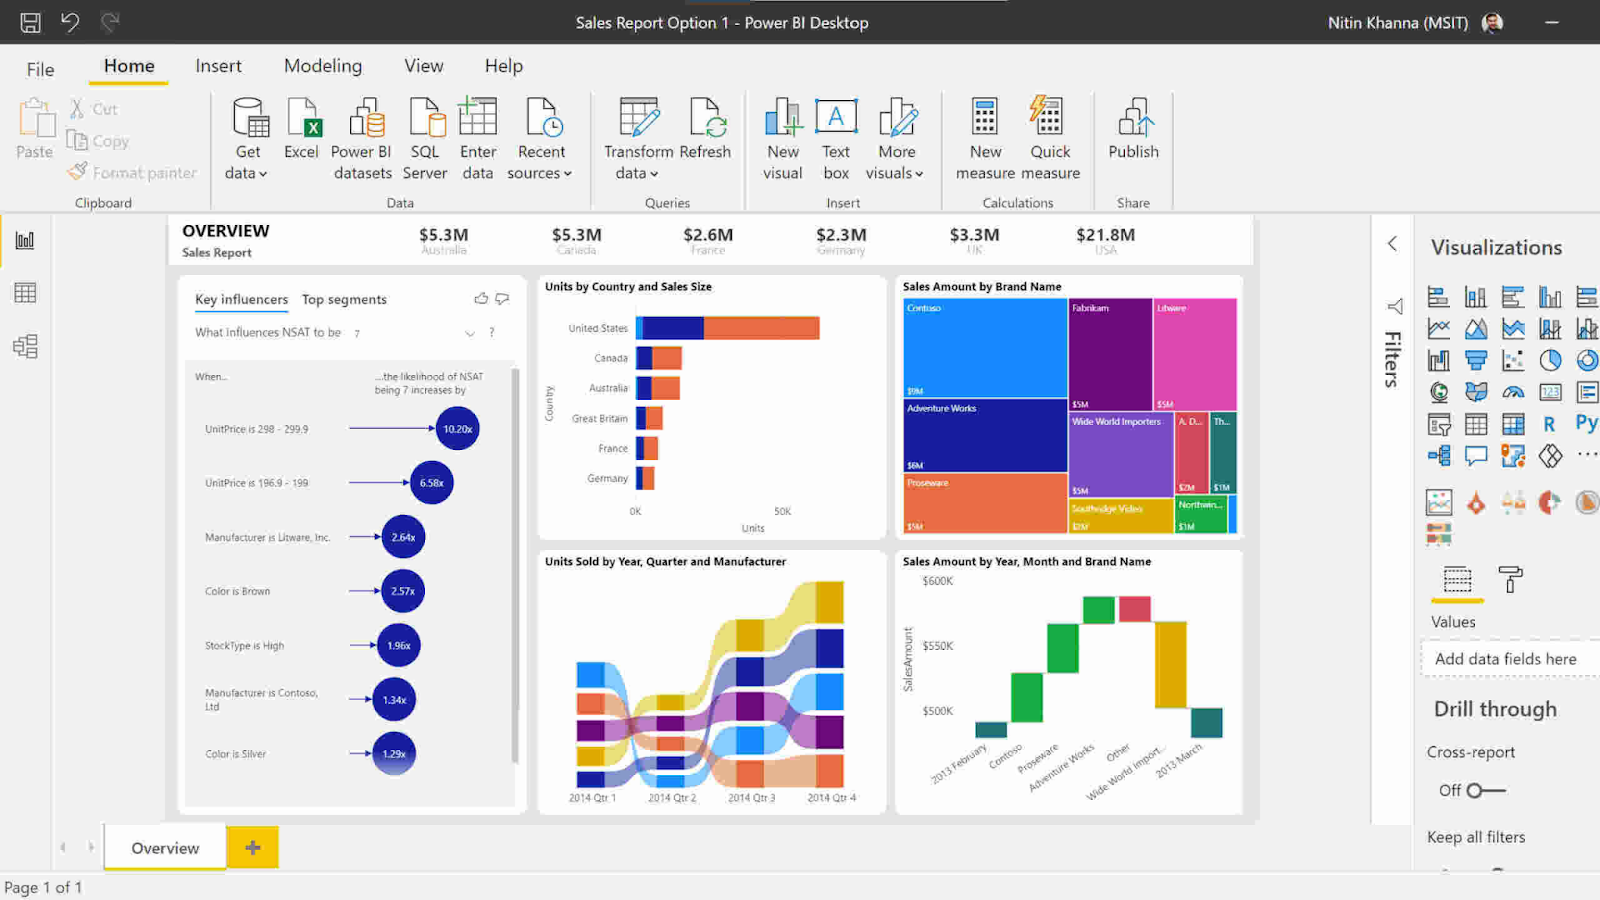
While Microsoft Power BI is widely recognized as a full-scale business intelligence and enterprise analytics platform, its intuitive interface, self-service design, and seamless integration with Microsoft 365 make it highly effective for ad-hoc reporting.
Key features for ad-hoc reporting:
- Drag-and-drop interface: Power BI’s report builder allows users to create visuals and dashboards without coding, making ad-hoc exploration fast and intuitive.
- Natural Language Query: Users can ask questions in plain English, such as “What are sales by region this quarter?”, and Power BI automatically generates the appropriate visual.
- Interactive filtering and drill-downs: Reports allow dynamic slicing and filtering, letting users drill into specific dimensions or timeframes in real time.
- Seamless Microsoft 365 integration: Native integration with Excel, Teams, and SharePoint simplifies collaboration and distribution of ad-hoc reports across departments.
- Self-service governance controls: Role-based access and governed data models ensure that while ad-hoc reports can be built quickly, they remain consistent with enterprise definitions and compliance standards.
7. Helical Insight
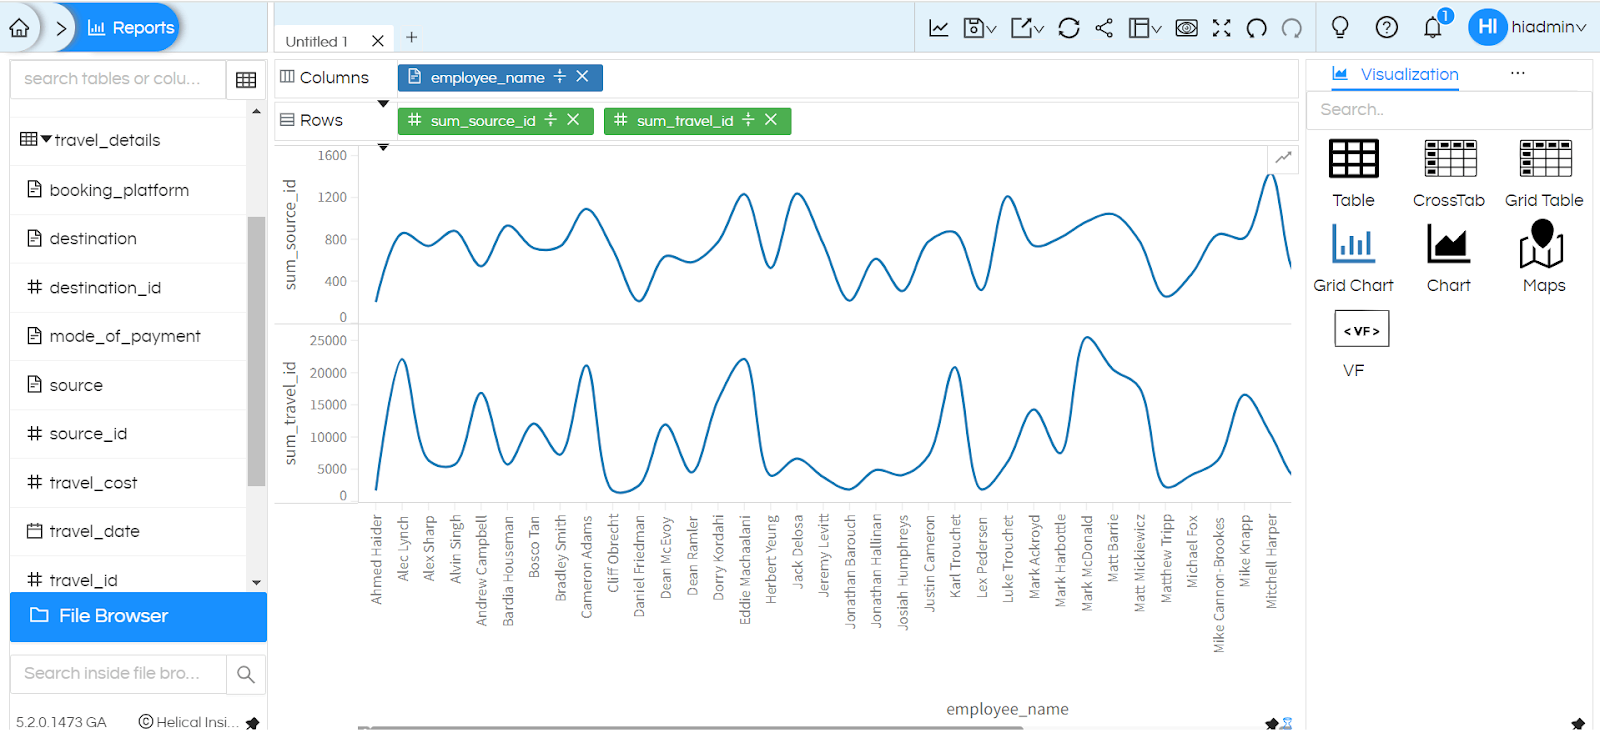
Helical Insight positions itself as one of the first open-source BI platforms with a strong developer-first foundation, while also incorporating robust self-service and natural language features that make it effective for ad-hoc reporting.
Key features for ad-hoc reporting:
- Self-service BI: Users can build reports and dashboards using a simple drag-and-drop interface, no SQL or coding required, making rapid exploration accessible to analysts and ops teams alike.
- Instant BI (NLP-driven): Report creation can be triggered via natural language queries. Asking the system, "Show me sales this quarter," instantly generates the corresponding insights.
- Canned reports & paginated output: The tool supports pixel-perfect, printer-ready output, such as invoices, P&L statements, or balance sheets, working well for both ad-hoc snapshots and formal documents.
- Browser-based, responsive design: Fully browser-based and responsive across devices, it ensures analysts can access and refine reports from anywhere, whether at their desk or on mobile.
8. LayerNext
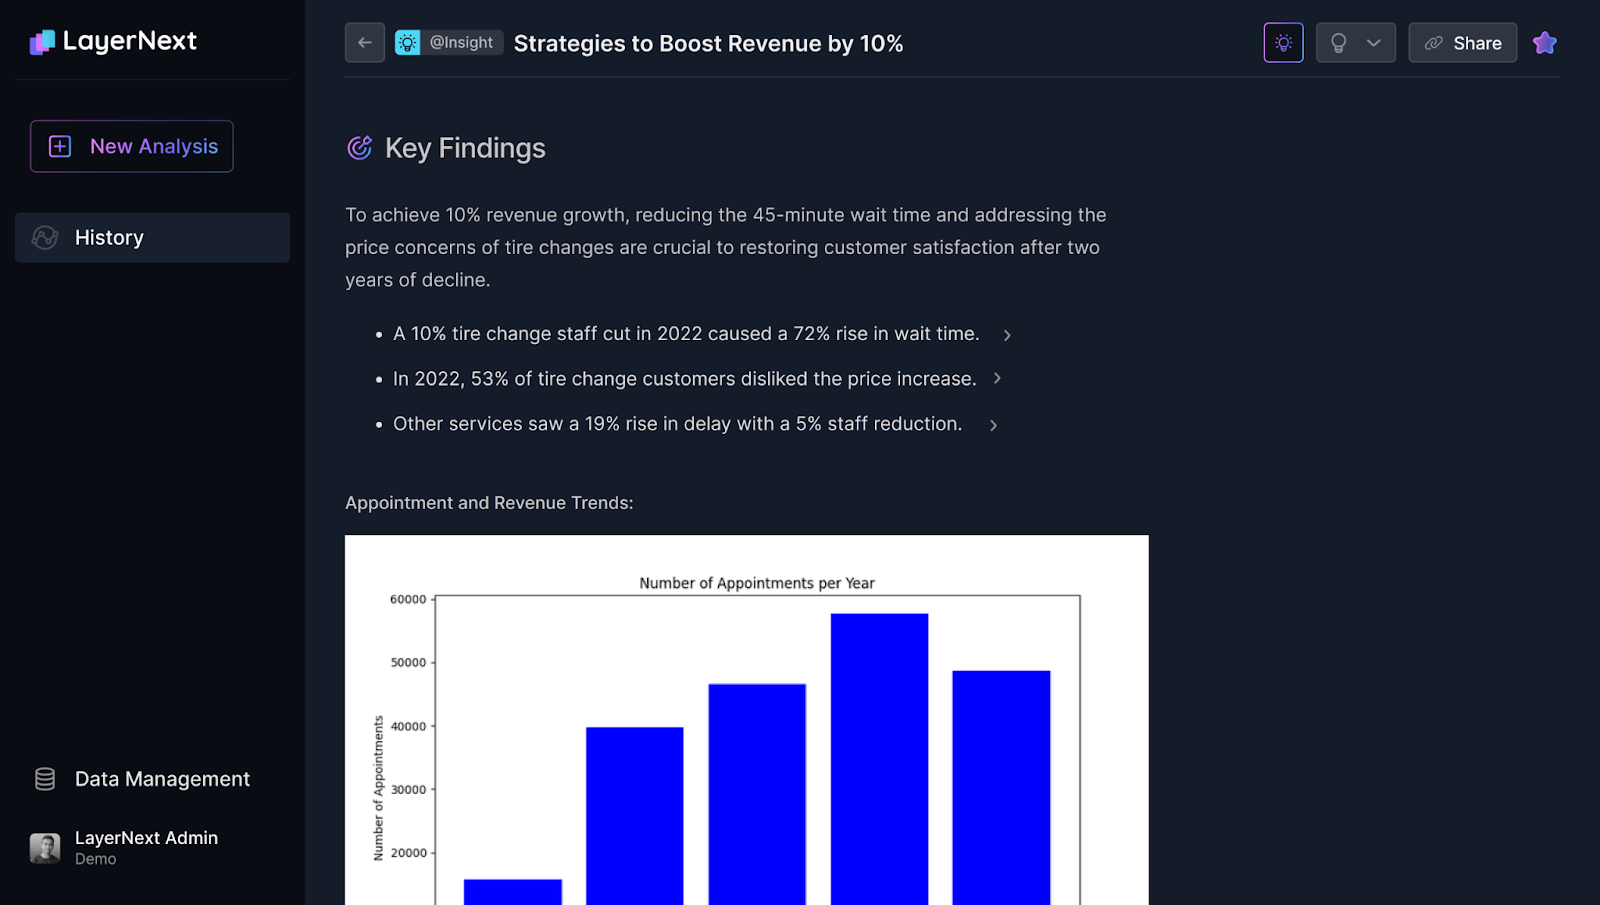
LayerNext is built as a strategic intelligence layer that bridges data warehouses, analytics platforms, and business teams. Instead of relying only on static dashboards, it creates a semantic model of the business that enables both structured reporting and ad-hoc exploration.
Key features for ad-hoc reporting:
- Semantic data layer: LayerNext automatically maps and models data sources, providing a unified semantic layer that simplifies how users query information and reduces dependency on raw SQL.
- AI-driven insight discovery: The platform applies AI agents to surface trends, detect anomalies, and explain underlying drivers, reducing the time from data refresh to actionable insight.
- Natural language interaction: Business users can frame questions in everyday language, while the system translates them into accurate queries, making ad-hoc reporting more accessible without compromising analytical depth.
- Adaptive data processing: LayerNext continuously learns from user interactions, prioritizing the most relevant metrics and insights, which makes ad-hoc exploration faster and more aligned to business context.
9. Qlik Sense
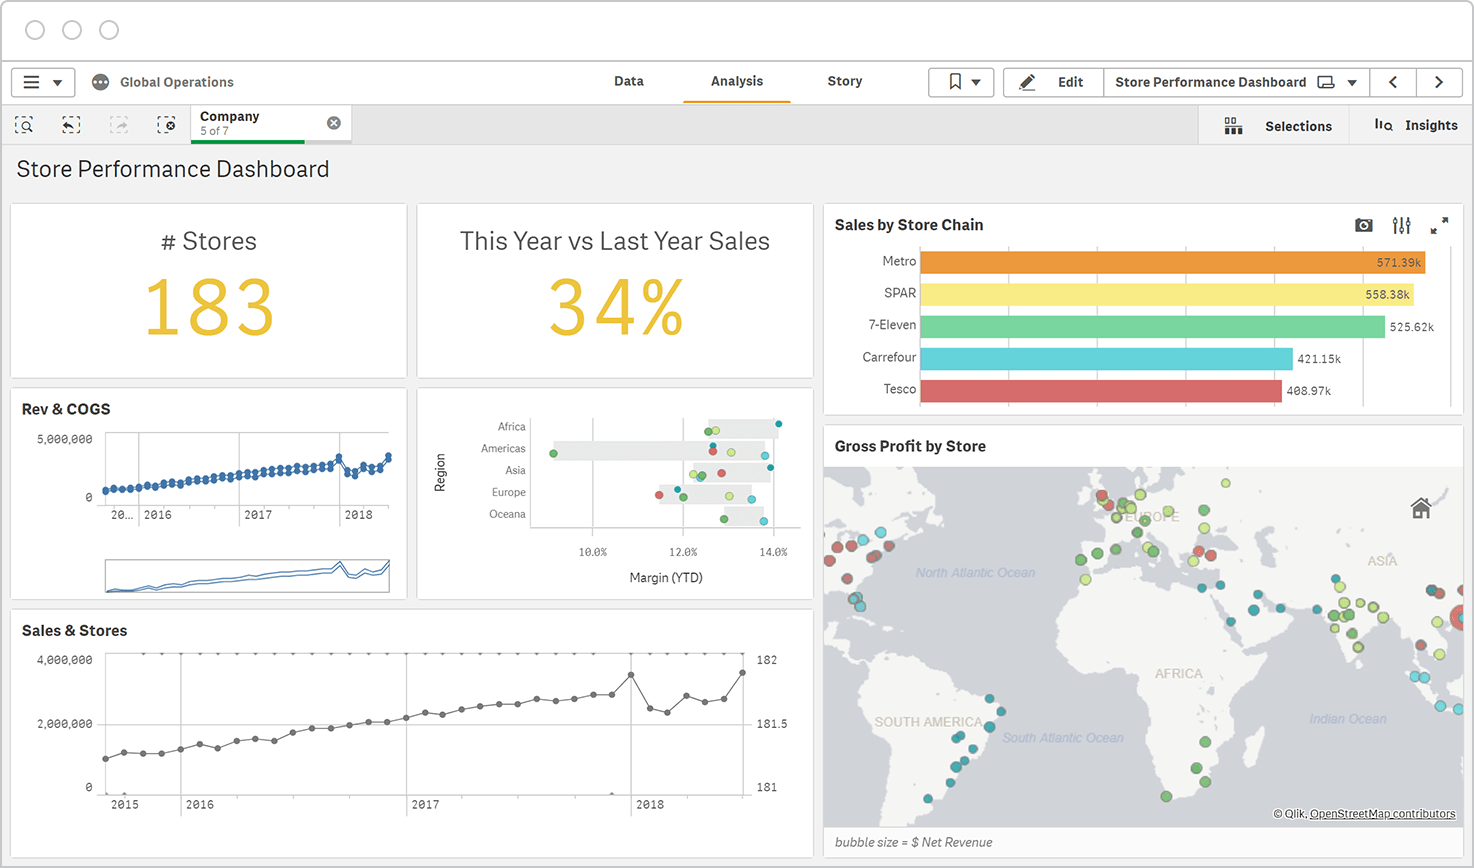
Qlik Sense is a modern analytics platform built on its associative data engine, which allows users to freely explore data without being restricted to predefined queries. This capability makes it useful for ad-hoc reporting, where analysts or business teams need to pivot quickly, uncover relationships between datasets, and generate new views of the data in real time.
Key features for ad-hoc reporting:
- Associative exploration: Users can click into any data point and view its connections across all other fields, enabling fast and flexible exploration, as well as ad-hoc insight generation.
- Dynamic field selection: Reports can be customized on the fly by selecting different measures or dimensions, allowing teams to build context-specific reports without complex setup.
- Customizable ad-hoc reports: Qlik enables the creation of interactive reports directly within the platform, offering options for custom tables and charts that respond instantly to user selections.
- Conditional visibility logic: Analysts can apply expressions to control how report elements are displayed, keeping ad-hoc outputs relevant and avoiding clutter.
- Flexible time filters: Built-in support for dynamic filters, such as YTD, MTD, or WTD, makes it easier to perform time-based comparisons in ad-hoc reports.
10. Whatagraph
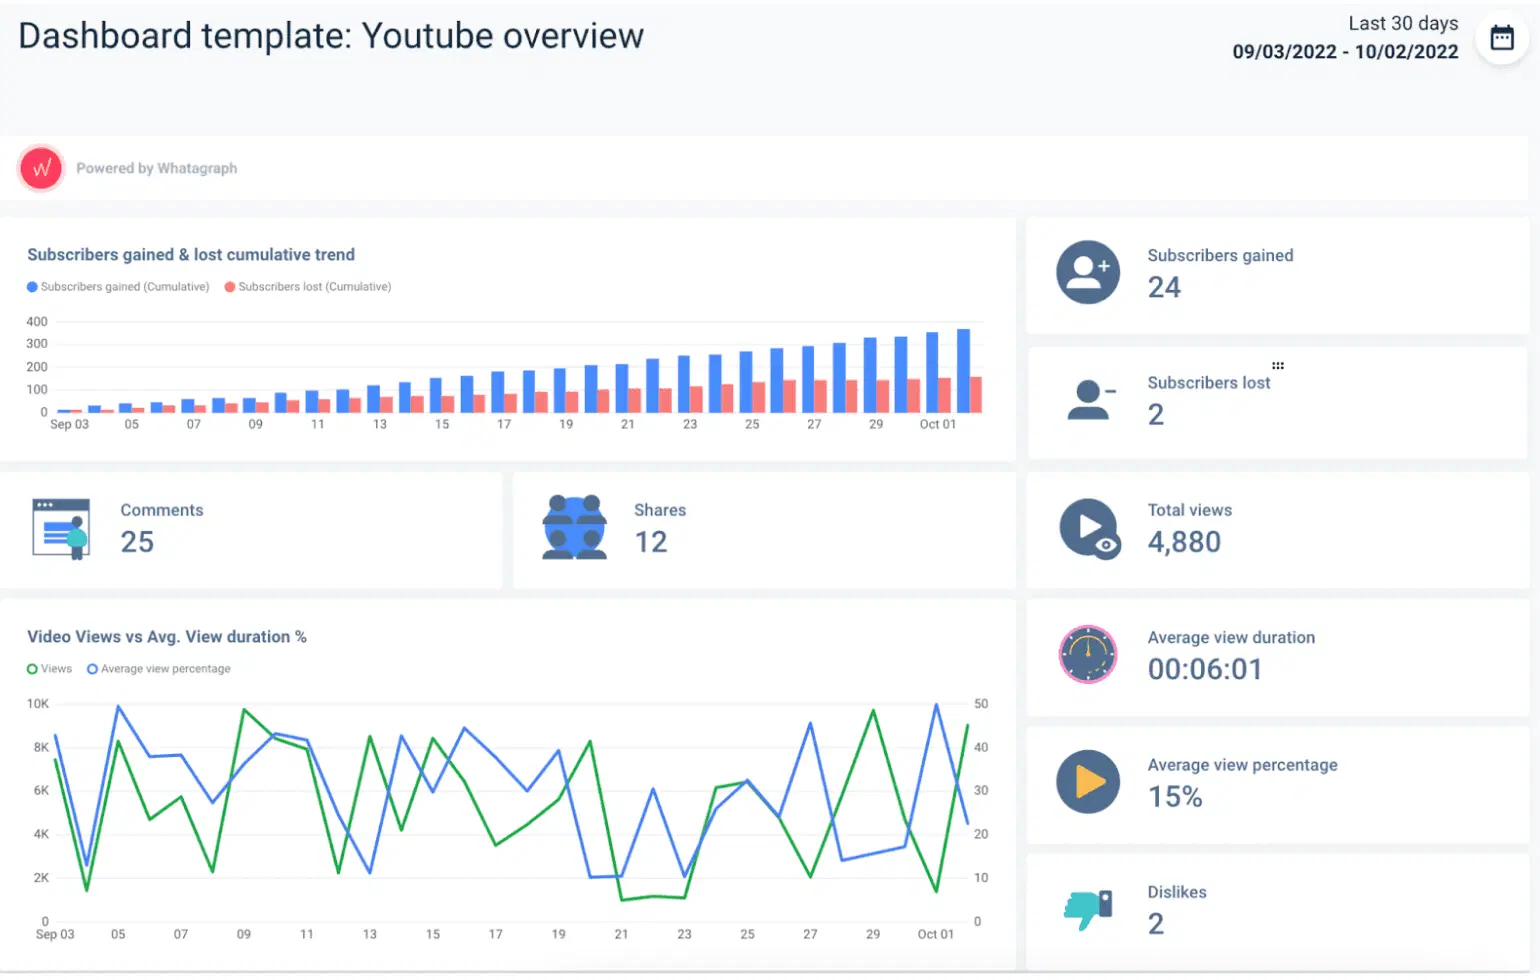
Whatagraph is a lightweight marketing reporting tool. It enables teams to quickly blend, visualize, and customize multi-channel metrics through drag-and-drop widgets and templates.
Key features for ad-hoc reporting:
- Visual report builder: Build rich, multi-tab reports with interactive widgets, including charts, tables, media elements, organically using drag-and-drop layout.
- Cross-channel data blending: Combine metrics from different platforms into unified visuals or custom calculations without requiring coding.
- Templates and linked reports: Save individual components or entire reports as templates. Apply updates across multiple linked reports simultaneously for consistency and efficiency.
- Goal tracking widgets: Incorporate KPI goals visually (such as progress bars or thresholds) to highlight performance relative to targets in real-time.
11. Databox
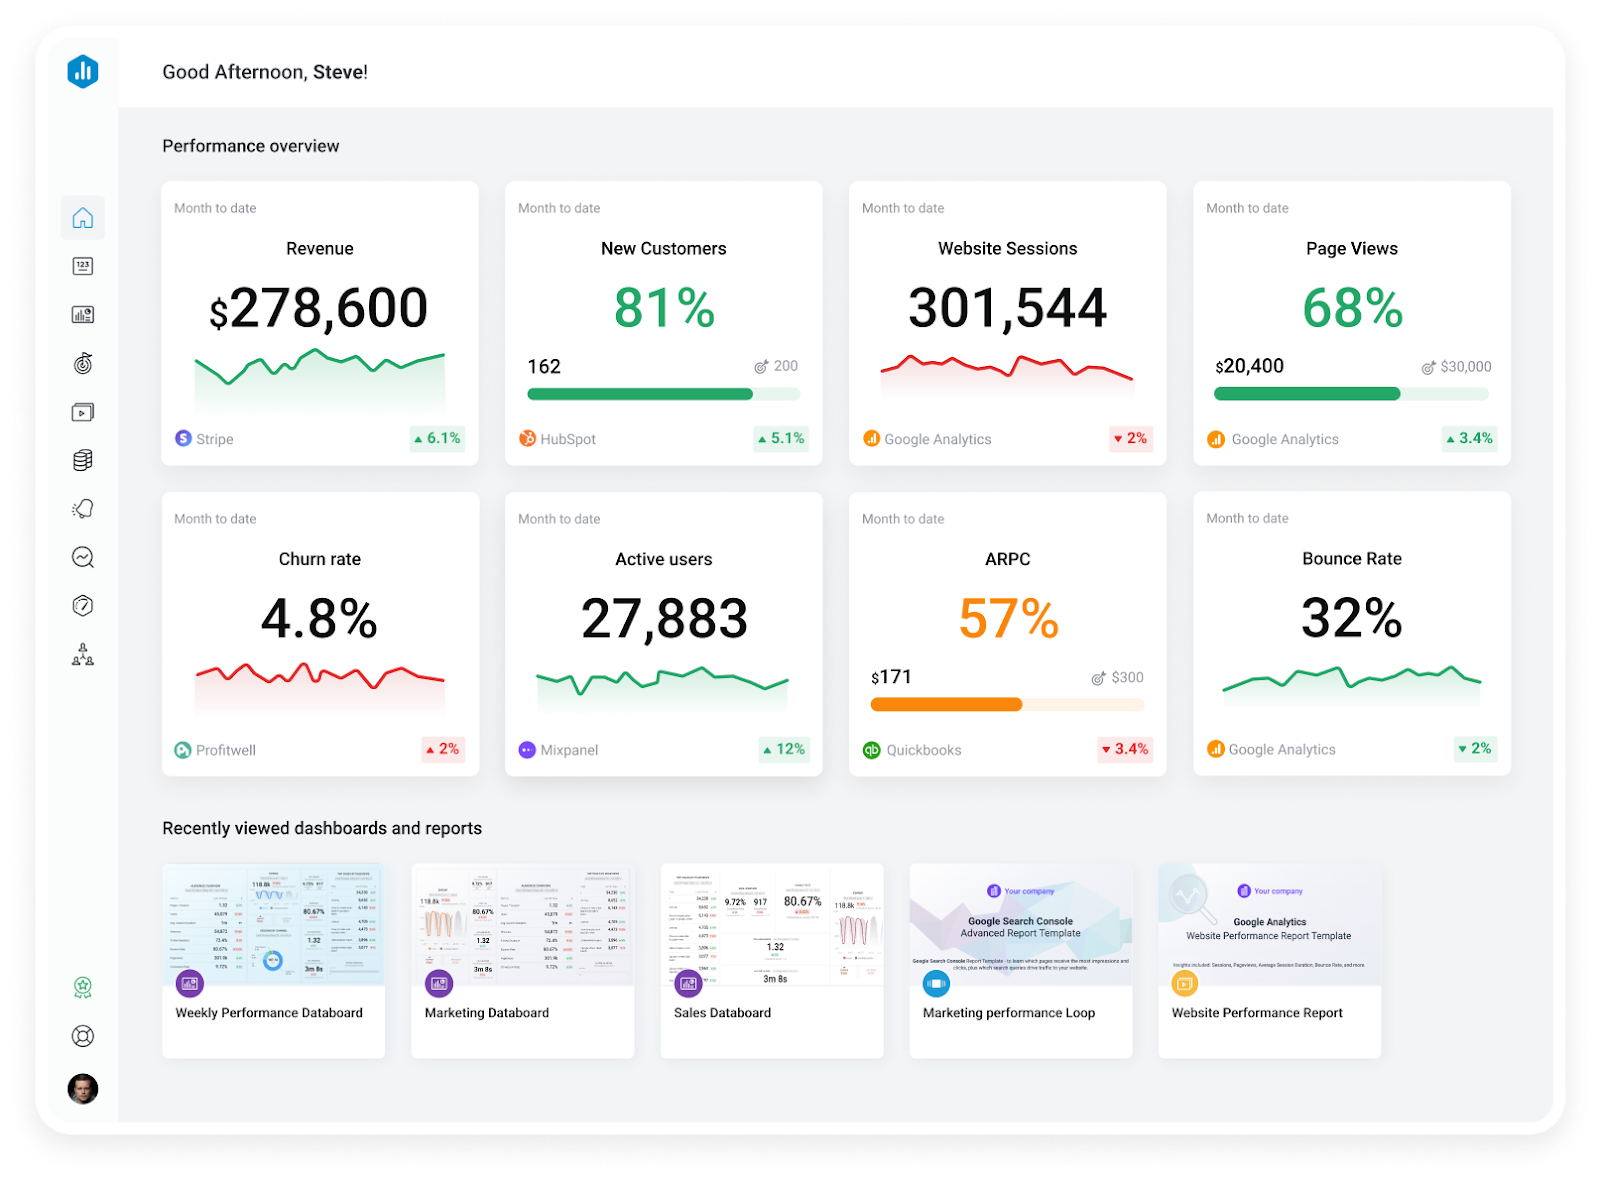
Databox is a streamlined, visual reporting platform built for fast marketing insights. Its no-code interface, prebuilt templates, and automated data integrations empower teams to generate polished, on-demand reports without relying on engineering or manual spreadsheet assembly.
Key features for ad-hoc reporting:
- Drag-and-drop dashboard builder: Users can visually assemble dashboards and reports using predesigned widgets and layouts—no coding required.
- Template-driven reporting: Ready-made templates and metrics (Databoards) enable teams to spin up ad-hoc reports instantly, then customize them as needed.
- Automated report delivery: Reports can be scheduled and shared automatically, whether via email, Slack, or shared links—removing repetitive manual effort.
- Goal tracking and visual indicators: Dynamic visuals, such as progress bars and thresholds, help teams track KPIs against targets in real-time.
- AI-powered summaries and alerts: Built-in performance summaries and anomaly alerts surface key insights, enabling teams to act quickly without requiring in-depth analysis.
12. Domo
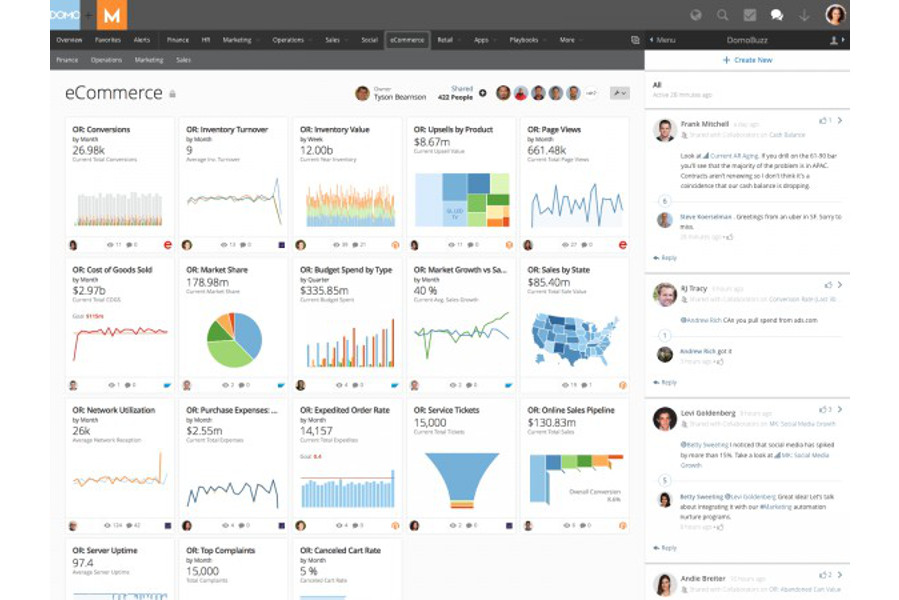
Domo is an advanced cloud-based analytics and business intelligence platform built for enterprise-scale data integration, visualization, and decision-making. While its core strength lies in managing complex data environments, Domo also offers features that make it practical for ad-hoc reporting.
Key features for ad-hoc reporting:
- Drag-and-drop ad-hoc analysis: Domo enables users to construct charts and reports visually using drag-and-drop tools. Its flexible interface supports quick exploration across datasets, enabling spontaneous insights without scripting.
- Rich visualization options: Users can choose from 150+ chart types and 7,000+ custom map options to tailor visuals for different contexts.
- Instant calculations and shared metrics: Ad-hoc reporting is simplified with inline calculations that users can share across the team. This consistency helps maintain metric alignment without relying on static modeling layers.
- Mobile-ready reporting: Domo’s mobile-friendly dashboards enable teams to explore data and generate insights on the go, making them especially valuable for marketing leaders who need agility in fast-paced situations.
- Automated workflows and alerts: Once an ad-hoc insight is built, teams can automate report distribution or set alerts to monitor key metrics, ensuring timely decision-making even without active dashboard checks.
13. SAP Analytics Cloud
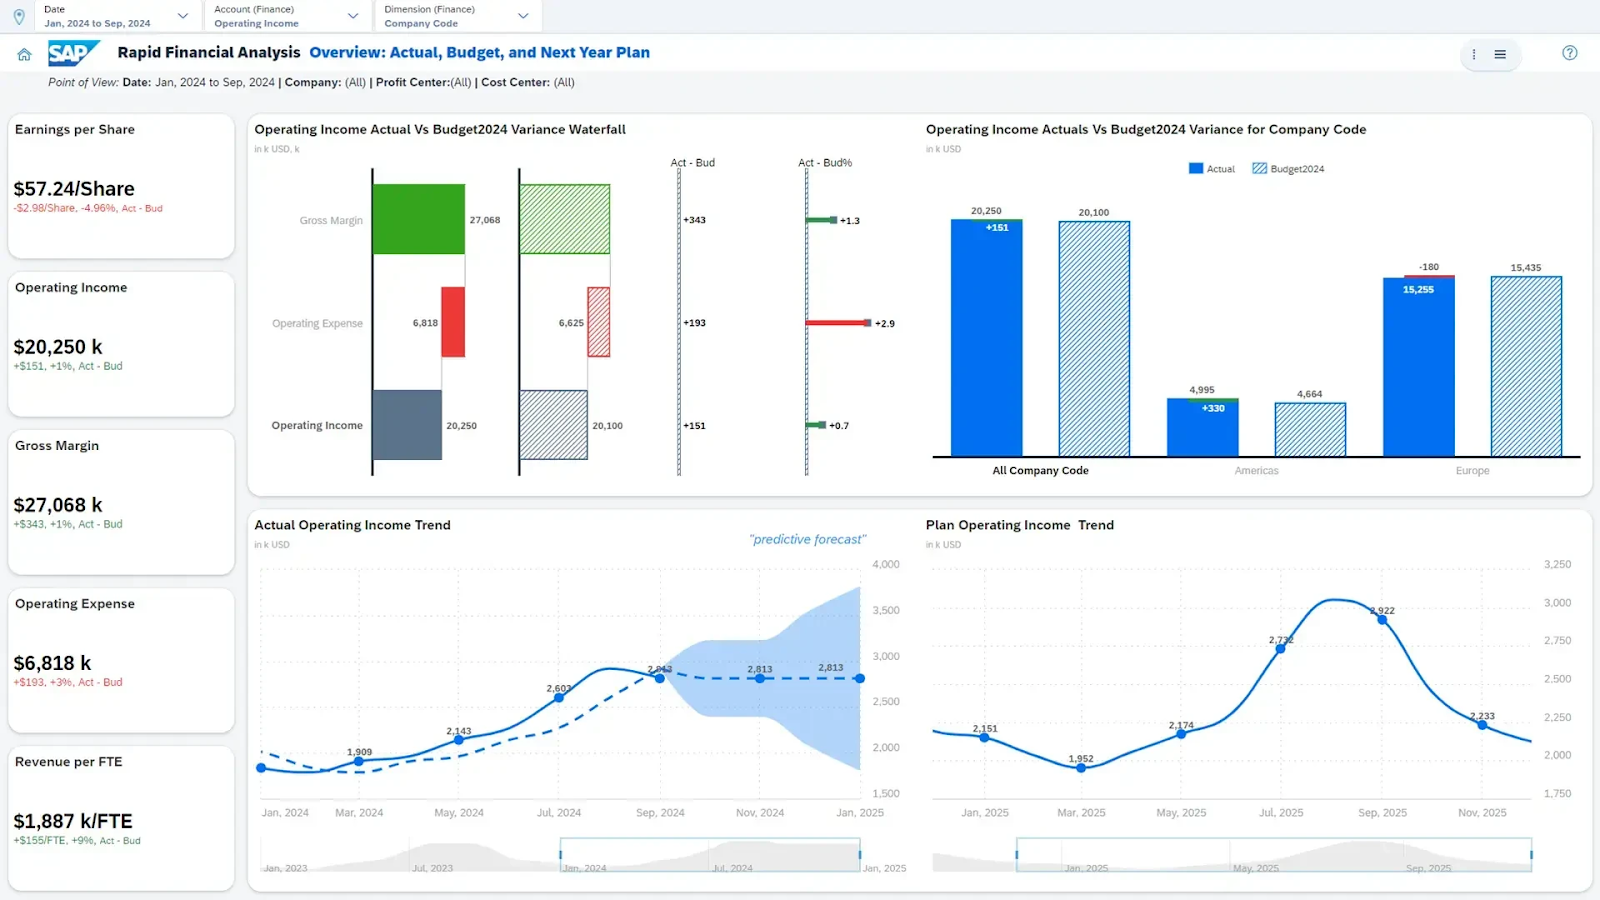
SAP Analytics Cloud is a unified, cloud-based platform that combines business intelligence, predictive analytics, and planning capabilities within a single interface. While it is a full-scale analytics and planning solution, SAC also supports agile ad-hoc reporting through built-in self-service tools.
Key features for ad-hoc reporting:
- Data Analyzer for instant exploration: SAC’s Data Analyzer enables deep, multidimensional pivot-style analysis of live data sources, allowing users to drill into data interactively and save exploratory insights as reusable assets.
- Natural Language Queries: Users can type queries in plain English, such as “Show sales by region this month,” and SAC will generate the corresponding visual automatically, making ad-hoc reporting more accessible to those with minimal training.
- Story design and visual filtering: Reports (or “stories”) are built by layering charts, tables, and narrative components. Users can apply dynamic filters and drill-through interactions directly within stories to adapt visuals on the fly.
- Self-service with governance: Role-based access, reuse of existing SAP authorizations, and support for approved visual standards ensure ad-hoc analysis remains compliant. Users can create and share reports without compromising enterprise data governance.
Common Use Cases for Ad Hoc Analysis
Ad hoc reporting tools are invaluable across various business functions, providing immediate answers to pressing questions.
1. Marketing campaign performance analysis
Marketing teams frequently use ad hoc reports to dive deep into campaign performance. For example, a marketing executive might want to know:
- "Which specific ad creative generated the highest lead volume last week across all platforms?"
- "What was the cost per acquisition (CPA) for our holiday campaign, specifically among users in a certain demographic?"
- "How did our email open rates compare for subscribers who clicked on a specific link vs. those who didn't?"
This allows for real-time optimization and a better understanding of ROI.
2. Sales funnel and revenue tracking
Sales leaders and teams leverage ad hoc reports to understand sales pipeline health and revenue drivers:
- "What is the current conversion rate from MQL to SQL for leads generated by a specific event?"
- "Which sales representative closed the most deals over $50k in the last quarter, segmented by product?"
- "Why did our average deal size decrease in the Western region this month?"
Such on-demand analysis helps identify bottlenecks, optimize sales strategies, and forecast revenue more accurately.
3. Operational efficiency and bottleneck identification
Operations teams use ad hoc reporting to monitor processes and identify inefficiencies:
- "What is the average time taken to resolve customer support tickets for a specific product line?"
- "Which manufacturing process experienced the most downtime last month, and what was the root cause?"
- "How does employee productivity vary across different departments or shifts?"
This granular data exploration helps streamline operations, improve resource allocation, and enhance overall efficiency.
How to Choose the Right Ad Hoc Reporting Tool for Your Business
Selecting the ideal ad hoc reporting software requires careful consideration of your organization's unique requirements.
1. Assess your team's technical skill level
Consider who will be using the tool.
- If your primary users are non-technical business users, prioritize tools with an intuitive query interface, drag-and-drop functionality, and AI-powered natural language capabilities like Improvado AI Agent.
- If you have data analysts or engineers who will be building complex models, a more robust, technically sophisticated platform might be more suitable.
2. Identify your key data sources
Make a comprehensive list of all the data sources you need to connect to. This includes CRM systems like Salesforce, HubSpot, ad platforms like Google Ads, Meta Ads, web analytics (GA4), marketing automation tools, databases, and spreadsheets.
Ensure the chosen tool offers robust, reliable, and preferably pre-built integrations for all your critical sources. Specialized solutions like Improvado excel here for marketing and sales data.
3. Consider scalability and future needs
Your data volume and analytical needs will likely grow. Choose a reporting solution that can scale with your organization, handling increasing amounts of data and more complex queries without performance degradation.
Think about whether you'll need cloud-based or on-premise deployment, and ensure the tool can support your anticipated growth.
4. Evaluate cost vs. features
Ad hoc reporting tools come at various price points, from free like Looker Studio to enterprise-level subscriptions.
Evaluate the features offered against their cost. Does the tool provide the necessary data visualization options, real-time access, and customization capabilities for your budget?
Remember to factor in potential training costs and the time saved by automating data analysis and reporting processes.
5. Consider UI and UX
Even with great tools and data in hand, marketing transformation can stall if people and processes don’t align.
Adopting user-friendly ad-hoc analytics tools can empower non-experts. For example, using a no-code analytics tool or intuitive dashboards means a brand manager can pull their own reports or run simple cohort analyses without always relying on a data scientist. This self-service capability increases adoption.
As adoption ramps up, establish a feedback loop with the platform provider.
Improvado provides a dedicated customer success manager to all its enterprise clients. A structured feedback cadence ensures the platform evolves with the client's needs and drives long-term success across teams.
"We have weekly meetings with Improvado representatives, and that really helps get things done quicker. We can raise a ticket, ask them to look at it, and they’ll push it forward if needed.”

Implementation Tips for Ad-Hoc Analysis Software
Implementing ad-hoc analysis software effectively is crucial for unlocking the full potential of your data and making informed, timely decisions. This section provides practical tips to guide organizations through the process.
Here are practical tips for a successful implementation:
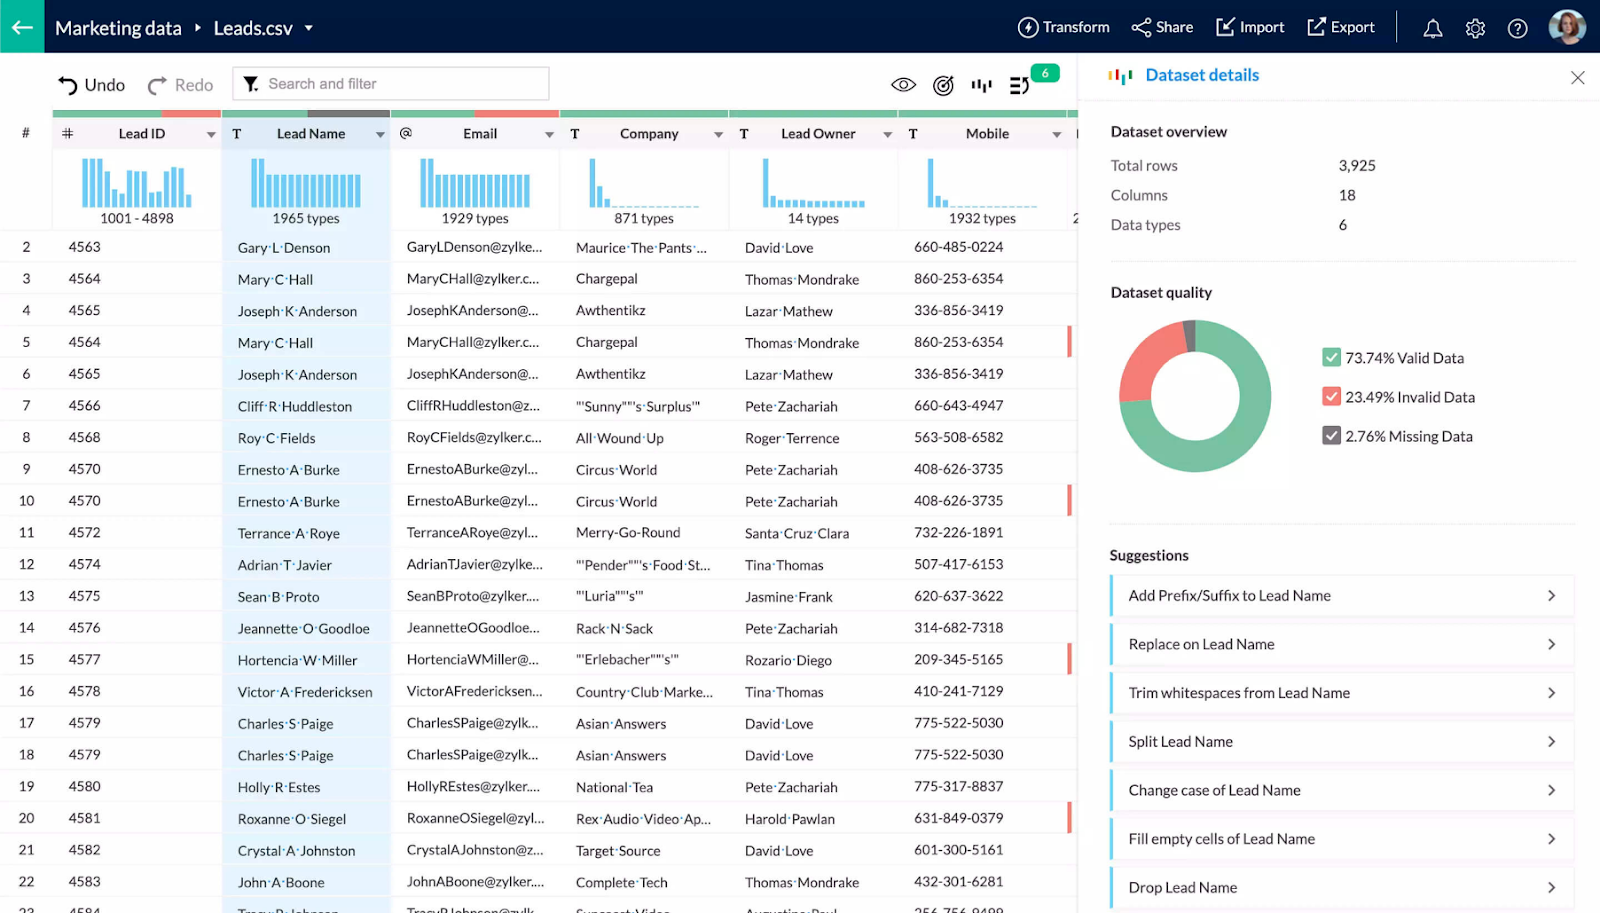
- Ensure data quality: Before implementing any ad-hoc analysis tool, verify the quality and accuracy of your data. Clean and well-organized data are critical for reliable insights.
- Integrate with existing systems: Choose an ad-hoc analysis tool that integrates seamlessly with your existing databases and business intelligence systems to streamline data analysis processes.
- Prioritize scalability: Opt for tools that can grow with your business, accommodating increases in data volume and complexity without significant performance issues.
- Leverage automation where possible: Utilize the automation features of your ad-hoc analysis software to streamline repetitive tasks, such as data collection and transformation, saving time and reducing errors.
- Encourage cross-functional use: Promote the adoption of ad-hoc analysis tools across different departments to foster a holistic approach to data-driven decision-making, enriching insights with diverse perspectives.
- Optimize for performance: Regularly assess and optimize the performance of your ad-hoc analysis software, particularly in terms of speed and responsiveness, to support efficient data processing and analysis.
Using Improvado To Respond To Ad-Hoc Requests
Responding effectively to ad-hoc requests hinges on the strength of an organization's data infrastructure. Improvado, with its robust ETL (Extract, Transform, Load) capabilities, serves as a solid data foundation for ad-hoc reporting.
The platform automates the data aggregation process from multiple sources, ensuring data is not only accessible but also primed for analysis.
Improvado's transformation capabilities allow users to standardize and harmonize disparate data metrics, mitigating the risk of analysis based on inconsistent data. The platform offers pre-built recipes to properly blend data for any particular marketing use case. For a more hands-on data transformation, Improvado provides a self-served data transformation engine.
Furthermore, Improvado offers extensive integration options, connecting with a wide array of marketing platforms, databases, and visualization tools. This interoperability ensures that data flows seamlessly across systems, enabling analysts to generate comprehensive ad-hoc reports.
Alternatively, you can rely on Improvado AI Agent to handle any ad-hoc requests. The AI layer is built on top of the marketing data infrastructure. The agent has a chat interface and supports natural language querying, which significantly simplifies and speeds up the ad-hoc analytics.
Schedule a demo to learn more about Improvado and have all that it takes when a new ad-hoc query arises.


