A marketing campaign is a coordinated series of strategic actions designed to achieve a specific business goal across multiple channels over a defined period. The strongest campaigns in 2026 combine AI-powered personalization, cross-channel governance, and relentless measurement, treating data as the decision engine rather than a reporting afterthought.

Marketers today face mounting pressure to prove ROI while navigating fragmented attribution, privacy-first tracking, and AI-driven search behavior. 33% of marketers say measuring marketing ROI is their top challenge, even as budgets tighten and leadership demands faster results. The playbook that worked in 2020, broad awareness plays, vanity metrics, and siloed channel optimization, no longer survives scrutiny.

This guide walks through the proven 2026 framework for creating and running marketing campaigns that deliver measurable business outcomes. You'll learn how to set goals that account for multi-touch attribution, build campaigns for AI search discoverability, govern execution in real time, and optimize with leading indicators instead of lagging reports. Every section includes decision frameworks, benchmark data, and failure-mode diagnostics that reflect how campaigns actually perform under pressure.

How This Guide Was Built

The frameworks in this article are built from:

Aggregated campaign data from 500+ Improvado customers spanning B2B SaaS, e-commerce, and enterprise marketing organizations

2026 industry research from HubSpot State of Marketing, BCG measurement surveys, and DMEXCO AI marketing reports

Practitioner post-mortems analyzing what causes campaigns to fail in the first 72 hours vs. what drives sustained performance

Real attribution models showing how budget, channel mix, and governance affect downstream revenue metrics

Improvado is our platform, and it is scored on the same criteria as every tool referenced here. We built our campaign governance and analytics capabilities by solving these problems for our own customers, teams running $500K-$50M annual ad spend who need continuous validation, not monthly reports.

Campaign Success Prerequisites: The 2026 Diagnostic

Before launching any campaign, validate these five prerequisites. Each one maps to a common failure mode that surfaces within 72 hours of launch and derails performance before you can course-correct.

PrerequisiteValidation TestFailure Mode if Skipped
Attribution tracking operationalUTM parameters validated in 3+ channels; tracking fires correctly in analytics and CRM40%+ unattributed revenue; budget decisions made blind; 3-week delay to fix tracking post-launch
Budget pacing model builtDaily/weekly spend targets set; alerts configured for >20% varianceBudget exhausted in first 10 days or underspend limits reach; no mid-flight correction possible
Leading indicators definedEach goal has a leading metric trackable within 48 hours (engagement rate, form starts, click depth)Optimize only on lagging metrics (conversions, revenue); miss early signals that creative or audience is broken
Kill criteria documentedSpecific thresholds written: "If CPL > 3× target after 20% budget burn, kill and pivot"Sunk-cost fallacy: keep pouring budget into failing campaigns because no pre-defined exit criteria
Cross-channel naming standard enforcedCampaign names, UTM parameters, and ad group labels follow single taxonomy across all platformsData splits across multiple rows in reports; manual reconciliation required; governance automation impossible

These aren't nice-to-haves. In BCG's 2024 measurement survey, nearly 1 in 3 measurement leaders cited cross-channel attribution failure as their biggest challenge, and attribution breaks happen at launch, not during optimization. If you can't attribute spend to outcomes in real time, you're flying blind until the post-campaign report, and by then the budget is spent.

Step 1: Set Goals with Leading Indicators, Not Just Outcomes

Campaign goals must be specific, measurable, and time-bound, but the SMART framework alone fails for campaigns because it focuses on lagging indicators (revenue, conversions) that take weeks to materialize. By the time you know a SMART goal is off track, you've burned 40-60% of the budget.

Why SMART Goals Fail for Campaigns

SMART (Specific, Measurable, Achievable, Relevant, Time-bound) is a goal-setting framework, not a measurement framework. Three problems emerge when applied to campaigns:

Attribution windows hide failure. A campaign generating leads today may not show conversion impact for 30-90 days in B2B. SMART says "increase MQLs by 20% in 90 days", but you won't know if you're on track until day 60, when it's too late to pivot creative or audience.

Multi-touch complexity. SMART goals assume single-channel causality. In reality, a conversion attributed to "email" likely involved 6 prior touchpoints (social ad → blog post → webinar → nurture sequence). SMART goals don't capture the multi-touch journey, so you optimize the wrong lever.

Lagging indicators only. Revenue, SQL count, and customer acquisition are lagging metrics, they confirm what already happened. Campaigns need leading indicators (engagement rate, time on page, form abandonment rate) that predict outcomes while you still have budget to adjust.

SMART + Leading Indicators Framework

Pair every campaign goal with a leading metric you can track within 48-72 hours. This creates an early-warning system.

Campaign Goal (Lagging)Leading Indicator (48-72hr)Decision Threshold
Generate 500 MQLs in 90 daysLanding page conversion rate ≥12%; form start rate ≥25%If conversion rate <8% after first 500 visitors, test new headline/offer
Achieve $200K pipeline from LinkedIn adsCTR ≥0.8%; post-click engagement time ≥90 secIf CTR <0.5% after first $2K spend, refresh creative
Increase demo requests by 30%Demo page scroll depth ≥75%; video watch time ≥60%If scroll depth <50%, redesign page hierarchy
Drive $50K revenue from email campaignOpen rate ≥22%; click-to-open rate ≥15%If CTOR <10% in first two sends, rewrite subject line and preview text

The right side of this table is what most teams skip, and it's where campaigns fail. Without leading indicators, you wait until the end of the campaign to realize the audience was wrong, the message didn't resonate, or the landing page was broken.

KPI Selection Flowchart

Choose the wrong KPIs and you'll optimize for metrics that don't drive business outcomes. Use this decision tree to select 3-5 KPIs that match your business stage, sales cycle, and resources.

START: What is your primary campaign objective?

→ Brand Awareness
   ├─ Track: Impressions, Reach, Frequency, Share of Voice
   ├─ Leading: CTR (early resonance signal), Engagement Rate
   └─ Do NOT track: Direct conversions, ROAS (wrong stage)

→ Lead Generation
   ├─ Sales cycle <30 days?
   │   ├─ YES → Track: CPL, Conversion Rate, MQL-to-SQL rate, Time-to-Convert
   │   └─ NO → Track: Engagement Score, Content Download Rate, Nurture Open Rate, Opportunity Creation Rate
   └─ Budget <$10K/month?
       ├─ YES → Focus on Conversion Rate and CPL (volume constraints limit cohort analysis)
       └─ NO → Add Lead Quality Score, LTV:CAC by source

→ Revenue / Sales
   ├─ Track: Marketing-Sourced Revenue, ROAS, CAC, Pipeline Value, Close Rate
   ├─ Attribution model: Multi-touch (first-touch and last-touch both mislead)
   └─ If CAC > LTV → KILL campaign or pivot audience immediately

→ Customer Retention / Upsell
   ├─ Track: Repeat Purchase Rate, Expansion Revenue, Churn Rate, NPS change
   └─ Leading: Email engagement by cohort, Feature adoption rate

Most campaigns fail because teams track the wrong metrics for their stage. A brand awareness campaign judged on direct conversions will look like a failure, even if it's building the top-of-funnel awareness that drives conversions 90 days later. Conversely, a demand-gen campaign judged on reach wastes budget on visibility that never converts.

Campaign Performance Benchmarks by Industry and Channel

Realistic benchmarks prevent panic when early results come in and prevent complacency when results look good. These ranges come from aggregated Improvado customer data across 500+ campaigns in 2024-2026.

Industry × ChannelCTRConversion RateCPLNotes
B2B SaaS - LinkedIn Ads0.6-1.2%2-5%$40-$80Higher CPL for enterprise (>$100); mid-market $45-$65
B2B SaaS - Google Search Ads3-6%5-12%$35-$70High-intent keywords; branded search converts 15-25%
E-commerce - Meta Ads1.5-3%1.5-4%$8-$25Cold traffic; retargeting converts 8-15%
E-commerce - Google Shopping0.8-1.5%2-6%$12-$35Product-feed quality heavily affects CTR
B2B Services - Email (cold)18-25% OR2-5% CTOR$15-$40OR = open rate; CTOR = click-to-open rate
B2B Services - Email (warm)28-40% OR8-15% CTOR$8-$20Existing customers or engaged prospects

These benchmarks are guidelines, not targets. A campaign hitting the low end of the range isn't necessarily failing, context matters (audience maturity, offer type, creative quality). But if your LinkedIn B2B campaign is running 0.2% CTR and $150 CPL after $5K spend, something is fundamentally broken: wrong audience, weak offer, or poor creative.

Centralized Campaign Performance, No More Platform-Hopping
Improvado connects 1,000+ data sources into a single view so you can track budget pacing, attribution, and performance across every channel in real time. Monitor campaigns with plain-English questions using Improvado's AI Agent, and get alerts when spend, CPL, or conversion rates drift off target, before the weekly report.

Step 2: Build Buyer Personas That Predict Behavior, Not Demographics

Buyer personas in 2026 must go beyond demographic snapshots. The strongest personas are built from behavioral segmentation, what prospects do, not just who they are, and validated through real customer data, not assumptions.

A buyer persona is a research-based profile of your ideal customer that guides all campaign decisions: messaging, channel selection, content formats, and offer design. Weak personas lead to campaigns that speak to everyone and resonate with no one.

Persona Validation Framework

Most personas are built from stakeholder opinions and generic market research. Validate yours with three concrete tests:

TestMethodPass Criteria
1. Customer Interview AlignmentInterview 5 recent customers matching the persona; ask about pain points, research process, decision criteria≥4 of 5 customers describe problems and buying journey consistent with persona assumptions
2. Revenue Cohort AnalysisAnalyze top 20% revenue customers: do they match persona demographics and behavior patterns?≥70% of high-value customers fit the persona profile; if not, persona is targeting wrong segment
3. Holdout Segment TestRun a small campaign ($2K-5K) targeting ONLY the persona; compare conversion rate and CAC to blended campaignsPersona-targeted campaign converts ≥1.5× better than broad targeting; otherwise persona doesn't meaningfully segment

If your persona fails any of these tests, it's descriptive fiction, not a decision tool. Rebuild it using actual customer data, not market research averages.

Behavioral Segmentation for Campaigns (2026 Framework)

Demographic personas ("Marketing Manager, 35-45, $70K salary") are table stakes. Behavioral segmentation predicts who will convert and when.

The strongest 2026 campaigns segment by:

Lifecycle stage signals: Engagement score, content consumption depth, product usage patterns (for existing customers), and buying-intent keywords in search behavior.

Churn risk and propensity models: Use predictive analytics to score leads and customers on likelihood to convert, expand, or churn. Campaigns targeting high-propensity segments see 2-3× better ROI than broad plays.

Multi-touch journey mapping: Identify the most common path to conversion (e.g., organic search → blog → webinar → demo request) and build campaigns that accelerate each stage rather than forcing cold traffic directly to conversion.

For example, a B2B SaaS company might segment not by job title but by behavior:

Segment A: Visited pricing page 3+ times, downloaded ROI calculator, opened last 4 emails → high intent, route to sales immediately

Segment B: Read 2 blog posts, attended webinar, no pricing page visit → mid-funnel, nurture with case studies and comparison content

Segment C: Single blog visit from organic search, no return → cold, retarget with awareness content (video, thought leadership)

Behavioral segmentation turns generic "nurture campaigns" into precision plays. You send case studies to people researching solutions, not to people who just discovered the problem exists.

Chacka Marketing · Digital Media Agency
"Improvado's reporting tool integrates all our marketing data so we easily track users across their digital journey."
, Marc Cherniglio, Chacka Marketing
90%
reduction in manual reporting time
Hours → minutes
for daily data checks

Step 3: Competitive Intelligence That Reveals Positioning Gaps

Competitor research in 2026 is less about copying tactics and more about finding gaps, messages they aren't telling, audiences they're ignoring, and failure modes they haven't solved. The goal is to position your campaign where competitors have left room.

Competitive Campaign Teardown Template

Analyze 3-5 direct competitors using this 12-point audit. Tools like Semrush, Ahrefs, Meta Ad Library, and LinkedIn Campaign Manager can surface most of this data.

Audit DimensionWhat to Look ForPositioning Opportunity
1. Messaging hooksFirst 10 words of ads, email subject lines, landing page headlinesIf all competitors lead with feature claims, lead with outcome; if all say "easy," lead with "fast" or "accurate"
2. Offer structureFree trial, demo, discount, gated content, what's the CTA?If competitors require demo for pricing, offer transparent pricing; if all offer trials, offer ROI calculator instead
3. Creative formatsStatic image, video, carousel, UGC, testimonialIf competitors use stock photos, use customer video; if all use founder-led video, use customer success stories
4. Channel mixWhich platforms they're active on and approximate spend distributionIf competitors over-index on LinkedIn, test Google Search; if all ignore Reddit or Quora, explore niche communities
5. Frequency and flightHow often do ads refresh? Are campaigns always-on or seasonal?If competitors run always-on, test high-intensity short bursts; if all are seasonal, own the off-season
6. Audience targeting (visible)Job titles, industries, company sizes mentioned in ads or landing pagesIf all target "VP Marketing," target the director or analyst who does the research; if all target enterprise, own mid-market
7. Social proof typeLogos, testimonials, case studies, awards, user countsIf competitors show logo walls, show specific ROI case studies; if all cite user counts, cite retention or NPS
8. Content depthBlog post length, video length, whitepaper page countIf competitors write 500-word fluff, write 2,500-word depth; if all write long, create 90-second video summaries
9. Objection handlingDo they address "why not [competitor]?" or "why now?" objections?If no one addresses objections directly, create comparison content and "why not [status quo]" messaging
10. Page speed & UXLanding page load time, mobile usability, form lengthIf competitors have slow pages or long forms, win on speed and simplicity
11. Retargeting presenceVisit competitor site; see if/how they retarget you over next 7 daysIf competitors don't retarget, you win on frequency; if they retarget with same ad, personalize by funnel stage
12. AI search presenceQuery key buying questions in ChatGPT, Perplexity, Gemini, are competitors surfaced?If competitors aren't appearing in AI answers, optimize content for conversational queries and E-E-A-T signals

This audit reveals where competitors are creating commoditized noise (everyone says the same thing) versus where they're ignoring opportunities. Your campaign should own the ignored spaces.

Campaign Differentiation Matrix

After auditing competitors, map your strengths against their approaches to find a defensible position.

Your StrengthCompetitor GapPositioning Play
Faster implementation (1 week vs 3 months)Competitors emphasize features, not speed-to-value"Live in 7 days" messaging; case study showing week-one ROI
Transparent pricing published on siteAll competitors require demo for pricing"No demo required" campaign; pricing calculator on landing page
Vertical specialization (e.g., only healthcare)Competitors are horizontal, lack industry-specific proof"Built for [industry]" messaging; case studies from 10+ industry customers
Best-in-class support (24/7, <2hr response)Competitors outsource support, slow response times"Support SLA guarantee" offer; customer testimonials about support quality

The goal is not to be better at everything, it's to be meaningfully different on dimensions your audience cares about. If speed matters more than features for your buyer, own speed. If trust matters more than price, own transparency and proof.

Step 4: Budget with Hidden Costs and Governance Built In

Marketing budgets in 2026 must account for the full cost of execution, not just media spend, and include real-time governance to prevent runaway spend or underspend that limits reach.

Budget Allocation Method Comparison

Three common budgeting methods exist. Each has a best-fit scenario. Choose the wrong one and you either overspend without results or underspend and miss targets.

MethodBest Use CaseData RequirementsFlexibilityRisk Level
Percentage of RevenueStable, mature businesses with predictable growth; maintaining market shareHistorical revenue trendsLow (fixed % means budget scales with revenue, not opportunity)Low (conservative)
Goal-Oriented (Zero-Based)Growth-stage companies, new product launches, aggressive expansion goalsCAC, LTV, conversion rates, channel costsHigh (budget adjusts to hit goals, can scale quickly)Medium (requires accurate cost assumptions)
Competitor-BasedHighly competitive markets where share-of-voice drives share-of-marketCompetitor spend estimates (often unreliable)Medium (reactive to competitor moves)High (assumes competitor strategy is correct)

Worked example: A B2B SaaS company with $2M ARR wants to generate 500 MQLs in Q1.

Percentage of revenue method: Allocate 10% of revenue = $200K annually = $50K for Q1 campaign. Simple but doesn't tie to the 500 MQL goal, could overspend or underspend.

Goal-oriented method: Work backward from goal. 500 MQLs × $80 CPL (from benchmark) = $40K media spend. Add 30% for creative, landing pages, tools = $52K total. This ties spend directly to outcome.

Competitor-based method: Competitor A spends ~$60K/quarter on LinkedIn (estimated from ad frequency and reach). Match or exceed = $60K-$75K. Risk: you don't know if their spend is efficient or if their goals match yours.

For most campaigns, goal-oriented budgeting is the best fit, it forces you to model the economics and validate assumptions before spending.

True Campaign Cost Calculator

Media spend is only 60-75% of total campaign cost. Budget for the full stack or you'll blow past the allocation.

Cost CategoryTypical % of TotalWhat It Includes
Media spend (ads, sponsorships)60-70%Paid social, search, display, influencer fees, event sponsorships
Creative production10-15%Video production, graphic design, copywriting, photography
Tools and software5-8%Marketing automation, analytics, attribution, A/B testing platforms
Agency or freelance fees8-12%Campaign management, strategy consulting, execution support
Internal time cost5-10%Marketing team hours, cross-functional coordination (sales, product, legal)
Contingency buffer10-15%Unplanned creative refreshes, platform changes, emergency pivots

Fully-loaded CPL/CAC formula:

True CAC = (Media Spend + Creative + Tools + Fees + Internal Time) ÷ New Customers Acquired

Most teams calculate CAC using only media spend, which understates true cost by 30-40%. If your "media-only CAC" is $50 but your fully-loaded CAC is $72, and your LTV is $80, you're barely profitable, not the home run the media-only number suggested.

Budget Pacing and Governance

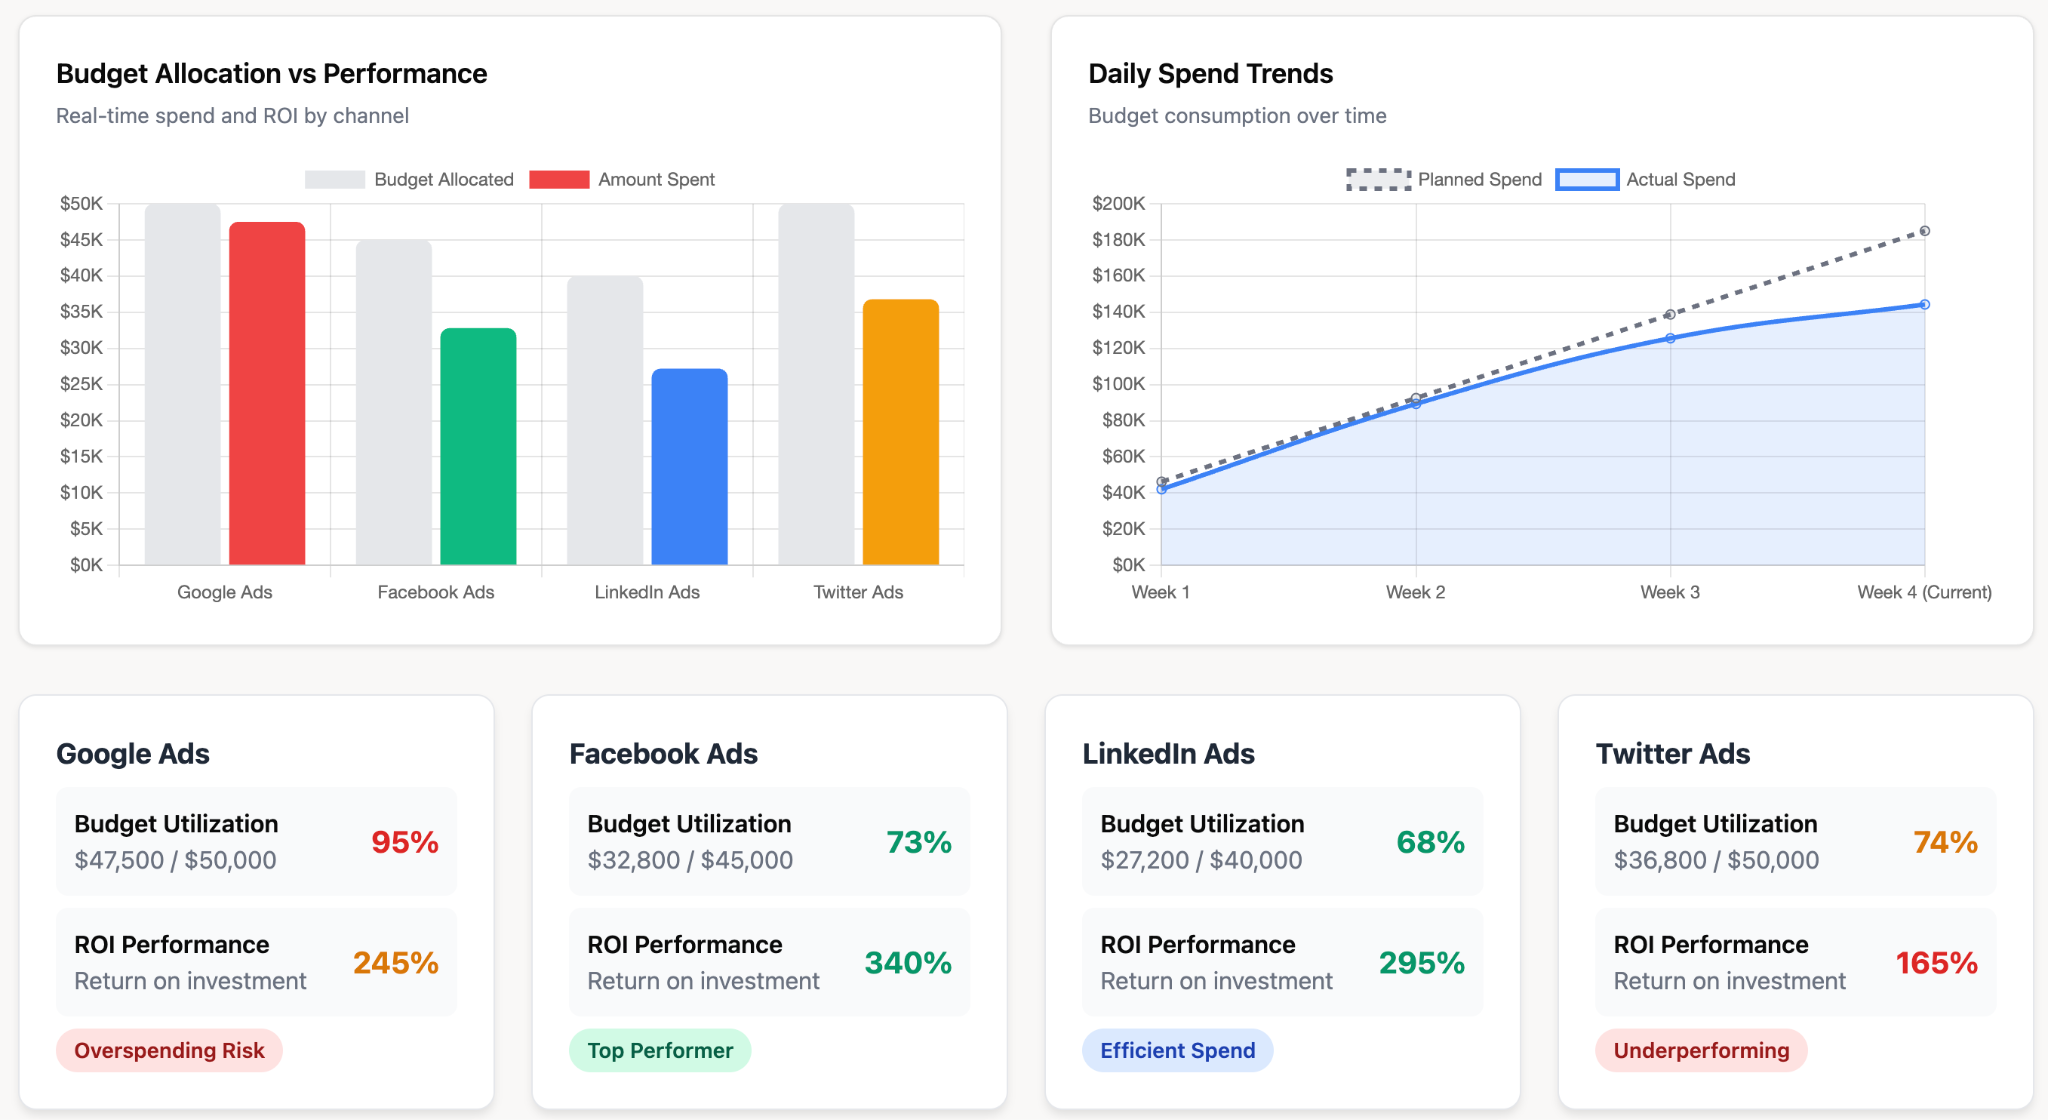
Campaigns fail when budget burns too fast (exhaust spend in 10 days, miss reach targets) or too slow (underspend limits volume, waste potential). Real-time governance prevents both.

Automated alert triggers to set up before launch:

Budget burn rate >20% ahead of plan: Trigger review if you've spent 30% of budget in first 10% of campaign duration. Indicates overspend or targeting too broad.

CPL >3× target benchmark: If cost per lead exceeds 3× your goal or industry benchmark after first $2K-$5K spend, pause and diagnose (wrong audience, weak offer, broken landing page).

Conversion rate <50% of target: If landing page converts at <6% when your goal is 12%, don't keep spending, fix the page first.

Daily spend variance >30%: Spend should be relatively stable day-to-day. Wild swings indicate bidding issues or campaign setup errors.

Tools like Improvado, Supermetrics, and native platform rules engines can automate these alerts. The key is acting on them within 24-48 hours, not waiting for the weekly report.

80%faster reporting (hours → minutes)
Yodel Mobile reports 80% faster reporting (hours → minutes) after adopting Improvado.
Book a demo →

Step 5: Message and Offer That Flip Objections

Your core message must do more than describe what you do, it must answer the prospect's unstated objections and make inaction riskier than action. The offer is the forcing function that converts interest into commitment.

USP Validation Test

Your Unique Selling Proposition (USP) should pass three tests. If it fails any of them, it's not a USP, it's a tagline.

TestPass CriteriaFailure Example
1. Repetition testCustomer can repeat it after one exposure"We provide innovative, scalable, enterprise-grade solutions" ← no one remembers this
2. Competitive displacement testIt answers "why not competitor X?" without mentioning them"Best-in-class analytics platform" ← every competitor claims this
3. Win/loss quote testIt appears verbatim or paraphrased in win interview transcripts"Empowering businesses to succeed" ← no buyer ever says this

Example of a strong USP that passes all three tests: "Marketing data connected and validated in days, not months, no engineering required."

• Repetition test: ✓ (simple, concrete, memorable)

• Competitive displacement: ✓ (implies competitors take months and require engineering)

• Win/loss quote test: ✓ (customers explicitly cite speed and no-code as reasons they chose the platform)

Offer Architecture by Funnel Stage

The right offer depends on where the prospect is in their journey. Top-of-funnel prospects need low-commitment engagement; bottom-funnel prospects need friction reduction.

Funnel StageProspect MindsetOffer TypeExamples
Awareness"I have a problem, researching solutions"Engagement offers (interactive, educational)Quiz, assessment tool, benchmark report, ROI calculator
Consideration"I'm comparing options"Value-exchange offers (tactical content)Buying guide, comparison matrix, case study, webinar
Decision"I'm ready to evaluate/buy"Friction-reduction offers (try before commit)Free trial, live demo, pilot program, money-back guarantee

A common mistake: offering a free trial (decision-stage offer) to awareness-stage traffic. The prospect isn't ready to try the product, they're still learning what the product category does. Start with an engagement offer (quiz, calculator) that educates and qualifies them before pushing for commitment.

Video-First Messaging Framework

Video is the highest-impact format in 2026 for driving behavior, 91% of marketers say video has increased traffic, and short-form video (under 60 seconds) sees 2-3× higher engagement than static creative on most platforms.

The strongest video messaging follows a three-part structure:

Hook (0-3 seconds): Start with the problem or outcome, not the product. "Spending 10 hours a week pulling reports?" beats "Introducing our new analytics platform."

Proof (3-30 seconds): Show the solution working. Screencast, customer testimonial, before/after comparison. Proof builds belief.

Offer (30-60 seconds): State the specific action and create urgency. "Try it free for 14 days, no credit card required" or "Download the guide, only available this week."

This hook-proof-offer structure applies to TikTok, Instagram Reels, LinkedIn video ads, and YouTube shorts. It's optimized for the first 3-second retention gate (if they don't watch past 3 seconds, the message fails) and the 30-second completion goal (platforms reward watch-through with more distribution).

Objection-Flipping Content

Most campaigns ignore objections. The best campaigns address them head-on, flipping "why not" into "why now."

Example objections and flips:

Objection: "Too expensive compared to competitors." Flip: "Our customers find that cheaper tools cost 2-3× more in hidden setup time and ongoing manual work. Here's the total cost comparison [link to TCO calculator]."

Objection: "We're too small for this." Flip: "60% of our customers started with <10 people. Here's what [customer name] achieved in their first 90 days as a 5-person team [link to case study]."

Objection: "We already have a solution." Flip: "Most teams keep their current tool for [use case A] and add us for [use case B], no rip-and-replace required. See the integration [link to demo]."

Create dedicated content pieces (video, blog post, comparison page) for each top-3 objection. Run them as retargeting ads to people who visited your site but didn't convert. Objection content closes the gap between interest and commitment.

"Transitioned from labor-intensive manual processes to streamlined, automated reporting, saving time and increasing accuracy."
, Pablo Perez, Performance Marketing Agency, Admiral Media
35-40 hrs/wk
saved via reporting automation
Real-time
reporting cycles (was weekly)
Book a demo

Step 6: Channel Selection Based on Constraints, Not Best Practices

The "best" marketing channel doesn't exist. The right channel depends on your audience, budget, timeline, and measurement capability. Choose based on your constraints, not generic advice.

Channel Selection Matrix

Map your situation against these four dimensions to identify 2-3 channels that fit.

ChannelBuying Stage FitMin. Viable BudgetTime to First ConversionMeasurement Complexity
Google Search AdsDecision (high-intent keywords)$3K-5K/monthDaysLow (direct attribution)
LinkedIn AdsAwareness to Consideration (B2B)$5K-8K/monthWeeksMedium (multi-touch common)
Meta Ads (Facebook/Instagram)Awareness to Decision (B2C, e-commerce)$2K-4K/monthDays to WeeksHigh (iOS 14.5+ tracking limits)
SEO / Content MarketingAwareness to Consideration$2K-5K/month (ongoing)Months (3-9)Medium (attribution via GA4, search console)
Email MarketingConsideration to Decision (warm list)$500-2K/month (tools + creative)Hours to DaysLow (direct tracking in ESP)
YouTube AdsAwareness (video storytelling)$3K-6K/monthWeeksMedium (view-through attribution)
Reddit / QuoraAwareness to Consideration (niche communities)$1K-3K/monthWeeksMedium (platform tracking basic)
Influencer / Creator PartnershipsAwareness to Consideration$2K-10K per creatorWeeksHigh (affiliate links, promo codes only)

Decision scenarios:

Scenario 1: B2B SaaS, $10K budget, need leads in 30 days → Google Search Ads + LinkedIn retargeting. Search captures high-intent; LinkedIn retargets site visitors with case studies.

Scenario 2: E-commerce brand, $50K budget, building awareness for new product → Meta Ads (cold traffic) + YouTube (storytelling) + email (warm list). Meta and YouTube build reach; email converts warm audience.

Scenario 3: Services business, $5K budget, long sales cycle (6 months) → SEO + email nurture. Paid channels burn budget before conversions happen; SEO builds pipeline, email nurtures over time.

Scenario 4: Enterprise SaaS, $100K budget, targeting 50 named accounts → LinkedIn ABM + direct mail + retargeting. Hyper-targeted plays for small, high-value audience.

The matrix prevents the mistake of choosing channels because "everyone uses them" rather than because they fit your constraints.

Campaign Type Selection: When NOT to Use Each Type

Knowing when to avoid a campaign type is as important as knowing when to use it. These anti-patterns prevent wasted budget.

Campaign TypeDo NOT Use When...Why It Fails
Brand AwarenessCAC is already above LTV; cash runway <6 monthsAwareness campaigns don't generate immediate revenue; you'll burn cash without near-term payback
Lead Generation (Cold Traffic)Ad spend budget <$5K/month; no lead nurture system in placeVolume too low to optimize; leads go cold without nurture, wasting acquisition cost
Product LaunchProduct isn't ready for scale; core features unstable or incompleteYou'll drive traffic to a broken experience, damaging brand and wasting budget
RetargetingWebsite traffic <1,000 visitors/monthAudience too small to build effective retargeting segments; frequency gets too high, causing ad fatigue
Influencer CampaignNo way to track promo codes or affiliate links; brand messaging not clearly definedCan't measure ROI; influencer creates off-brand content that confuses audience
Email NurtureList <500 contacts; no segmentation capabilityVolume too low for meaningful results; batch-and-blast to small list damages deliverability and engagement

These constraints are hard-learned. Teams waste tens of thousands running awareness plays when they need revenue now, or retargeting campaigns to audiences too small to matter.

Step 7: Creative and Content That Passes the 5-Second Test

Campaign creative in 2026 must pass the 5-second test: in the first 5 seconds, the viewer should understand the problem you solve, the outcome you deliver, and what to do next. Fail this test and the rest of the creative doesn't matter, they've already scrolled.

Creative Asset Requirements by Channel

Each channel has format and technical requirements. Missing them tanks performance before creative quality even matters.

Asset TypeSpecsCreative Best Practices (2026)
LinkedIn Ad Creative1200×627px image; 1:1 or 4:5 video; headline ≤70 charsUse human faces (not stock); lead with outcome in headline; include social proof (logo, stat) in image
Meta Feed Ad1080×1080px (1:1) or 1080×1350px (4:5); video ≤15 sec idealHook in first 1-2 seconds; text overlay (assumes sound-off); bright, high-contrast visuals
Google Search Ad3 headlines (30 chars each); 2 descriptions (90 chars each); sitelinksInclude keyword in headline 1; lead with benefit, not feature; use all ad extensions (callouts, structured snippets)
Landing PageMobile-first; load <2 seconds; single CTA above foldHeadline mirrors ad copy; hero section answers "what + for whom + outcome"; remove navigation (reduce exits)
Email (cold)Subject line ≤50 chars; preview text ≤90 chars; single-column mobile layoutSubject + preview text must work together (don't repeat); lead with problem, not pitch; one CTA, repeated 2× in body
TikTok / Reels9:16 vertical video; 15-60 seconds; native, not polishedHook in first 1 second (visual + text); use trending sounds; end with clear CTA ("link in bio," "comment X")

A/B Testing That Actually Moves Metrics

Most A/B tests are too small to matter. Test elements that can drive 20%+ lift, not 2% tweaks.

High-impact test priorities (test these first):

Offer: Free trial vs. live demo vs. ROI calculator. Offer changes can drive 30-50% conversion lift.

Headline/hook: Problem-focused ("Spending 10 hrs/week on reports?") vs. outcome-focused ("Get reports in 10 minutes"). 15-30% CTR lift possible.

Social proof type: Customer logos vs. testimonial quote vs. specific stat ("Reduced CAC 40%"). 10-25% conversion lift.

CTA copy: "Get a demo" vs. "See how it works" vs. "Talk to our team." 10-20% click lift.

Creative format: Static image vs. short video vs. carousel. Video often drives 20-40% higher engagement on social platforms.

Low-impact tests (skip these until you've exhausted high-impact tests):

• Button color, font changes, minor layout tweaks, usually <5% lift, requires huge sample size to detect

• Wordsmithing that doesn't change meaning ("Try for free" vs. "Try it free"), negligible impact

• Image background changes that don't affect subject, 2-3% lift at best

Run tests to 95% statistical significance before calling a winner. Most teams call tests too early, optimizing for noise instead of signal.

Step 8: Pre-Launch Diagnostic (Not a Checklist)

Pre-launch checklists are binary (✓ or ✗) and miss the degree of risk. Use a scored diagnostic instead: weight each item by impact, identify failure modes, and calculate a launch-readiness score.

Campaign Pre-Flight Diagnostic Scorecard

Score each dimension 0-10. Multiply by weight. A score below 70/100 means significant launch risk, delay and fix the gaps.

DimensionWeightScoring Criteria (0-10)Failure Mode if Scored Low
Goal Clarity15%10 = SMART goal + leading indicators defined; 5 = vague goal ("increase awareness"); 0 = no goalCan't optimize mid-flight; stakeholders argue about success
Tracking Setup20%10 = UTM parameters validated across all channels, tracking fires correctly in GA4/CRM; 5 = UTMs exist but not tested; 0 = no tracking40%+ unattributed revenue; 3-week delay to fix post-launch
Audience Match15%10 = persona validated with customer interviews + revenue data; 5 = persona exists but not validated; 0 = no personaWrong audience = high CPL, low conversion, wasted spend
Budget Realism10%10 = budget modeled from benchmarks, includes contingency; 5 = rough estimate; 0 = no budget planRun out of budget early or underspend limits reach
Message Resonance10%10 = message tested with target audience, passes 5-second test; 5 = internal consensus only; 0 = no message testingLow CTR, high cost, message doesn't land
Landing Page Quality15%10 = loads <2 sec, mobile-optimized, single clear CTA, message matches ad; 5 = functional but slow or unclear; 0 = broken or genericHigh bounce rate, low conversion, paid traffic wasted
Creative Quality10%10 = meets platform specs, passes 5-second test, 3+ variants ready; 5 = meets specs but generic; 0 = wrong format or placeholderLow engagement, can't A/B test, creative fatigue fast
Kill Criteria Defined5%10 = specific thresholds documented (CPL, conversion rate, budget %); 5 = vague criteria; 0 = no criteriaSunk-cost fallacy: keep spending on failing campaign

Scoring example:

• Goal Clarity: 8/10 × 15% = 1.2

• Tracking Setup: 10/10 × 20% = 2.0

• Audience Match: 6/10 × 15% = 0.9

• Budget Realism: 9/10 × 10% = 0.9

• Message Resonance: 7/10 × 10% = 0.7

• Landing Page Quality: 9/10 × 15% = 1.35

• Creative Quality: 8/10 × 10% = 0.8

• Kill Criteria Defined: 10/10 × 5% = 0.5

Total: 8.35/10 = 83.5/100 → Launch-ready (≥70).

If the score is 60-69, you can launch but expect underperformance in the low-scoring areas. If <60, delay launch and fix the gaps, you'll waste budget.

Customer story
"We now trust the data. If anything is wrong, it's how someone on the team is viewing it, not the data itself."
Tyler Corcoran
Performance Marketing Agency, Booyah Advertising
Read the case study →

Step 9: Real-Time Monitoring with Leading Indicators

Post-launch, most teams wait a week for "enough data" before checking performance. By then, you've spent 15-25% of the budget. Monitor daily using leading indicators that predict outcomes before they happen.

First 72 Hours: Campaign Red Flags Checklist

These signals appear in the first 3 days. Each one predicts failure if not addressed immediately.

Red FlagThresholdDiagnostic QuestionCorrective Action
CTR too low<0.5% (cold traffic); <2% (search)Is the hook clear? Does the creative stand out? Is targeting too broad?Refresh headline/image; narrow audience; test new creative
Bounce rate >70%>70% within first 1,000 visitsDoes landing page match ad promise? Is page slow to load? Is CTA clear?Fix page speed; align headline with ad copy; simplify CTA
Form abandonment >80%>80% start form but don't submitIs form too long? Is ask too high? Are there technical errors?Reduce form fields (test 3 fields vs. 7); check for form bugs; clarify what happens next
CPL >3× benchmark>3× industry or historical CPLIs audience too narrow (limited reach)? Is offer weak? Is creative poor?Expand audience slightly; test stronger offer (trial vs. ebook); refresh creative
Frequency >5>5 impressions per userIs audience too small? Is creative stale? Is ad not converting?Expand audience; rotate creative; check if targeting is too niche
Time on page <30 sec<30 seconds averageIs content irrelevant to ad promise? Is page confusing? Is value unclear?Rewrite headline to match ad; add video or interactive element; clarify value prop above fold
Budget burn >30% aheadSpent 30% of budget in first 10% of flightIs bid too high? Is targeting too broad? Are budget caps missing?Lower bids; set daily spend caps; narrow targeting
Zero conversions after $2K spend$2K+ spent, zero goal completionsIs tracking broken? Is offer wrong? Is audience completely mismatched?Validate tracking fires; test offer with internal audience; revisit persona assumptions

If 2+ red flags appear in the first 72 hours, pause the campaign and diagnose before spending more. The failure mode is clear at this point, more spend won't fix it.

Weekly Performance Review Framework

After the first week, establish a weekly review cadence. Track these metrics and adjust based on thresholds.

MetricTarget RangeIf Below TargetIf Above Target
CTR0.8-1.5% (social); 3-6% (search)Test new creative; rewrite headline; narrow audienceScale budget; replicate winning creative
Conversion Rate2-5% (cold); 8-15% (warm)A/B test landing page; simplify form; strengthen offerIncrease budget; expand to similar audiences
CPLWithin 20% of benchmark or goalExpand audience (if too narrow); improve quality score; bid lowerBid more aggressively; broaden targeting; add premium placements
ROAS3:1 minimum (e-commerce); 5:1+ targetImprove conversion rate; upsell/cross-sell offers; retarget abandonsScale spend; expand to lookalike audiences
MQL → SQL Rate20-40% (B2B)Lead quality issue: tighten targeting; add qualification questions to formLead quality high: increase budget to drive more volume

Weekly reviews should result in action items, not just reports. If a metric is off target, decide in the meeting: kill, pivot, or double down.

"Senior management now has complete understanding of where marketing efforts lead."
, Illy senior marketing leader, CPG / Food & Beverage, Illycaffè (Illy)
80-100 hrs/wk
time saved on reporting
18%
cost saving
Book a demo

Step 10: Optimize, Scale, or Kill Based on Kill Criteria

The hardest decision in campaign management is knowing when to kill a campaign versus when to optimize it. Most teams optimize too long, burning budget on campaigns that will never hit targets.

When to Kill a Campaign

Use these decision criteria. If a campaign meets ANY of these thresholds, kill it or pivot immediately, don't keep optimizing.

Kill CriterionThresholdWhy Kill (Not Optimize)
CPL >3× target after 20% budget burn + 2 creative iterationsE.g., target $50 CPL → actual $150+; spent $10K of $50K budget; tested 2 new creativesFundamental mismatch (audience, offer, or channel). More optimization won't close a 3× gap.
Engagement rate <0.5% after first 1,000 impressions on proven audience<0.5% CTR or <1% video view rate on audience that previously convertedMessage/creative doesn't resonate. If warm audience ignores it, cold audience won't convert.
CAC > LTV after 30% budget burnE.g., LTV $200, CAC $250 after spending $15K of $50KEconomics don't work. Campaign loses money on every customer, can't scale profitably.
Zero conversions after $5K spend (B2B) or $2K spend (B2C)Sufficient sample size to see signal; zero goal completionsEither tracking is broken or offer/audience is completely wrong. Pause and diagnose.
Conversion rate improves <10% after 3 landing page testsBaseline 2% → tested 3 variants → still 2.1-2.2%Traffic quality is the issue, not the page. Fix targeting or offer, not more page tests.

Kill/Pivot/Double-Down Flowchart:

After 20% of budget is spent:

Q1: Is CPL within 2× of target?
  ├─ NO → KILL or PIVOT (audience/offer mismatch)
  └─ YES → Continue to Q2

Q2: Is conversion rate ≥50% of target?
  ├─ NO → PIVOT (test new landing page or offer)
  └─ YES → Continue to Q3

Q3: Is CAC < LTV?
  ├─ NO → KILL (economics don't work)
  └─ YES → Continue to Q4

Q4: Are leading indicators improving week-over-week?
  ├─ NO → OPTIMIZE (test creative, audience, messaging)
  └─ YES → DOUBLE DOWN (scale budget, expand to lookalikes)

This flowchart prevents the sunk-cost fallacy. Teams often say "we've already spent $20K, let's spend another $10K to see if it improves", but if the fundamentals are broken (wrong audience, offer doesn't resonate, economics upside-down), more spend just deepens the hole.

Campaign Scaling Playbook

Once a campaign is working (CPL on target, conversion rate healthy, CAC < LTV), scale systematically. Scaling too fast breaks what's working; scaling too slow leaves money on the table.

Spend ThresholdWhat to DoWhat to Avoid
$5K → $15K/monthIncrease budget 50%; add 1 new creative variant per week; expand to 1 lookalike audienceDon't change targeting radically; don't add new channels yet (validate one channel first)
$15K → $50K/monthAdd 1 complementary channel (e.g., LinkedIn → Google Search retargeting); refresh creative every 2 weeks; test 2-3 new audiencesDon't double budget overnight; don't abandon the winning audience to chase new ones
$50K → $150K/monthHire/contract specialist for creative production; build retargeting sequences; add account-based plays for high-value segments; invest in attribution modelingDon't neglect creative refresh (high spend = high frequency = fast fatigue); don't assume what worked at $50K works at $150K
custom pricing/monthBuild dedicated creative team; implement continuous testing program (always 3-5 active tests); add offline channels (events, direct mail for top accounts); centralized reporting with data governanceDon't lose sight of unit economics; don't let team silos break attribution; don't stop testing ("set it and forget it" kills performance)

Each scaling threshold requires new infrastructure. At $5K/month, you can manage campaigns manually. At $50K/month, you need automation and dedicated resources. At custom pricing/month, you need governance systems or data fragmentation will kill attribution and waste spend.

✦ Marketing Analytics Platform
From Campaign Chaos to Governed ExecutionPre-launch validation, real-time monitoring, and post-campaign data reconciliation, Improvado's governance framework ensures campaigns stay compliant, data stays trustworthy, and insights drive action. With 250+ pre-built rules and automated alerts, your team can focus on optimization instead of firefighting tracking issues.

Campaign Governance: The 2026 Requirement

Campaign governance in 2026 is no longer optional. With budgets under scrutiny and attribution increasingly complex, teams need automated systems that validate configurations before launch, monitor delivery in real time, and confirm data completeness after campaigns end.

The Three Phases of Campaign Governance

1. Pre-launch validation

Before a campaign goes live, governance systems check:

• UTM parameters follow naming conventions (no typos, no duplicate codes)

• Tracking pixels fire correctly on landing pages

• Budget caps are set and aligned with pacing model

• Audience targeting matches documented personas (no accidental "all users" selection)

• Creative meets platform specs (file size, dimensions, text limits)

Manual pre-launch checks catch 60-70% of errors. Automated governance systems catch 95%+.

2. In-flight monitoring

During the campaign, governance systems alert on:

• Budget pacing >20% ahead or behind plan

• CPL or CPA >3× target

• Tracking discrepancies (platform reports 500 conversions, CRM shows 300)

• Creative frequency >5 impressions per user (fatigue signal)

• Daily spend variance >30% (bidding or setup issue)

These alerts allow 24-48 hour correction windows instead of discovering problems in the weekly report.

3. Post-campaign data validation

After the campaign, governance systems confirm:

• All conversions are attributed (no "unattributed" bucket >10%)

• Data from all platforms is complete (no missing days, no partial loads)

• Multi-touch attribution model applied consistently

• Campaign taxonomy is consistent for reporting (no "spring-promo" vs "Spring_Promo" splits)

Without post-campaign validation, 30-40% of campaigns end with incomplete or inconsistent data, making true ROI analysis impossible.

How Improvado Enables Campaign Governance at Scale

Improvado provides continuous campaign governance across the entire lifecycle with automated validation and real-time monitoring.

Pre-launch: Improvado validates campaign setup across platforms, checking that UTM parameters, naming conventions, and tracking configurations are consistent before spend begins. Budget allocation is validated against planned targets to prevent overspend or underspend.

In-flight: Real-time monitoring tracks budget pacing, performance against KPI thresholds, and data consistency across platforms. Improvado's AI Agent allows marketers to query campaign performance in plain English ("Show me campaigns where CPL is >3× target this week") without waiting for reports or building dashboards.

Post-campaign: Improvado confirms data completeness, reconciles cross-platform discrepancies, and applies consistent attribution models so post-campaign analysis is accurate and trustworthy. The platform preserves 2 years of historical data even when connectors change schemas, preventing data loss that breaks trend analysis.

With 1,000+ data sources, 46,000+ metrics and dimensions, and 250+ pre-built governance rules, Improvado turns campaign governance from a manual audit process into an automated system that runs continuously.

ASUS · Technology / Consumer Electronics
"Improvado helped us gain full control over our marketing data globally. Today, we can build any report in minutes."
, Jeff Lee, ASUS
90 hrs/wk
saved by eliminating manual work
Minutes
to build any report (was days)

Marketing Campaign Examples: What Worked and Why

Real-world campaigns reveal patterns that frameworks miss. These seven campaigns, from viral brand plays to B2B growth engines, show what works when strategy, creative, and execution align.

1. Dollar Shave Club: Viral Video Launch (2012, Still Studied in 2026)

Goal: Launch a subscription razor brand and acquire customers at <$5 CAC.
Tactic: 90-second YouTube video (founder-led, humor, blunt copy: "Our blades are f***ing great").
Results: 12,000 orders in first 48 hours; 26M views; $1.50 CAC; company sold to Unilever for $1B four years later.

Why it worked: The video passed the 5-second test (hook: "Are you tired of overpaying for razors?"), used founder authenticity (not polished agency creative), and made the offer frictionless (sign up online, no retail middleman). The creative was so distinct it generated earned media, press coverage amplified reach without paid spend.

2. Dove Real Beauty Campaign (Long-Term Brand Repositioning)

Goal: Reposition Dove from commodity soap to a brand about authentic beauty and self-esteem.
Tactic: Multi-year campaign using real women (not models), "Real Beauty Sketches" video, social conversation (#RealBeauty), and cause marketing (self-esteem workshops).
Results: Dove sales increased from $2.5B to $4B over 10 years; brand became synonymous with body positivity.

Why it worked: Emotional resonance over product features. The campaign addressed a cultural objection (unrealistic beauty standards) and aligned the brand with a movement. It was sustained over years, not a one-off stunt. Lesson: brand campaigns require long-term commitment and cultural relevance, not just media spend.

3. Spotify Wrapped (Annual UGC Generator)

Goal: Drive user engagement and social sharing at year-end; reinforce Spotify as the music platform.
Tactic: Personalized year-in-review for every user (top songs, artists, genres), designed for social sharing with branded templates.
Results: 120M+ users engaged with Wrapped in 2023; billions of social impressions; #SpotifyWrapped trends globally every December.

Why it worked: Personalization at scale (every user gets unique content), social proof (seeing friends' Wrapped creates FOMO), and perfect timing (year-end reflection is culturally embedded). The campaign is user-generated content, Spotify provides the creative, users do the distribution.

4. ALS Ice Bucket Challenge (Social Virality for Cause Marketing)

Goal: Raise awareness and funds for ALS research.
Tactic: Challenge participants to dump ice water on themselves, post video, and nominate others; tie to donation.
Results: $115M raised in 8 weeks; 17M videos posted; global reach without paid media.

Why it worked: Low barrier to entry (anyone can participate), social proof (celebrities and friends doing it), and competitive/challenge mechanic (nomination creates social pressure). The format was inherently viral, each participant recruited 2-3 more. Lesson: campaigns that turn participants into distributors scale exponentially.

5. Always #LikeAGirl (Cultural Repositioning)

Goal: Reframe the phrase "like a girl" from insult to empowerment; connect Always brand to female empowerment.
Tactic: Video showing how "run like a girl" is perceived differently by adults (negative) vs. young girls (positive); launched during Super Bowl.
Results: 90M+ views; brand perception improved 50%+ among target demo; sales increased.

Why it worked: Addressed a cultural pain point (gender stereotypes) with emotional storytelling. Super Bowl timing gave mass reach, but the message was distinct enough to break through ad clutter. Lesson: campaigns that tackle cultural issues authentically (not performative) build long-term brand equity.

6. Airbnb #WeAccept (Purpose-Driven Response Campaign)

Goal: Position Airbnb as inclusive and purpose-driven in response to 2017 travel ban.
Tactic: Super Bowl ad featuring diverse faces and message: "We believe no matter who you are, where you're from, who you love, or who you worship, we all belong. The world is more beautiful the more you accept." Backed by commitment to provide housing for 100,000 refugees.
Results: 87M views; positive brand sentiment spike; reinforced brand values during politically charged moment.

Why it worked: Timely, took a clear stance (not neutral), and backed message with action (refugee housing commitment). Purpose-driven campaigns work when tied to company values and backed by real commitments, not just ad copy.

7. B2B Example: Gong's Revenue Intelligence Category Creation

Goal: Create and own the "revenue intelligence" category; drive inbound demand for Gong's platform.
Tactic: Thought leadership content (research reports, webinars, podcasts), "Gong Labs" data studies analyzing millions of sales calls, and consistent messaging around "revenue intelligence" as a new category.
Results: Gong became synonymous with revenue intelligence; $7.25B valuation by 2021; inbound pipeline dominates (not outbound-driven).

Why it worked: Category creation, not competition. Instead of positioning as "better than [competitor]," Gong defined a new problem (revenue teams lack intelligence) and positioned itself as the solution. Data-driven content (Gong Labs) built authority. Lesson: B2B campaigns that educate and define new categories can dominate inbound demand.

Conclusion: Campaigns Are Systems, Not Moments

The strongest marketing campaigns in 2026 aren't built on big ideas alone, they're built on systems that connect strategy, execution, measurement, and governance into a continuous feedback loop.

The framework in this guide, goal-setting with leading indicators, persona validation, competitive positioning, budget governance, message and offer design, channel selection, creative excellence, pre-launch diagnostics, real-time monitoring, and kill criteria, creates that system.

Most campaigns fail not because the idea was wrong, but because the system was incomplete. Tracking broke. Budget pacing wasn't monitored. Kill criteria were never defined. Creative wasn't refreshed. Data fragmentation prevented attribution. Each failure is fixable, but only if you build the system before you launch.

The campaigns that succeed in 2026 treat data as the decision engine, not a reporting afterthought. They validate assumptions before spending. They monitor leading indicators daily, not weekly. They kill fast when fundamentals are broken and scale aggressively when economics work.

If you're building campaigns at scale, managing $50K+/month across multiple channels, integrating CRM and ad platforms, and trying to prove ROI in a privacy-limited world, the governance and data infrastructure matters as much as the creative. That's where platforms like Improvado provide the connective tissue: continuous validation, real-time monitoring, unified attribution, and the ability to act on insights without waiting for the next report cycle.

Build the system. Run the campaign. Measure relentlessly. Iterate fast. That's how campaigns win in 2026.

20+
marketing reports (ROAS, CPA, custom)
"Harmonized marketing channels and normalized data, making insights immediately accessible." , Roman Vinogradov, Hyperconnect
82%
engineering time saved on integrations
"Improvado has been an incredible partner. We wouldn't have been able to bring our new attribution product to market without them." , Chelsea Dougherty, AdRoll
6 hrs/wk
saved on manual reporting
"Improvado transformed our approach to marketing analytics. Its automation and AI-driven insights let us focus on optimization and strategy." , Adam Orris, Function Growth