
Today, leaders judge marketing performance on efficiency, attribution rigor, and revenue contribution. They don't focus on channel-level lift or surface-level engagement metrics. As budgets tighten and cycles compress, leadership expects granular insight. Leaders want to know what drives qualified demand. They need to understand how spend translates into pipeline. They must identify where performance breaks down across the funnel. According to LeanMarketing, mapping KPIs to each funnel stage – awareness, consideration, decision – enables clearer performance attribution. Zendesk illustrates how tracking KPIs along the customer journey improves lead-to-customer conversion visibility.
Marketing KPIs tracking is a strategic operating system. Teams use it for planning, resourcing, and proving commercial impact. According to Ruler Analytics, despite their importance, only 23 percent of marketers are confident that they track the right KPIs
This guide breaks down how to architect KPI models that withstand boardroom scrutiny and operational reality. You’ll learn how to define revenue-aligned metrics, connect channel signals to business outcomes, enforce consistent measurement logic, and build an analytics foundation that supports real-time decision-making.
Key Takeaways:
- KPIs vs. Metrics: All KPIs are metrics, but not all metrics are KPIs. A KPI is a metric tied directly to a core business objective.
- Goal alignment is crucial: Select KPIs that directly reflect your marketing goals, such as increasing revenue, generating leads, or improving brand awareness.
- Focus on actionable data: Avoid vanity metrics like simple follower counts. Prioritize KPIs that drive strategic decision-making and optimize performance.
- Unified tracking is key: Data silos from different platforms lead to inaccurate insights. A unified analytics solution is essential for a true performance overview.
Free Download: Marketing KPI Tracking Guide
A practical guide to setting up and tracking the KPIs that actually move the needle — from awareness to revenue attribution.
Download the GuideWhat Are Marketing KPIs (Key Performance Indicators)?
Defining a KPI vs. a Metric
The terms metric and KPI are often used interchangeably. However, they have distinct meanings.
A metric is any quantifiable measurement. Your website might have thousands of metrics, like page views or button clicks.
A KPI, or Key Performance Indicator, is different. It is a specific metric you have chosen to measure progress toward a critical business objective. For example, website traffic is a metric. But month-over-month growth in organic website traffic could be a KPI if your goal is to improve SEO presence.
The Role of KPIs in Modern Marketing Strategy
With 5.04 billion social media users worldwide, Viralyft highlights the scale behind engagement KPIs such as reach, shares, and follower growth.
KPIs are the foundation of a strong marketing strategy. They provide clarity and focus. KPIs turn abstract goals like "increase brand awareness" into tangible targets. An example is "achieve a 20% increase in social media reach this quarter." This focus allows for better resource allocation. It improves team alignment and enables continuous optimization. Yaguara reports that over 2.6 billion people now buy online – illustrating why eCommerce KPIs like conversion rate and AOV are critical.
Why Vague Goals Fail: The Need for Quantifiable KPIs
Vague goals are destined for failure. They lack clear direction and accountability. Quantifiable KPIs solve this problem. They provide a clear definition of success. This clarity ensures everyone on the team understands the target. It also creates a framework for objective performance reviews and data-driven decision-making.
Types of Marketing KPIs
Marketing KPIs come in various forms. Their relevance and impact can vary based on the marketing channel, campaign objective, or even the industry.
Here are some common types of marketing KPIs:
- Financial KPIs: These metrics focus on the financial impact of marketing efforts, such as return on investment (ROI), cost per acquisition (CPA), and revenue growth rate.
- Acquisition KPIs: These KPIs evaluate the effectiveness of customer acquisition strategies and include metrics like customer acquisition cost (CAC), conversion rate, and click-through rate (CTR).CXL benchmarks show that the average CTR is ~6.6% for search and 0.6% for display – helpful baselines when evaluating ad performance KPIs.
- Retention KPIs: Metrics like customer churn rate, customer lifetime value (CLV), and customer engagement rate provide insights into customer loyalty and retention efforts.
- Social Media KPIs: These metrics measure the performance of social media marketing efforts, including social media reach, engagement rate, and follower growth rate.
- Content Marketing KPIs: Content marketing effectiveness can be gauged using KPIs such as website traffic, time on page, and bounce rate.
Another classification breaks down marketing KPIs into the following types:
- Quantitative KPIs: These are the numerical indicators that provide tangible counts or rates. For instance, website traffic can be measured by the number of visitors, and lead generation can be quantified by the number of leads captured over a specific period. For large-scale enterprises, these metrics can be further segmented by regions, product lines, or customer demographics to provide granular insights.
- Qualitative KPIs: Not all impactful metrics are quantitative. Qualitative KPIs offer insights into non-numerical factors that influence marketing success. Brand reputation, for example, can be gauged through customer feedback, reviews, or sentiment analysis.
- Leading KPIs: These are forward-looking indicators that provide insights into future performance. A surge in newsletter sign-ups or an increase in product demo requests might indicate a potential rise in sales or conversions in the coming months. For businesses with longer sales cycles or those launching new products, leading KPIs can be invaluable in forecasting and strategy adjustments.
- Lagging KPIs: Lagging KPIs, such as quarterly sales figures or year-over-year growth rates, offer a retrospective view of marketing effectiveness. They help businesses identify what worked, what didn't, and where there's room for improvement.
How to Choose the Right Marketing KPIs for Your Business
Selecting the right KPIs is a strategic process. It requires a deep understanding of your business goals. Choosing the wrong KPIs can lead you to optimize for outcomes that don't matter. Here's how to make the right choice.
Start with Your Business Objectives
Your business objectives should guide your KPI selection. Don't start with metrics. Start with what you want to achieve.
Use the SMART framework to define your goals: Specific, Measurable, Achievable, Relevant, and Time-bound.
A SMART goal might be: "Increase MQLs from organic search by 15% in Q3."
Align KPIs with the Marketing Funnel
Different KPIs are important at different stages of the customer journey. Align your chosen metrics with the marketing funnel to get a complete picture of your performance.
- Top of Funnel (TOFU): Focus on awareness. KPIs include website traffic, reach, and impressions.
- Middle of Funnel (MOFU): Focus on consideration and lead generation. KPIs include CPL, conversion rates, and email sign-ups.
- Bottom of Funnel (BOFU): Focus on decision and conversion. KPIs include CAC, sales conversions, and ROI.
Consider Your Industry and Business Model
The most important KPIs vary by industry. An e-commerce brand will obsess over cart abandonment rate. A B2B SaaS company will focus on MQL-to-SQL conversion rate. Tailor your KPI selection to what drives success for your specific business model and market.
Focus on Actionable KPIs, Not Vanity Metrics
Vanity metrics feel good but don't inform strategy. A million video views are great, but if they don't lead to any website visits or leads, the metric is hollow.
An actionable KPI directly connects to a business outcome. It provides insights that can lead to strategic changes. Choose KPIs that help you answer "what should we do next?"
Top 25+ Essential Marketing KPIs to Track
Here is a comprehensive list of the most critical KPIs. We've organized them by marketing function. These are the numbers that truly define success for modern marketing teams.
Website & Traffic KPIs
Your website is your digital storefront. These KPIs measure its health and effectiveness.
- Overall Site Traffic: The total number of visits to your site. It's a fundamental indicator of your marketing reach.
- Traffic by Source: Understand where visitors come from. This includes organic search, paid ads, direct visits, and social media.
- Bounce Rate: The percentage of visitors who leave after viewing only one page. A high bounce rate can indicate poor user experience or irrelevant traffic.
- Average Session Duration: How long visitors stay on your site on average. Longer sessions often signal higher engagement.
- Pages per Session: The average number of pages a user views during a visit. This helps gauge how deeply users are exploring your content.
Lead Generation & Conversion KPIs
These KPIs measure your ability to turn traffic into potential customers.
- Conversion Rate (CR): The percentage of visitors who complete a desired action. This could be filling out a form, downloading a guide, or making a purchase.
- Cost Per Lead (CPL): The total cost of a marketing campaign divided by the number of leads generated. It measures the efficiency of your lead generation efforts.
- Lead-to-Customer Rate: The percentage of leads that become paying customers. This KPI connects marketing efforts directly to sales.
- Marketing Qualified Leads (MQLs): Leads that are more likely to become customers based on their behavior (e.g., downloaded an ebook).
- Sales Qualified Leads (SQLs): MQLs that the sales team has accepted as ready for a direct sales follow-up.
SEO & Content Marketing KPIs
These KPIs show the impact of your search engine optimization and content efforts.
- Organic Traffic: The number of visitors who arrive at your site from unpaid search engine results. This is a primary indicator of SEO success.
- Keyword Rankings: Your website's position in search engine results for target keywords. Higher rankings drive more organic traffic.
- Backlinks: The number of links from other websites to yours. Quality backlinks are a major ranking factor for search engines.
- Time on Page: How long visitors spend on a specific piece of content. It's a strong indicator of content quality and relevance.
Paid Advertising (PPC) KPIs
Measure the performance of your paid search and social media campaigns.
- Click-Through Rate (CTR): The percentage of people who click your ad after seeing it. It measures ad relevance and creative effectiveness. As Wordstream reports in recent benchmark report, the average CTR for Google Ads is 3.17% for search and 0.46% for display ads.
- Cost Per Click (CPC): The amount you pay for each click on your ad. Lowering CPC while maintaining quality is a key goal.
- Cost Per Acquisition (CPA): The cost to acquire one customer through a paid campaign. It's often the same as Customer Acquisition Cost (CAC) for a specific channel.
- Return on Ad Spend (ROAS): The total revenue generated for every dollar spent on advertising. It's a direct measure of ad campaign profitability.
Social Media Marketing KPIs
Gauge the effectiveness of your brand's presence on social networks.
- Engagement Rate: The percentage of your audience that interacts with your content (likes, comments, shares). High engagement signals a healthy community.
- Reach & Impressions: Reach is the number of unique people who see your content. Impressions are the total number of times your content is displayed. As Hootsuite reports, understanding the difference between reach and impressions is crucial, since impressions count multiple views by the same user, whereas reach measures unique viewers.
- Follower Growth Rate: How quickly your audience is growing. This measures brand appeal and content strategy success.
Email Marketing KPIs
Email remains a powerful channel. These KPIs measure its performance.
- Open Rate: The percentage of email recipients who open your email. It's heavily influenced by your subject line.
- Click-Through Rate (CTR): The percentage of email recipients who clicked on a link within your email. This measures the effectiveness of your email's content and call-to-action.
- Unsubscribe Rate: The percentage of recipients who opt out of your email list. A high rate can signal issues with content relevance or frequency.
Customer & Revenue KPIs
These are the ultimate bottom-line metrics. They tie marketing directly to business revenue.
- Customer Acquisition Cost (CAC): The total cost of sales and marketing to acquire a single new customer.
- Customer Lifetime Value (CLV): The total revenue a business can expect from a single customer account throughout their relationship.
- CLV:CAC Ratio: A critical metric for business health. A healthy ratio (often 3:1 or higher) means your customer acquisition is profitable.
- Net Promoter Score (NPS): A measure of customer satisfaction and loyalty. It asks customers how likely they are to recommend your brand.
- Customer Retention & Churn Rate: Retention is the percentage of customers you keep over time. Churn is the percentage you lose.
Overall Marketing Performance KPIs
- Marketing Return on Investment (ROI): The profit generated by marketing activities as a percentage of the marketing investment. It's the ultimate measure of marketing's financial contribution.
- Marketing Originated Customer Percentage: The percentage of new customers that originated from a marketing-generated lead.
How to Calculate Key Marketing KPIs (With Formulas)
Understanding the formulas behind your KPIs is essential for accurate tracking and analysis. Here are the calculations for some of the most important ones.
1. Calculating Customer Acquisition Cost (CAC)
CAC shows how much it costs to get a new customer. It's vital for budgeting and understanding profitability.
CAC = (Total Marketing Costs + Total Sales Costs) / Number of New Customers Acquired
2. Calculating Customer Lifetime Value (CLV)
CLV predicts the net profit attributed to the entire future relationship with a customer.
CLV = (Average Purchase Value x Average Purchase Frequency) x Average Customer Lifespan
3. Calculating Conversion Rate
This formula can be applied to any desired action, from a website purchase to a content download.
Conversion Rate = (Number of Conversions / Total Number of Visitors) x 100
4. Calculating Return on Investment (ROI)
ROI is the ultimate proof of marketing's value. It shows the financial return on your marketing spend.
ROI = ((Sales Growth - Marketing Cost) / Marketing Cost) x 100
Building a KPI Framework: From Data to Decision-Making
Tracking KPIs is only the first step. You need a framework to turn that data into action. This involves setting benchmarks, establishing a reporting rhythm, and ensuring your data is reliable.
Setting Baselines and Benchmarks
You can't know if you're improving without a starting point. First, establish your baseline performance for each KPI. Then, research industry benchmarks to understand how you compare to competitors. Set realistic, incremental goals for improvement.
Establishing a Reporting Cadence
Different stakeholders need reports at different intervals. Operational teams might need daily or weekly dashboards. Leadership might prefer a monthly or quarterly summary. A consistent reporting cadence keeps everyone informed and aligned.
The Importance of a Robust Marketing Data Pipeline
Your KPIs are only as good as the data behind them. A reliable marketing data pipeline is essential. It ensures that data is collected, cleaned, and integrated accurately from all your sources. Without it, you risk making decisions based on flawed information.
Using KPIs for Forecasting and Strategic Planning
Historical KPI trends are powerful tools for forecasting. If you know your average lead-to-customer rate, you can predict how many new customers will result from a new lead generation campaign. This allows for more accurate planning and resource allocation.
Tools and Platforms for Tracking Marketing KPIs
Choosing the right technology is critical for effective KPI tracking. Each option has its strengths and weaknesses.
The Limitations of In-Tool Analytics
Native analytics in platforms like Google Analytics, Google Ads, Facebook Ads, LinkedIn Ads, and other execution tools are valuable for tactical channel analysis, CTR trends, CPC shifts, audience performance, and conversion flow diagnostics.
However, these tools operate in silos. They only measure their own ecosystem, using platform-specific attribution logic and inconsistent definitions of conversions, revenue, and engagement.
This makes it impossible to:
- See the full multi-touch path across channels and devices
- Validate platform-reported results against CRM and revenue systems
- Reconcile spend pacing and performance across campaigns
- Understand incrementality vs. platform-claimed conversions
In-platform analytics are necessary for optimization, but insufficient for executive-level reporting or strategic budget allocation.
When to Use a CRM
CRMs like Salesforce and HubSpot excel at managing pipeline, tracking opportunity stages, and connecting leads to revenue outcomes. They are critical for understanding customer lifecycle KPIs such as MQL → Opportunity → Closed-Won conversion rates, sales velocity, and LTV.
However, CRMs typically lack:
- Granular marketing channel and ad-level performance data
- Impression and click-stream context
- Cross-platform cost data
- Up-funnel attribution for channels like paid social, programmatic, and video
They provide the “revenue truth,” but not the marketing context needed to optimize spend or understand CAC efficiency across acquisition sources.
The Power of a Unified Analytics Platform
A unified analytics platform, like Improvado, bridges the gap between tactical channel reporting and executive revenue intelligence. Improvado automates data ingestion, normalization, and governance across 1,000+ marketing, sales, web analytics, and revenue systems, including ad platforms, CRMs, attribution tools, and data warehouses.
With Improvado, teams gain:
- A single source of truth for CAC, ROAS, LTV, and pipeline contribution
- Real-time metric pacing and spend oversight across platforms
- Automated transformation and consistent naming logic across campaigns
- Clean, analysis-ready data delivered to Snowflake, BigQuery, Databricks, Tableau, Power BI, and Looker
- AI-powered insight generation and dashboarding for fast answers without SQL
- Full campaign lifecycle visibility, from impression to closed-won revenue
This allows marketing and revenue leaders to move beyond fragmented dashboards and build a unified measurement engine that supports accurate attribution, financial accountability, and confident scaling of media investments.
Comparison: Choosing Your KPI Tracking Solution
This table compares the different approaches to KPI tracking. It highlights the advantages of a unified solution.
| Aspect | In-Tool Analytics | CRM Analytics | Improvado (Unified Platform) |
|---|---|---|---|
| Data Consolidation | None (Siloed by platform) | Limited to CRM & integrated apps | Complete (1,000+ sources) |
| Cross-Channel View | No | Partial | Yes (Holistic view) |
| Historical Data Access | Often limited | Good | Excellent (Years of data) |
| Real-Time Reporting | Varies by platform | Typically delayed | Yes (Live dashboards) |
| Customization | Low | Medium | High (Fully customizable) |
| True ROI Calculation | Impossible | Difficult | Accurate and easy |
| Manual Work Required | High (Manual exporting) | Medium | Low (Fully automated) |
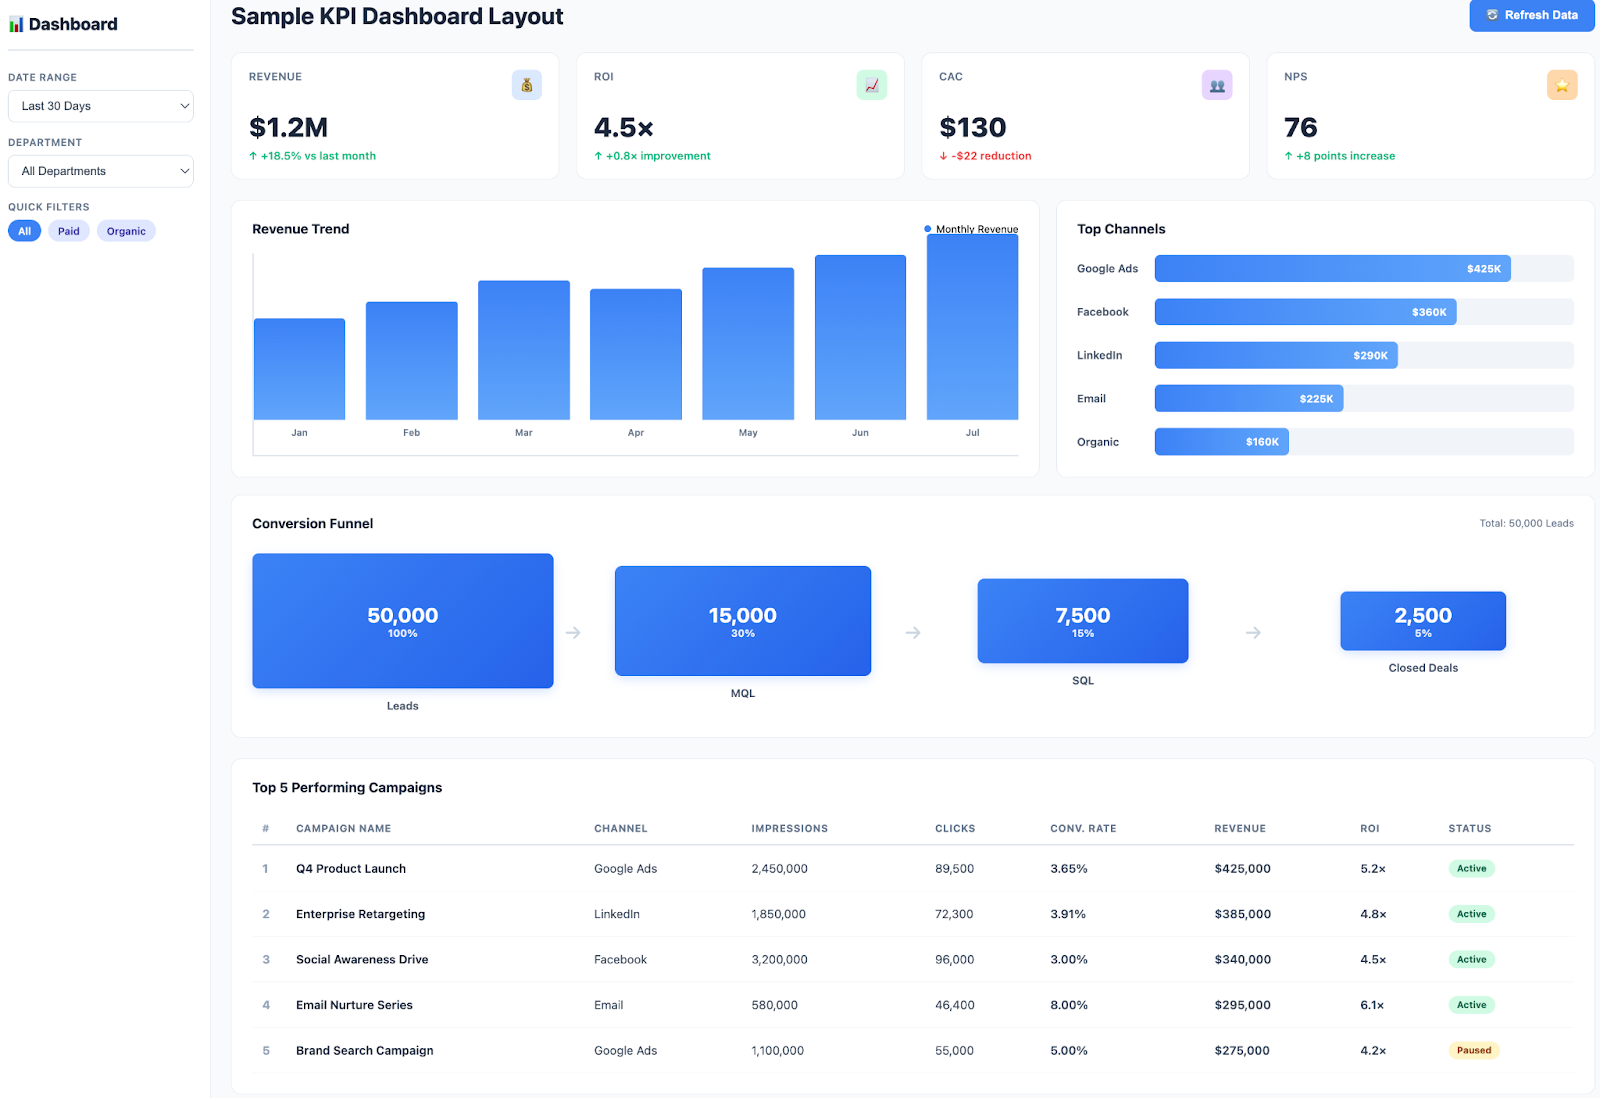
Visualizing Your Data: The Power of Marketing KPI Dashboards
Raw data is hard to interpret. Visual dashboards transform complex numbers into clear, actionable insights. They are essential for monitoring performance and communicating results effectively.
Why Visual Dashboards Drive Better Insights
The human brain processes images far faster than text. Visual dashboards with charts and graphs make it easy to spot trends, identify outliers, and understand performance at a glance. This speed to insight allows for quicker, more effective decision-making.
Key Elements of an Effective KPI Dashboard
A great marketing analytics dashboard is clear, concise, and tailored to its audience. It should feature the most important KPIs at the top. Use a mix of visualizations like line charts for trends, bar charts for comparisons, and scorecards for key totals.
Creating Custom KPI Dashboards for Different Stakeholders
Not everyone needs to see the same data. A CMO needs a high-level overview of ROI and pipeline. A channel manager needs granular details on campaign performance. Creating custom KPI dashboards ensures each stakeholder gets the information they need without unnecessary noise.
The Role of Reporting Automation
Building reports manually is time-consuming and prone to error. The power of reporting automation is that it frees up your team's time. Instead of spending hours compiling data, they can focus on analyzing insights and optimizing strategy.
Advanced KPI Strategy: Attribution and ROI Measurement
To truly understand performance, you must go beyond basic KPIs. Advanced strategies like marketing attribution are essential for optimizing your budget and proving your impact.
Moving Beyond Last-Touch Attribution
Last-touch attribution gives 100% of the credit for a conversion to the final touchpoint. This model is simple but often misleading. It ignores all the earlier marketing efforts that influenced the customer's journey.
Understanding Different Marketing Attribution Models
There are many marketing attribution models, such as linear, time-decay, and U-shaped. Each distributes credit differently across touchpoints. Choosing the right model helps you understand which channels are most effective at each stage of the funnel.
How Accurate Attribution Impacts Your KPIs
Accurate attribution changes your understanding of your KPIs. A channel that looked ineffective under a last-touch model might be revealed as a critical driver of initial awareness. This allows you to make smarter budget allocation decisions.
Proving Marketing's Value with True ROI
By combining accurate, multi-touch attribution with complete cost data, you can calculate the true ROI of every channel and campaign. This is the ultimate way to prove marketing's contribution to the bottom line.
Overcoming Common KPI Tracking Challenges
Effective KPI tracking is not without its hurdles. Many organizations struggle with common challenges that undermine their data-driven efforts.
Data Silos and Inaccurate Reporting
When data lives in separate, disconnected platforms, it's impossible to get a single view of performance. This leads to conflicting reports and a lack of trust in the data. This is where data integration becomes critical, as it bridges these gaps.
ASUS needed a centralized platform to consolidate global marketing data and deliver comprehensive dashboards and reports for stakeholders.
Improvado, an enterprise-grade marketing analytics platform, seamlessly integrated all of ASUS’s marketing data into a managed BigQuery instance. With a reliable data pipeline in place, ASUS achieved seamless data flow between deployed and in-house solutions, streamlining operational efficiency and the development of marketing strategies.
"Improvado helped us gain full control over our marketing data globally. Previously, we couldn't get reports from different locations on time and in the same format, so it took days to standardize them. Today, we can finally build any report we want in minutes due to the vast number of data connectors and rich granularity provided by Improvado.
Improvado saves us about 90 hours per week and allows us to focus on data analysis rather than routine data aggregation, normalization, and formatting."

The Challenge of Cross-Channel Social Media Analytics
Measuring the combined impact of campaigns across Facebook, LinkedIn, Twitter, and TikTok is a major challenge. Each platform has its own metrics and reporting. Effective social media analytics requires a tool that can normalize and aggregate data from all networks.
Ensuring Data Governance and Consistency
Inconsistent data is a common problem. For example, inconsistent UTM tracking can make it impossible to attribute traffic and conversions correctly. Establishing clear data governance policies is crucial for maintaining data quality and accuracy.
Marketing KPIs for Specific Roles and Industries
While some KPIs are universal, others are specific to certain roles or industries. Tailoring your focus ensures you're tracking what matters most for your context.
KPIs for a Marketing Manager
Marketing managers are responsible for tactical execution, channel health, and short-term performance acceleration. Their KPI structure emphasizes efficient acquisition and campaign scalability.
Key KPIs include:
- Cost per lead (CPL) and cost per opportunity
- Conversion rate by channel and audience segment
- Return on ad spend (ROAS) and cost efficiency metrics
- Click-through rate (CTR) and engagement performance
- Funnel progression from inquiry → MQL → SQL
Focus: Optimizing performance levers, audience-channel fit, and budget utilization to meet pipeline targets.
KPIs for a CMO and Marketing Executives
Executives require KPIs that reflect financial health, market momentum, and long-term value creation. Their dashboards center on capital efficiency, revenue influence, and strategic scalability.
Critical KPIs include:
- Customer acquisition cost (CAC) and CAC payback period
- Customer lifetime value (CLV) and LTV/CAC ratio
- Marketing-sourced and marketing-influenced pipeline and revenue
- Revenue efficiency metrics (pipeline velocity, win rates, deal size trends)
- Marketing ROI and contribution to total revenue growth
Focus: Proving commercial impact, aligning resources to revenue, and maintaining financial accountability across channels.
KPIs for E-Commerce Brands
E-commerce organizations manage high-volume, fast-cycle revenue engines. KPI priorities reflect immediate revenue efficiency and lifecycle monetization.
Essential KPIs include:
- Average order value (AOV) and revenue per visitor
- Cart and checkout abandonment rates
- First-purchase CAC and repeat purchase rate
- ROAS and margin-adjusted return
- CLV and customer retention rate
Focus: Maximizing profitability of acquisition, lifecycle value, and repeat monetization while controlling paid spend and unit economics.
KPIs for B2B SaaS Companies
SaaS growth motions revolve around quality pipeline creation, lifecycle conversion, and predictable recurring revenue. KPIs must reflect funnel progression and long-term value.
Key KPIs include:
- MQL → SQL → Opportunity conversion rates
- Pipeline sourced and influenced by marketing
- CAC and CAC payback period
- Monthly/annual recurring revenue (MRR/ARR) from marketing channels
- Lead quality metrics (ICP match rate, qualification score, velocity through stages)
Focus: Generating qualified pipeline at scale, improving conversion efficiency across the revenue funnel, and driving recurring revenue growth.
Conclusion
Modern marketing performance isn’t judged by activity, it’s judged by efficiency, pipeline contribution, and revenue impact.
A strong KPI framework makes performance measurable, exposes what’s working and what’s wasting budget, and enables faster decisions grounded in data instead of assumptions. When KPIs are structured correctly and tied directly to financial outcomes, they become a competitive advantage rather than a reporting exercise.
Improvado gives marketing teams the infrastructure to operate with this level of rigor. It centralizes data across every paid and organic channel, CRM, and analytics system; standardizes performance metrics; and surfaces real-time pacing and ROI insights without manual prep.
With automated reporting, cross-channel attribution, and trustworthy revenue data, Improvado turns KPI tracking into a scalable operational system that accelerates decision-making and keeps spend aligned to business outcomes.

Related reading: Marketing Orchestration Guide 2026: Strategy & Tools, Real-Time Marketing Guide 2026: Strategy & Tools, What Are Marketing Activities: Key Examples for Growth 2026 | Improvado, Insertion Order (IO): The Complete Guide for Advertisers [2026], What Is Growth Marketing? A Complete Guide & Strategy for 2026, Stealth Marketing Explained: Build Brand Trust & Growth | Improvado


