
Imagine a scenario where you understand your customers so deeply that you can predict their needs, cater to their preferences, and communicate with them in the most effective way, making good use of every marketing dollar invested.
This is not a pipe dream, but an achievable reality through marketing analytics.
But for now, 80% of companies feel overwhelmed by the amount of data they collect, and the sheer volume of this data prevents them from using it effectively.
In this article, we'll explore the challenges associated with marketing analysis and marketing data collection, how to solve them, and review marketing analytics software that will help your team make the most out of data and marketing budgets.
What Is Marketing Analytics?
To put it simply, marketing analytics connects activities to outcomes. By linking spend and effort across marketing campaigns to tangible business results, teams can identify which marketing channels, creatives, and audiences deliver the highest value.
This transparency enables smarter decision-making and faster optimization cycles.
Additionally, marketing analytics should serve as the basis for setting goals. You first examine the funnel and stages that are underperforming and come up with measures to improve those metrics and optimize expenses.
Why Is Marketing Analytics Important?
While the benefits of marketing analytics may seem obvious, its real value lies in how it transforms decision-making, efficiency, and growth potential. Beyond tracking metrics, it builds the foundation for a marketing function that is accountable, agile, and aligned with business objectives.
Linking marketing spend to business outcomes
Marketing analytics provides a clear connection between investments and business results.
By mapping each dollar spent to the revenue it generates, decision-makers can see which channels, campaigns, and strategies deliver the highest return. This transparency enables more effective budget allocation and justifies marketing investments at the executive level.
When investments are tied to outcomes, budget calls get easier.
Higher marketing ROI and revenue growth
Forrester’s 2024 research shows that firms that operationalize data around the customer, and therefore around measurement, outpace their peers in revenue and profit growth, reinforcing analytics as a strategic lever, not just a reporting function.
Enabling data-driven decision making
Without reliable data, strategy relies on assumptions.
Marketing analytics replaces guesswork with evidence.
It delivers accurate, timely performance metrics that guide which initiatives to scale, adjust, or retire, ensuring that marketing decisions are rooted in measurable results, not intuition.
Unifying disparate data sources
In complex marketing environments, data often lives across dozens of platforms: ads, email, social, web, CRM, and more.
Marketing analytics systems unite these silos into a single source of truth, providing a holistic view of performance. This is critical because data fragmentation is a major pain point: 43% of marketers cite data silos or lack of access to data as a top frustration in their work
With all performance data accessible in one place, teams can eliminate manual reporting, minimize errors, and maintain complete visibility into the marketing funnel.
ASUS needed a centralized platform to consolidate global marketing data and deliver comprehensive dashboards and reports for stakeholders.
Improvado, an enterprise-grade marketing analytics platform, seamlessly integrated all of ASUS’s marketing data into a managed BigQuery instance. With a reliable data pipeline in place, ASUS achieved seamless data flow between deployed and in-house solutions, streamlining operational efficiency and the development of marketing strategies.
"Improvado helped us gain full control over our marketing data globally. Previously, we couldn't get reports from different locations on time and in the same format, so it took days to standardize them. Today, we can finally build any report we want in minutes due to the vast number of data connectors and rich granularity provided by Improvado.
Improvado saves us about 90 hours per week and allows us to focus on data analysis rather than routine data aggregation, normalization, and formatting."

Improving campaign performance in real time
Analytics isn’t just retrospective.
By continuously monitoring marketing campaigns, marketing analytics enable immediate optimization. Performance trends can be identified early, allowing teams to adjust targeting, creative, and spend before underperforming campaigns drain the budget.
This agility is critical for maintaining efficiency and maximizing ROI.
What Are the Key Types of Marketing Analytics?
Marketing analytics spans multiple approaches, each answering different business questions and serving a specific role in decision-making:
- Descriptive analytics: Summarizes historical performance to establish a factual baseline. It consolidates cross-channel metrics such as reach, conversions, and revenue into a unified view, revealing patterns over time. This baseline is crucial for benchmarking and identifying shifts that warrant further investigation.
- Diagnostic analytics: Explores causality to explain performance outcomes. It correlates variables like audience segments, creative variations, bid strategies, and market conditions to pinpoint the drivers behind success or underperformance. By isolating these factors, teams can address inefficiencies before they compound.
- Predictive analytics: Models future outcomes using statistical techniques, machine learning, and historical datasets. It forecasts KPIs such as conversion volume, customer lifetime value, and churn probability, supporting proactive budget allocation and resource planning aligned with likely market conditions.
- Prescriptive analytics: Recommends specific, data-backed actions to achieve optimal results. It utilizes scenario modeling and optimization algorithms to determine the optimal allocation of spend, sequencing of campaigns, or audience retargeting strategy, thereby turning insights into immediate operational impact.
Who Benefit from Marketing Data and Analytics?
In the realm of marketing, numerous roles coexist, each distinct in its responsibilities. This might lead to the question "Which of these roles truly benefit from marketing data and analytics?"
The short answer is everyone, even people who don’t necessarily have “marketing” in their title.
- Chief Marketing Officers (CMOs) and VPs of Marketing: Gain a consolidated view of performance across channels, enabling evidence-based budget allocation, faster ROI validation, and strategic planning grounded in real results.
- Marketing Operations and Revenue Operations Teams: Rely on analytics to automate data flows, eliminate manual reporting, and maintain data integrity across platforms. This ensures decision-makers work from a single, trusted source of truth.
- Performance and Growth Marketers: Use analytics to pinpoint high-performing marketing campaigns, audiences, and creatives, optimizing spend in near real-time to maximize returns.
- Content and creative teams: Leverage engagement data and audience insights to refine messaging, formats, and distribution strategies that align with proven performance patterns.
- Sales teams: Access insights on lead quality, pipeline velocity, and account engagement, ensuring that outreach focuses on the most promising opportunities.
- Finance and Strategy Leaders: Benefit from accurate attribution and revenue impact reporting, which supports forecasting, resource planning, and alignment between marketing spend and business goals.
How Does Marketing Analytics Work?
A practical approach to marketing analytics isn’t reliant on a single strategy, best practice, or tool. Instead, it’s based on the culmination of several components that ultimately provide you with the ability to set up and benefit from marketing analytics within your company.
1. Data collection and integration
The lifeblood of marketing analytics is data.
Data can come from myriad sources: websites, CRM, social media networks, ad platforms, and third-party APIs, to name a few. Each of these data points provides valuable insights into customer behavior, marketing campaign performance, and overall market trends.
The power of this data is not fully unleashed until it's unified and integrated. Some approaches you can take to effectively gather and integrate your marketing data:
- Manual data collection: It's the process of manually exporting data directly from platforms (such as social media networks or ad platforms), validating, and cleaning the data to ensure it's accurate, complete, and usable. This could involve removing duplicate entries, correcting errors, and filling in missing values.
- Automated data collection tools: When manual data collection is inefficient, marketers can rely on automated data collection tools that gather data from various sources. An example is a social media analytics tool that pulls data from multiple social media networks and provides a unified view of all your organic social activities.
- Extract, transform, load (ETL) solutions: Automated data collection tools primarily focus on gathering data and often fall short when it comes to converting this raw data into a format ready for in-depth analysis. ETL tools are used to extract data from different sources, transform it into an analysis-ready format, and then load it into a desired destination for further analysis (BI tool, data warehouse, or analytics tool). This end-to-end process makes ETL tools instrumental in managing large volumes of data.
Not sure which tool is best for your organization? This table will help you evaluate where you stand and which approach is right for you.
| Method | Best for | Cons |
|---|---|---|
| Manual data collection | Small datasets, one-time analysis, or when source systems lack integrations; quick checks or ad hoc reporting. | Time-consuming, error-prone, not scalable; reporting delays reduce agility. |
| Automated data extraction via native connectors | Fast setup where platforms offer built-in integrations; teams using a limited number of tools. | Limited customization; may not support complex data models or all desired metrics. |
| ETL (Extract, Transform, Load) | Enterprise-scale environments needing transformation and normalization before analysis; unifying large, diverse datasets. | Requires technical expertise and maintenance; setup can be resource-intensive. |
| API-based integrations | Flexible, customizable data pulls from multiple platforms; supports real-time or near real-time updates. | Development and maintenance costs; dependent on API reliability and rate limits. |
| Third-party marketing data platforms | Centralized, managed pipelines that integrate, clean, and standardize marketing data at scale. | Licensing cost; dependent on vendor capabilities and roadmap. |
In the context of marketing analytics, it's also vital to note that data and insights are not the same thing.
Data is raw numbers, while insights are the meaningful conclusions drawn from this data. The route from data to insights to strategic actions isn't as short as one might think. It requires meticulous analysis, a keen understanding of how to work with data, and the right analytical tools.
2. Data analysis
Once marketing data is collected, cleaned, and centralized, the next step is applying analytical techniques that reveal performance drivers, customer behaviors, and optimization opportunities.
This stage is where data moves from being an asset to a decision-making engine.
The choice of analytical technique depends on the business question at hand, but several methods are foundational in enterprise marketing analytics:
- Attribution modeling: Measures the contribution of each marketing touchpoint on a customer journey to a conversion. Beyond basic first-touch or last-touch models, advanced approaches such as algorithmic, multi-touch, and data-driven attribution utilize statistical weighting to accurately reflect the true incremental impact of each channel.
- A/B and multivariate testing: While A/B testing isolates the impact of a single variable, multivariate testing examines multiple elements simultaneously, such as headlines, images, and CTAs, to identify the optimal combination. This is especially useful for high-traffic campaigns where small lifts can compound into significant ROI gains.
- Cohort and retention analysis: Segments users based on acquisition date, source, or behavior, then measures how retention, engagement, or monetization changes over time. This is critical for assessing lifetime value by segment and spotting churn risks early.
- Regression analysis: Quantifies the influence of multiple variables, such as bid adjustments, creative formats, or seasonal timing, on performance metrics. Multiple regression models can control for confounding factors, giving a more accurate picture of what truly drives results.
- Time series forecasting: Uses historical performance data to predict future trends, accounting for seasonality, campaign cycles, and external factors like economic shifts. This supports proactive budget allocation and inventory planning.
- Cluster analysis: Groups audiences based on shared attributes or behaviors without pre-defined segments. It’s often used for discovering new high-value audience groups and tailoring campaigns accordingly.
- Lift analysis: Compares exposed and control groups to measure the incremental impact of a campaign. This is particularly valuable for upper-funnel initiatives where direct attribution may not fully capture influence.
3. Reporting and visualization
After analysis, the value of marketing analytics depends on how clearly and efficiently insights are communicated. It’s all about presenting the right metrics, in the right context, to the right audience.
Dashboards remain the backbone of marketing reporting, providing a centralized and real-time view of performance across all channels.
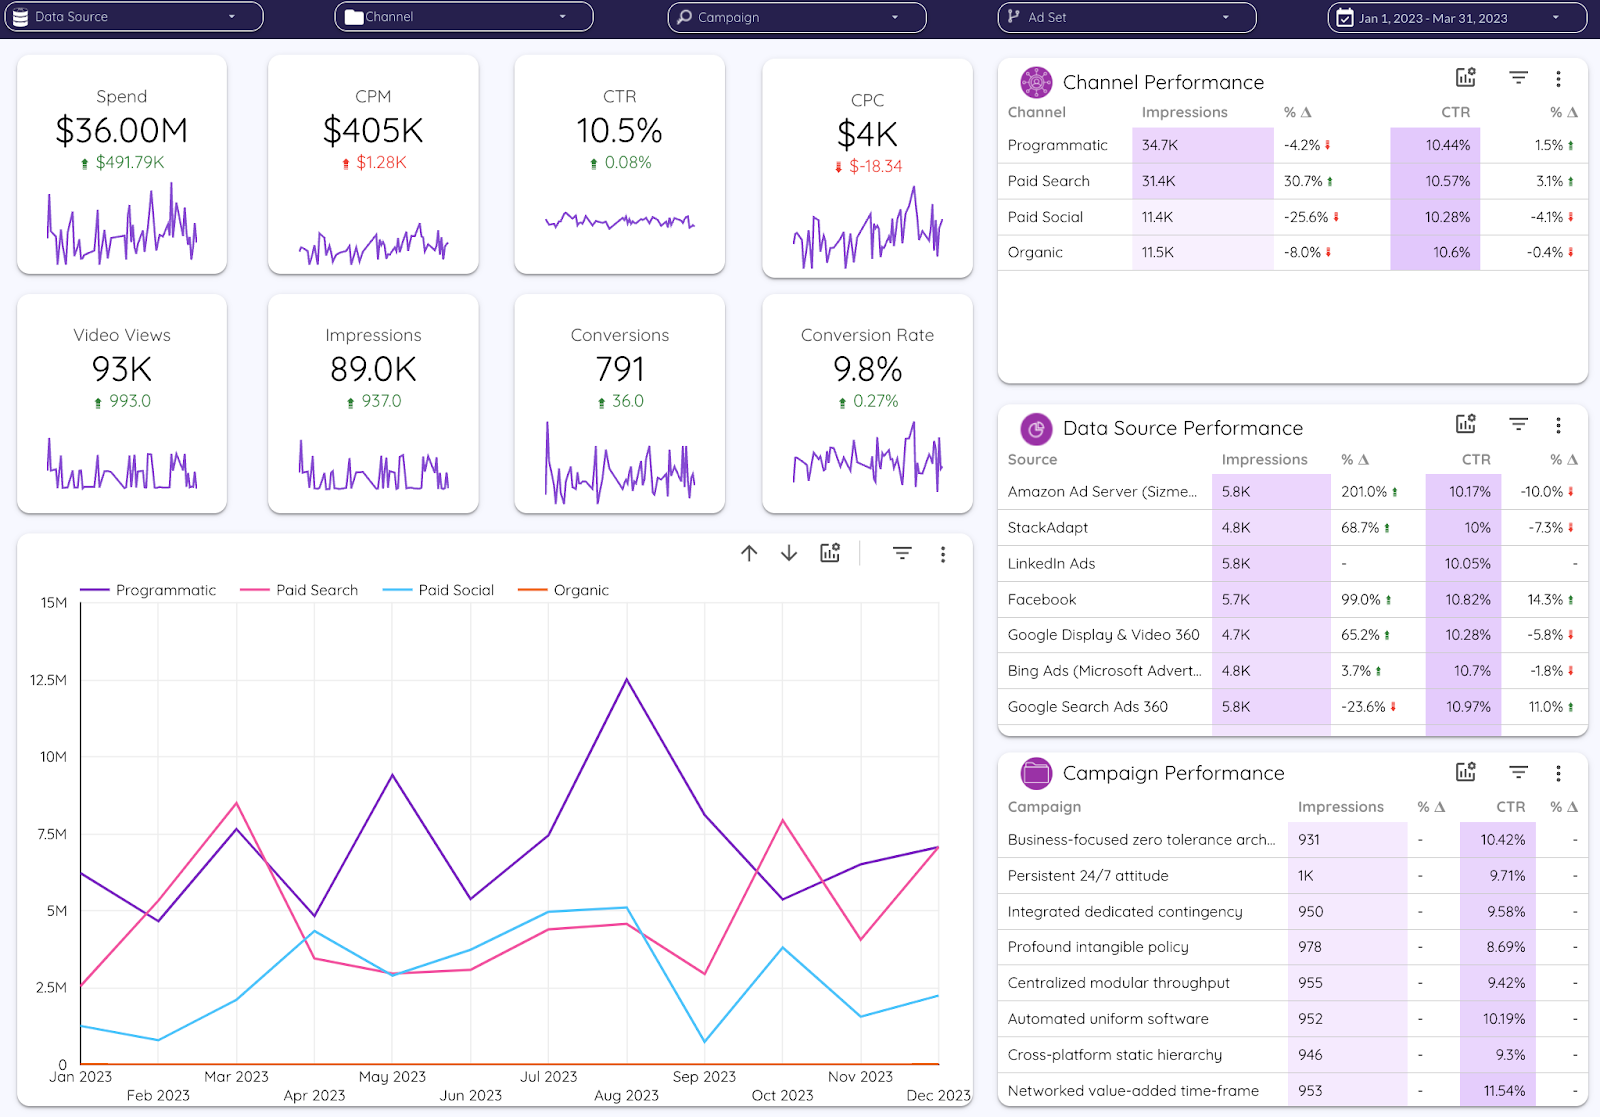
A strategic dashboard design starts with aligning KPIs to organizational goals, then structuring them to reflect the marketing funnel.
Advanced dashboards incorporate drill-down functionality, allowing users to transition seamlessly from macro-level performance views to channel- or campaign-level details.
For global or multi-brand organizations, this often means configurable views that allow regional or product-specific perspectives without losing the ability to compare performance enterprise-wide.
AI capabilities now extend the role of dashboards beyond static visualization.
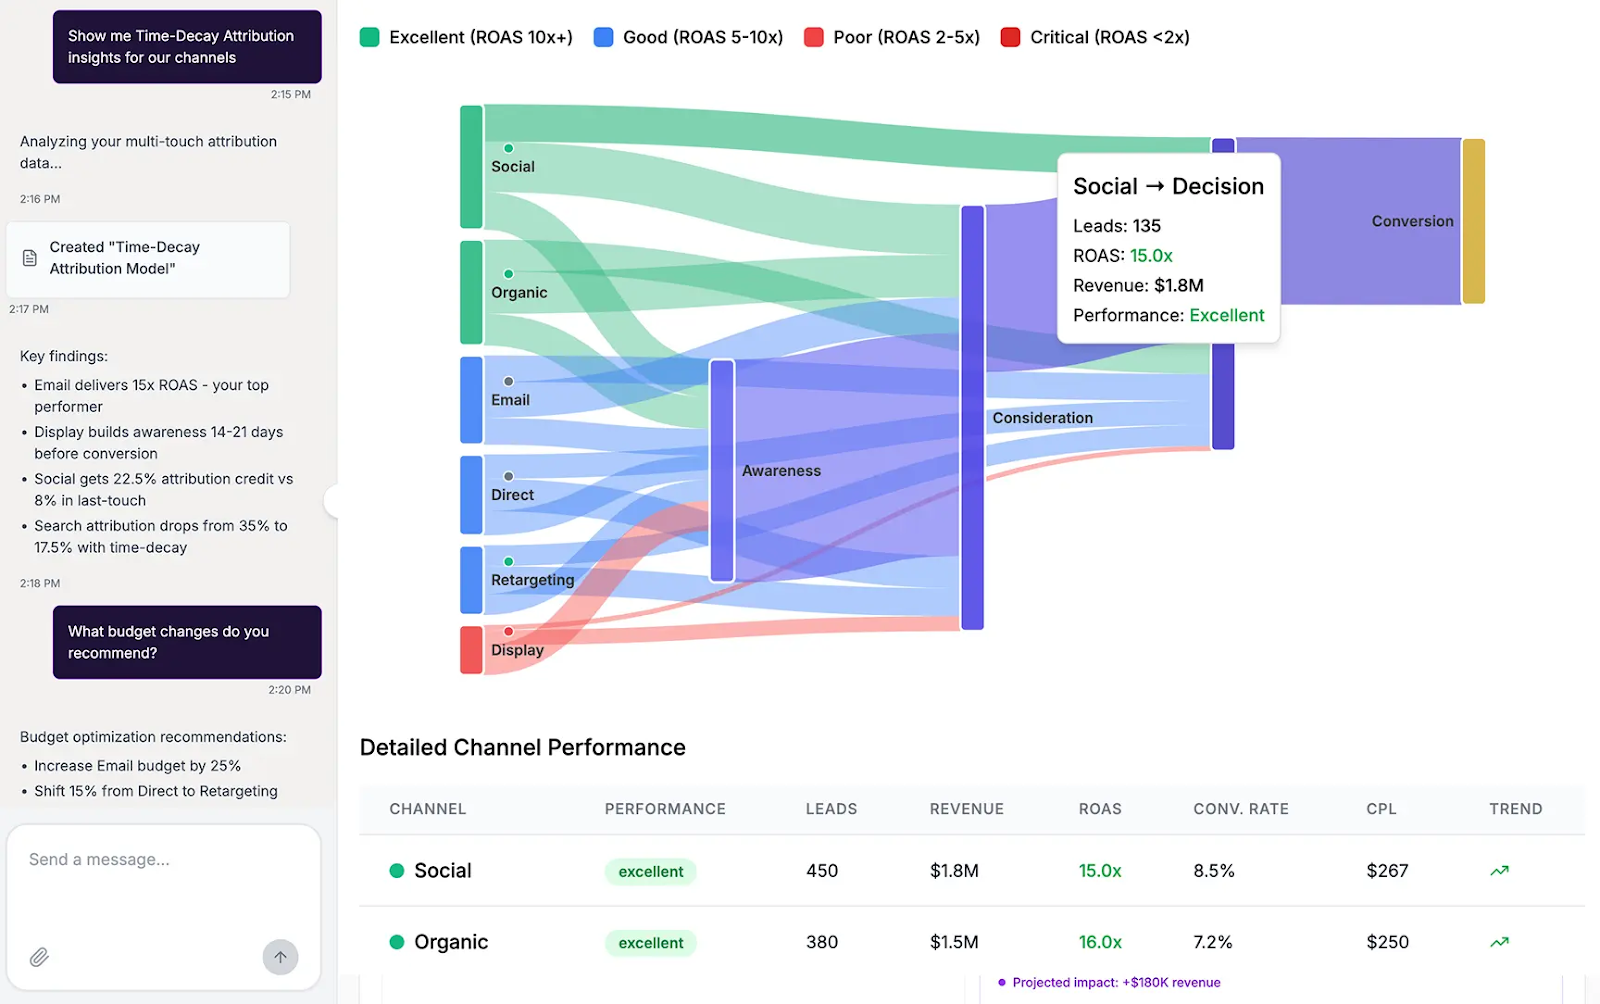
Modern AI reporting tools enable users to interact with data through natural language querying tools, allowing them to ask questions such as “Which campaigns delivered the highest ROAS last quarter?” and receive instant, accurate answers without needing to navigate through filters or manually build queries.
This lowers the barrier to advanced analysis, enabling both technical and non-technical stakeholders to extract the insights they need in real time.
In addition to querying, AI-powered report generation can automatically compile tailored summaries for different audiences. Executives may receive concise overviews tied to strategic KPIs, while marketing operations teams get more granular breakdowns with actionable recommendations.
AI Agents can even schedule and deliver these reports on a recurring basis or trigger them based on certain performance conditions, ensuring the right insights reach the right people at the right time.
4. Insight to action
The ultimate value of marketing analytics lies in what happens after the insights are uncovered.
This step requires both interpretation and prioritization.
For example, if Google Ads analytics shows that a specific campaign or keyword group delivers the lowest cost per acquisition (CPA) while maintaining high conversion quality, the budget can be shifted toward those terms to maximize efficiency and scale profitable traffic.
At the enterprise level, moving from insight to action often involves cross-functional coordination.
Marketing operations may adjust targeting parameters or creative assets, while finance updates budget forecasts and sales shifts outreach strategy based on improved lead quality. The speed and precision of this process determine how quickly performance gains can be realized.
Key Metrics and KPIs in Marketing
Understanding which metrics matter and how they connect to larger business objectives can make the difference between a campaign that falters and one that flourishes. Here, we delve into the essential metrics and key performance indicators (KPIs) that provide insight into the effectiveness of marketing endeavors.
1. Return on Marketing Investment (ROMI)
This metric provides an understanding of the profitability resulting from marketing activities. It's calculated by subtracting the marketing cost from the net profit and then dividing this by the marketing cost.
Why it matters: ROMI gives a clear picture of the financial returns generated by marketing investments. A positive ROMI indicates successful marketing initiatives, while a negative value signals the need for recalibration.
2. Customer Acquisition Cost (CAC)
CAC represents the total cost associated with acquiring a new customer. This includes costs related to advertising, promotions, and other marketing efforts.
Why it matters: CAC offers insights into the efficiency of marketing efforts. A lower CAC indicates that the company is acquiring customers at a cost-effective rate, while a high CAC might indicate the need for optimization.
3. Customer Lifetime Value (CLV)
CLV estimates the total revenue a business can expect from a single customer account throughout the relationship duration.
Why it matters: By juxtaposing CLV with CAC, businesses can gauge the long-term value of a customer against the cost of acquiring them.
4. Conversion Rate
This metric represents the percentage of visitors to a website or landing page who take a desired action, such as signing up for a newsletter or making a purchase.
Why it matters: Conversion rates provide insights into how effectively a marketing asset leads to the desired customer action.
5. Churn Rate
The churn rate calculates the percentage of customers who stop using a product or service over a given period.
Why it matters: A high churn rate suggests customer dissatisfaction, highlighting the need for product improvements and better engagement. Reducing churn can be achieved through enhanced support, personalized communication, and loyalty programs.
While numerous metrics can be monitored, it's crucial to discern which ones align most closely with business goals and objectives. By regularly tracking and analyzing these KPIs, marketing teams can make informed decisions, refine marketing strategies, and consistently drive growth.
What Are the Top Marketing Analytics Tools and Software?
The marketing analytics stack is rarely a single platform. It’s a combination of specialized tools working together to collect, unify, analyze, and present data.
The right mix depends on the organization's size, the complexity of its campaigns, and the maturity of its analytics operations.
Below are the main categories of tools that form the foundation of enterprise-grade marketing analytics:
- Web analytics platforms: These tools track user behavior on websites and digital properties, providing visibility into traffic sources, engagement patterns, and conversion paths. Google Analytics 4, Adobe Analytics, and Matomo are common examples.
- Marketing data integration & ETL solutions: Data integration platforms automate the process of collecting data from multiple marketing, sales, and advertising platforms, transforming it into a standardized format for analysis. Improvado is an example purpose-built for marketing teams, connecting hundreds of sources, automating data normalization, and delivering a single source of truth without manual ETL work.
- Business intelligence (BI) and data visualization tools: BI tools like Tableau, Power BI, and Looker enable teams to visualize complex datasets and build interactive dashboards. When connected to a centralized data source, they allow executives to monitor performance at a high level while enabling analysts to drill down into granular details.
- Attribution and measurement platforms: These solutions, such as Google’s Data-Driven Attribution or Improvado-powered attribution, focus on quantifying the impact of each marketing touchpoint on conversions. They help allocate the budget more effectively by showing the real contribution of every channel and campaign.
- A/B testing & experimentation tools: Platforms like Optimizely and VWO allow teams to run controlled experiments to determine which creative, messaging, or experience elements perform best. This ensures optimization efforts are backed by statistically valid data.
- Customer data platforms (CDPs): CDPs such as Segment, BlueConic, or Tealium unify customer data from multiple sources, creating comprehensive profiles that support personalization and advanced segmentation.
- AI and predictive analytics tools: Modern marketing stacks are increasingly incorporating AI-driven solutions that can detect trends, forecast performance, and generate actionable recommendations. Improvado’s AI Agent exemplifies this category, allowing natural language queries, automated reporting, and real-time anomaly detection to guide faster, more informed marketing decisions.
Implementing a Marketing Analytics Strategy
Implementing a successful marketing analytics strategy is a complex but rewarding endeavor. The process encompasses a series of crucial steps.
1. Understand your current state
Begin by auditing your current marketing analytics capabilities or at what stage of marketing maturity you are. Analyze the tools you're using, the data you're collecting, and the insights you're generating. This step helps to identify any gaps in your data collection and analysis and provides a clearer picture of your strengths and areas for improvement.
2. Set goals aligned with business objectives
Whether it's improving customer retention, increasing conversion rates, or boosting brand awareness, make sure your analytics objectives align with broader business goals. This alignment ensures that the insights you generate have a direct impact on your organization's bottom line.
Here are some examples of how this alignment could look in practice:
- Business objective: Increase revenue. If your business is looking to boost revenue, one relevant marketing goal could be improving conversion rates. With marketing analytics, you can perform A/B testing on different elements of your marketing funnels to identify what works best for your audience. This data-driven approach can help optimize your marketing tactics and ultimately increase conversions, leading to higher revenue.
- Business objective: Expand into new markets. Suppose your business is looking to expand into new markets. In that case, a marketing goal could be to understand these new audience segments better. Marketing analytics can provide invaluable insights into the demographics, behaviors, and preferences of these target audiences, informing your market entry strategy and messaging.
3. Select the right tools
After setting your objectives, find marketing analytics tools that will best help you achieve them. Consider the scalability of these tools and how well they integrate with your existing systems. It's also critical to consider the ease of use and the level of support provided by the tool vendors.
After setting your objectives, consider the tools that will best help you achieve them. Here's a framework to guide your selection process:
- Understand your organization's unique needs and objectives. What type of data do you need to gather? Do you need real-time insights, predictive analytics, or social media tracking? Having a clear picture of your objectives helps you narrow down the list of potential tools.
- Evaluate the features of each tool to see if they align with your needs. Features to consider might include data visualization capabilities, integration with existing systems, predictive analytics, real-time data processing, and scalability.
- Consider the ease of use. Your team will be more likely to adopt a tool that is user-friendly and intuitive. A tool that requires minimal training can save time and resources.
- Ensure the tool can seamlessly integrate with your existing stack. Integration capabilities are crucial as they allow for a unified view of data across various platforms, making data analysis more efficient and accurate.
- Assess the quality of vendor support. You'll want to partner with a vendor that offers robust support, especially during the initial implementation phase.
- Review pricing and ROI the software brings. While pricing should not be the only determinant, it's essential to ensure the tool provides a good return on investment. Calculate potential gains from the insights you'll derive and the time you'll save, against the total cost of ownership, which includes licensing fees, training, implementation, and maintenance costs.
4. Ensure Compliance and Privacy
As you collect and analyze data, it's imperative to prioritize data privacy and ensure compliance with regulations such as GDPR or HIPAA. Implement robust data security measures and maintain transparency with customers about how their data is being used.
5. Monitor and Refine Your Strategy
A marketing analytics implementation strategy is not a one-time event but an ongoing process. Regularly review your analytics outcomes and adjust your strategy as needed to stay aligned with changing business goals or market conditions.
What Are Best Practices for Marketing Analytics?
Implementing marketing analytics at enterprise scale is less about deploying a stack of tools and more about engineering a high-precision decision system.
These best practices will help ensure analytics drives measurable revenue impact and becomes a core strategic capability, not just a reporting function.
Do’s
- Align metrics with business objectives: Define KPIs that directly reflect revenue impact, profitability, or customer lifetime value. Avoid tracking vanity metrics that don’t inform strategic decisions.
- Establish a single source of truth: Centralize data from all marketing and sales channels into one governed dataset. This prevents conflicting reports across teams and ensures stakeholders are acting on the same numbers.
- Automate data pipelines: Minimize manual data handling by implementing automated integrations and ETL processes. This enhances data freshness, reduces errors, and frees analysts to focus on higher-value tasks.
- Adopt a consistent data taxonomy: Use standardized naming conventions, campaign structures, and tagging protocols across platforms. This makes multi-channel analysis faster and more accurate.
- Incorporate advanced analytics methods: Move beyond descriptive metrics into attribution modeling, predictive forecasting, and cohort analysis. These methods provide forward-looking insight, not just historical reporting.
- Close the loop between insight and action: Build workflows that trigger immediate adjustments in targeting, spend allocation, or creative strategy, ensuring analytics drive performance changes directly.
Don’ts
- Don’t let data silos persist: Isolated datasets create blind spots and undermine attribution accuracy. Break down silos between marketing, sales, and finance systems.
- Don’t overload dashboards: A cluttered dashboard obscures priority insights. Focus on actionable KPIs, and provide drill-downs for deeper exploration when needed.
- Don’t neglect data quality monitoring: Outdated, incomplete, or misattributed data leads to poor decisions. Implement continuous data validation and anomaly detection.
- Don’t treat reporting as the end goal: Simply delivering metrics is not enough. Analytics must inform decision-making and lead to measurable business outcomes.
- Don’t ignore change management: New analytics processes and tools require training, adoption planning, and executive sponsorship to become embedded in day-to-day operations.
Challenges of Building Marketing Analysis Processes
While marketing analytics is a fantastic thing to utilize in your company, getting things up and running often means you'll have to overcome certain obstacles. If you’re not aware of these challenges ahead of time, you will likely experience poor results when implementing this concept in your organization.
Data silos
One of the most common challenges companies face is siloed data. Data silos exist when departments independently collect and analyze data, leading to duplicate, incomplete, and inconsistent data. In fact, 46% of businesses state that data silos are their biggest problem when handling customer data.
Data silos can occur when departments use incompatible data management systems. They can also occur if a business grows quickly, causing different departments to set up data management practices on the fly, with no thought being put into how this data can be shared across the organization.
Because data silos can produce incomplete data sets, leading to poor decisions when planning marketing activities. They can also lead to increased costs, as managing all this data across different databases can contribute to inefficient IT spending.
Low-quality data
Your attempts to set up marketing analytics will count for very little if everything is based on low-quality data.
One of the most common causes of poor data quality is the use of UTM tags in internal links or complete neglect of UTM tags. UTM parameters are essential for tracking the effectiveness of your campaigns, but using UTMs on internal links can overwrite the original source of traffic in analytics reports, leading to inaccuracies.
Another thing to be aware of is event and transaction setup. If events or transactions are set up incorrectly, you may miss out on critical data or get misleading information. Before rolling out a new event or transaction tracking, always test it thoroughly to ensure it works as expected.
Lastly, page redirects can cause issues with channel attribution, making it hard to accurately assess the performance of different marketing channels.
Solution: By being proactive and implementing these corrective measures, you can significantly enhance the accuracy and reliability of your data. Here're a couple of things you can do to address the three major causes of poor data quality:
- Develop a UTM naming convention for your organization to maintain consistency across all campaigns and train your team on the correct use of UTM parameters. Always use UTM parameters on external links only.
- Regularly audit your event and transaction tracking setup to ensure it's capturing data accurately and aligns with your current business objectives.
- Where possible, avoid using redirects. If they are necessary, ensure they are implemented correctly to preserve the tracking parameters.
- Encourage the use of direct links to your pages in your marketing activities.
Lack of expertise
Often, in large enterprise companies, marketers might be adept at understanding market trends and consumer behaviors but may lack the technical know-how to navigate advanced analytics tools and methodologies. This skill gap can result in missed opportunities for optimization and innovation.
Privacy concerns and regulatory compliance
Whether you're handling personal identifiable information (PII), credit card data, or health records, it's vital to adhere to the laws and regulations governing data privacy and security in your industry and region. Any data used in segmentation, targeting, personalization, or other marketing analytics practices must respect individual privacy rights and comply with relevant regulations.
Any tools or platforms you employ for marketing analytics must also align with the compliance requirements of your industry. This means they should offer robust data protection capabilities and ensure that any data they process or store is handled in accordance with the law.
Streamline Marketing Analytics with Improvado
Navigating through the complexities of marketing analytics reveals its pivotal role in driving strategic decision-making and enhancing ROI. Understanding marketing analytics is only the first step.
The subsequent steps are finding and implementing marketing analytics software that will guide your organization from being overwhelmed by data to harnessing it for competitive advantage.
A chosen analytics solution should not merely manage data, but transform it into actionable insights, fostering informed strategies. Improvado is an advanced marketing analytics software solution that acts as an analytics partner supporting your marketing team at every stage of the process.
Improvado aggregates data from 1,000+ marketing and sales platforms. The intelligent data transformation software then cleans and transforms it before pushing analysis-ready data to any destination for further analysis and visualization. The automated approach saves marketing departments 80-100 hours per week and an average of 30% of marketing resources.
The support your marketing team gets doesn't stop there, the Improvado team also provides Professional Services for companies with unique and complex data inquiries, a marketing attribution solution, data warehouse management services, and cover many other aspects of a successful marketing analytics strategy.
Related reading: Advertising Analytics Guide: Metrics & Attribution (2026), Agency Analytics vs TapClicks 2026: Which Tool Wins?, Ahrefs Analytics Guide for Marketing Data Analysts 2026, AppsFlyer Analytics Guide: Setup & Best Practices 2026, Ashby Analytics Guide: Recruiting Data & Reporting 2026, BigCommerce Analytics Guide: Setup, Tracking & Reporting, Braintree Analytics Guide for Data Analysts | 2026, Braze Analytics Guide: Reports, Metrics & Setup (2026)