Marketing teams generate more data than ever, but the real advantage comes from how clearly that data can be explored, communicated, and acted on. Visual analytics tools like Looker and Tableau help teams move from raw metrics to shared understanding. They make it possible to analyze performance at scale, drill into patterns, and align stakeholders around what needs to happen next.
Both platforms fall under the broader category of business intelligence, but they take very different approaches to modeling, exploration, and dashboard delivery. Those differences matter.
This article breaks down Looker vs. Tableau across core dimensions such as data modeling, visualization flexibility, governance, and ease of use. By the end, you’ll have a clear view of how each tool fits into a modern analytics stack and which option aligns best with your business goals.
Key Takeaways:
- Core philosophy: Looker prioritizes data governance with a centralized, code-based modeling layer (LookML). Tableau focuses on user empowerment with flexible, drag-and-drop self-service analytics.
- Ideal user: Looker is built for data teams and developers who need to create reliable, governed data experiences. Tableau is designed for business users and analysts who need to explore data and create visualizations quickly.
- Data handling: Looker queries data directly in your database in real-time. Tableau often uses extracts (in-memory data) for faster performance, though live connections are possible.
- Deployment: Looker is a fully cloud-based platform. Tableau offers more flexibility with cloud, on-premise, and desktop versions.
- Final decision: Your choice depends on your company's data strategy. Do you need strict, centralized control (Looker) or widespread, flexible data exploration (Tableau)?
Looker vs. Tableau: At a Glance Comparison
Before we dive deep, let's start with a high-level overview. This table summarizes the key characteristics of each platform, helping you quickly identify their primary strengths and differences.
| Looker | Tableau | |
|---|---|---|
| Number of supported data sources | 800+ | 100+ |
| Native support | Google products | Salesforce products |
| Data prep | Pre-built data models for common analytics patterns | Supports basic data manipulation, depends on external data preparation tools |
| Native languages | LookML, a unique modeling language for defining and organizing data. LookML is independent of particular SQL dialects | VizQL, a data querying and visualization language to translates users' drag-and-drop actions into data queries |
| Visualization types | A broad range of visualization types, inc. standard, complex, interactive elements | A broad range of visualization types, inc. standard, complex, interactive |
| Customization | Supports interactive, dynamic reports with customizable color schemes, layouts, and embedded elements like logos | Interactive dashboards with customizable elements, data animations, filters, and tooltips for enhanced interaction |
| Embedded analytics | Yes | Yes |
| AI and Machine Learning | A tool to query data in natural language, AI-augmented analytics tools | AI-driven feature features to query and interpret data |
| Real-time data processing | Capable of real-time data processing with automatic dashboard and report updates | Handles real-time data, but may face complexities in setup and maintenance for real-time data streams |
| Version control and collaboration | Git-versioned semantic layer for version control | Provides version control and audit trails |
| Learning curve | Has a steep learning curve | User-friendly interface but requires time to master advanced features |
| Alerting system | 3 types of alerts on user-defined and LookML dashboards | Custom alerts on specific data conditions |
| Pricing Model | Custom pricing (typically higher); based on users, compute usage, and deployment scale | Tiered pricing (Viewer, Explorer, Creator); more transparent and flexible for different team sizes |
| Best For | Data teams and organizations already using Google Cloud; strong governance and modeling control | Business teams needing rich visualization, fast insights, and flexibility in deployment |
| Not Ideal For | Teams without technical expertise or those needing quick ad hoc exploration | Centralized governance or semantic modeling across multiple teams and sources |
Here's a general guide on which type of company might benefit most from each tool.
What Is Looker?
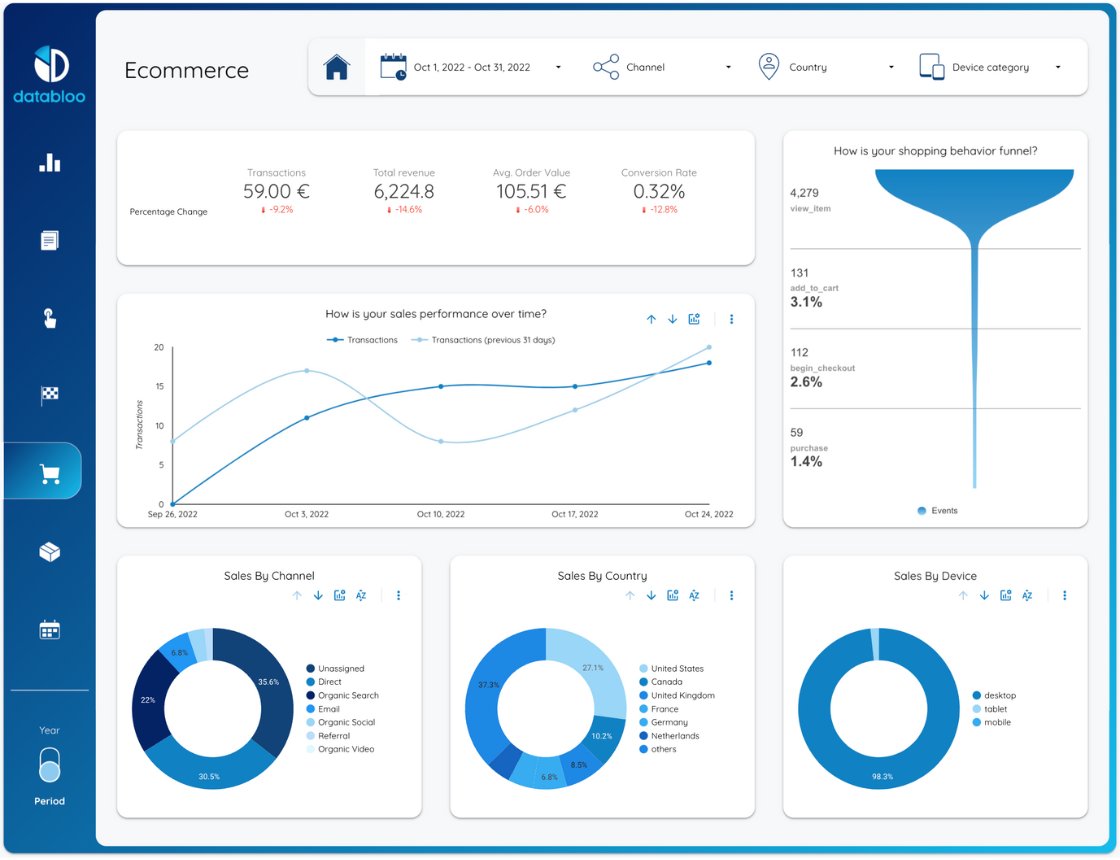
Looker, now part of the Google Cloud Platform, is a modern BI and data analytics platform. It operates differently from traditional BI tools. Instead of extracting data, Looker connects directly to your SQL database or data warehouse. It uses a proprietary data modeling language called LookML to define business logic centrally.
This "semantic layer" acts as a single source of truth for the entire organization. Data teams define metrics, dimensions, and relationships once in LookML. Then, business users can explore this curated data without writing SQL. This approach ensures consistency and governance across all reports and dashboards.
Key Features of Looker
- LookML modeling layer: The heart of Looker. It's a powerful, Git-integrated layer for defining all your business metrics and logic in one place.
- In-database architecture: Looker leverages the power of your existing database (like BigQuery, Snowflake, or Redshift) for queries, ensuring real-time data access.
- Embedded analytics: Strong capabilities for embedding dashboards and data experiences directly into other applications and websites.
- Modern API: Offers extensive API access, allowing for deep integration and the creation of custom data applications.
- Looker blocks: Pre-built pieces of code for common data sources and analytical patterns that accelerate development.
Looker Pros
- Real-time data and automatic refresh: Looker Studio allows for real-time data processing. This means the dashboards and reports update as new data comes in, providing the most current insights for decision-making.
- Embeddable reports: Looker Studio enables the embedding of reports into websites and applications, which is particularly useful for sharing insights externally or integrating BI into customer-facing platforms.
- Version control: Looker utilizes a git-versioned semantic layer, where components like tables, columns, and aggregations are organized in LookML files. This version control system is crucial for collaboration, as it allows multiple developers to work on updates and merge changes while being aware of any conflicts. It also enables rolling back changes to queries or dashboards when needed.
- Automated testing and CI/CD: Tools like Spectacles integrate with Looker to offer automated testing and continuous integration capabilities. This includes validating LookML, catching SQL and content errors before they hit production, and ensuring that Looker dashboards run smoothly. This integration is essential for maintaining data quality and reliability in dynamic and fast-paced development environments.
Looker Cons
- Learning curve: Looker's advanced features require a good understanding of data modeling and SQL. This can pose a challenge for individuals or organizations without technical expertise or a dedicated data team.
- Problems handling large datasets: Users often report that Looker can slow down when processing large data sets. This can be attributed to the way Looker handles data querying and visualization. Anyway, it can be a big issue when working on comprehensive or time-sensitive reports.
- Manual operations in data exploration: In Looker, every change in data visualization configuration requires manually clicking the "Run" button to generate a new SQL query. This might be cumbersome compared to other BI tools that provide instant feedback without needing to rerun a query.
- Scalability challenges: Looker's integration mainly within the Google Cloud Platform ecosystem can pose challenges in interoperability with systems outside of GCP. This limitation might affect organizations that rely on a diverse set of data sources and platforms outside Google's ecosystem.
- Complex pricing scheme: Many users mention Looker pricing structure, which can be a challenge for some businesses to navigate. The pricing often varies based on several factors like the number of users, the volume of data processed, and the level of customization and support required. This complexity can make it difficult for potential users to estimate costs upfront, potentially leading to unexpected expenses as needs evolve.
What Is Tableau?
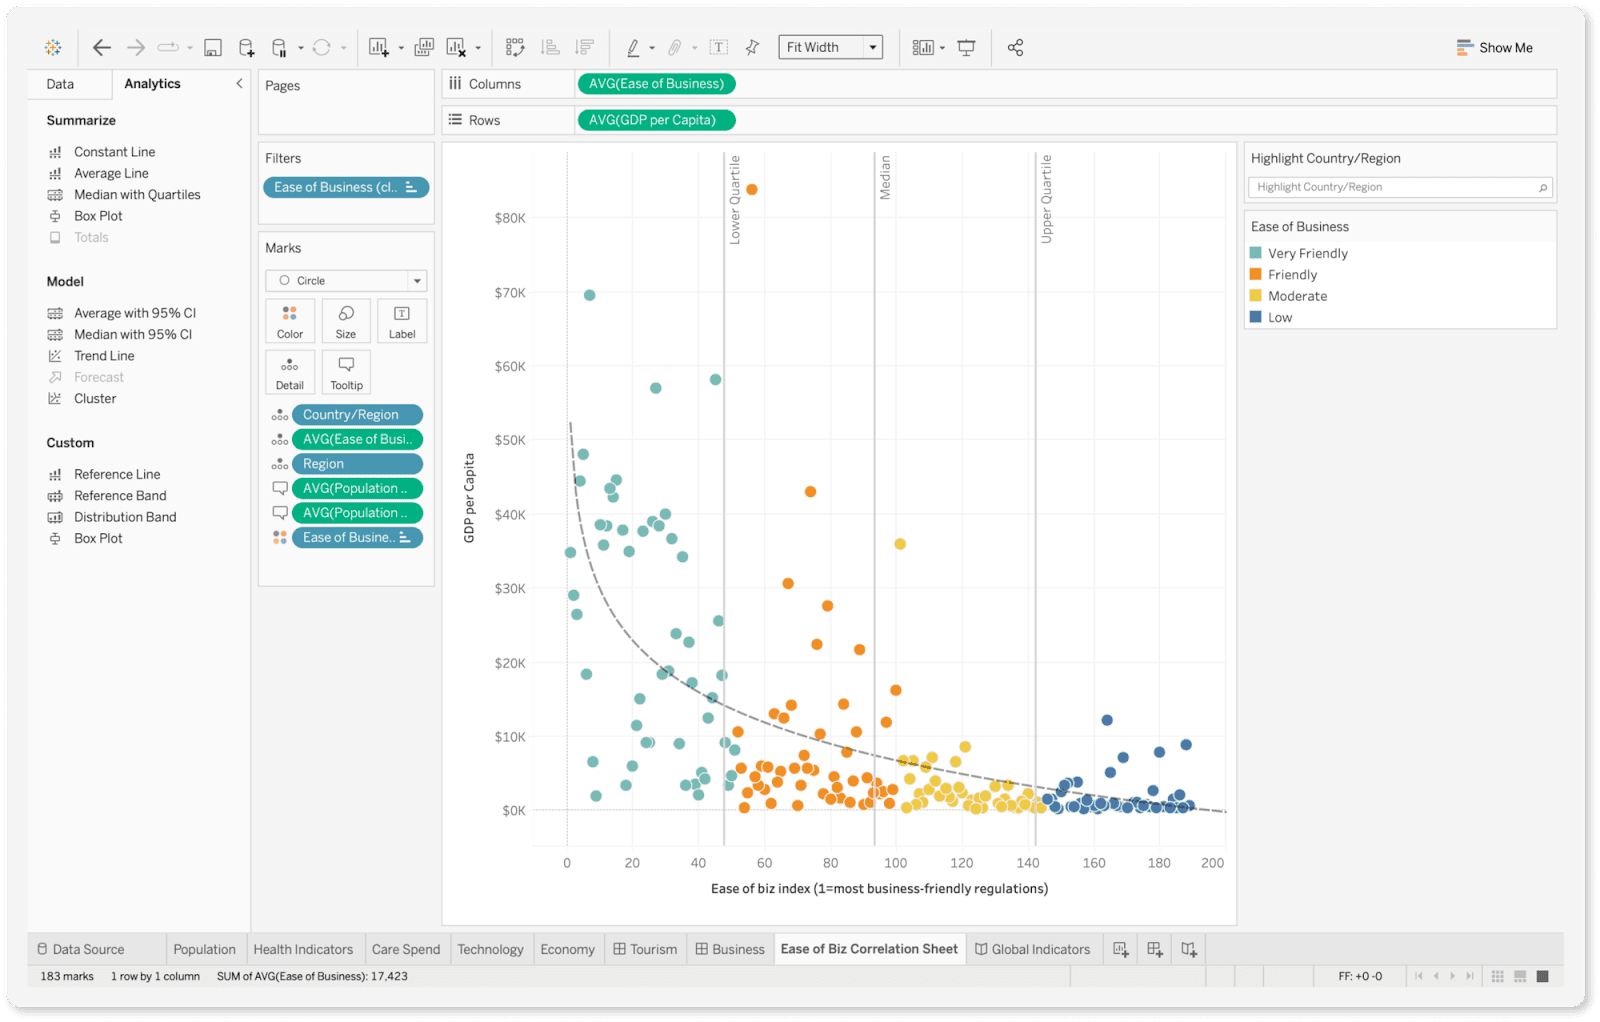
Tableau is a market-leading BI tool renowned for its powerful and intuitive data visualization capabilities. Acquired by Salesforce, it empowers users of all technical skill levels to connect to data and create interactive, shareable dashboards. Its drag-and-drop interface, known as VizQL, translates user actions into database queries automatically.
Tableau's strength lies in its flexibility and speed to insight. Users can connect to hundreds of data sources, from simple spreadsheets to complex data warehouses. They can then visually explore data, identify trends, and share their findings without extensive help from IT. This makes it a favorite for business departments that need agile, self-service reporting.
Key Features of Tableau
- Drag-and-drop interface: Its intuitive VizQL engine makes it easy for anyone to build complex charts and dashboards without writing code.
- Broad data connectivity: Connects to a vast range of data sources, including files, servers, and cloud platforms.
- Powerful data extracts: Tableau's Hyper engine can create highly optimized data extracts for lightning-fast performance, even with massive datasets.
- Interactive dashboards: Users can build rich, interactive reports with filters, tooltips, and drill-down capabilities.
- Strong community: A massive and active user community provides extensive resources, tutorials, and shared knowledge through Tableau Public.
Tableau Pros
- Version control and audit trails: Similar to Looker, Tableau offers version control capabilities, allowing teams to track changes, revert to previous versions of visualizations, and maintain a clear audit trail of data and report modifications. This feature is crucial for maintaining data integrity and accountability in analytics workflows.
- Sophisticated data alerts: Tableau allows users to set custom notifications based on specific data conditions. This feature is particularly useful for monitoring key metrics and being promptly informed of critical changes.
- Extensive custom SQL support: For users with specific data query needs, Tableau’s support for custom SQL queries is a significant advantage. This allows for more complex data manipulation and extraction, catering to advanced analytical needs.
Tableau Cons
- Dependence on external data preparation tools: While Tableau offers some capabilities for basic data manipulation, its functionality is primarily geared towards analyzing data that is already properly structured, formatted, and cleaned.
- Challenges with real-time data: Although Tableau can handle real-time data, setting up and maintaining these real-time data streams can be complex and resource-intensive. This might be a limiting factor for marketing analysts needing up-to-the-minute data for timely decisions.
- Licensing and user management: Managing licenses and user permissions in Tableau, especially in larger organizations, can be cumbersome. The administrative overhead associated with user management and access control can be a challenge for IT departments.
- No native marketing-specific models: Tableau lacks built-in, marketing-specific analytical models, which can be a setback for marketing analysts who often rely on industry-specific metrics and models for their analyses. This means they might have to build these models from scratch, which can be time-consuming and require a deep understanding of both marketing dynamics and data analysis.
Core Feature Showdown: Data Modeling & Governance
The approach to data modeling is the most significant difference between Looker and Tableau. It defines how your organization manages data quality, consistency, and access. Understanding this distinction is crucial for choosing the right tool.
Looker's Centralized Governance with LookML
Looker's philosophy is "define it once, use it everywhere." It enforces governance from the ground up using its LookML semantic layer. Here’s how it works:
- Define Logic in Code: Data teams use LookML (a language similar to SQL) to define all dimensions, measures, calculations, and joins. This code lives in a central repository.
- Version Control: Because LookML is code, it integrates with Git. This allows for version control, collaboration, and a full audit trail of changes to your business logic.
- Reusable Components: Once a metric like "Customer Lifetime Value" is defined in LookML, it is available to all users. Everyone uses the exact same calculation, eliminating discrepancies.
- Governed Exploration: Business users explore data within the governed framework set by the data team. They can't create their own ad-hoc calculations that might contradict the official logic.
This approach is ideal for large organizations that require strict data governance. It ensures that when someone looks at revenue, it means the same thing in every department. This is also where complex logic, like multi-touch attribution models, can be standardized for the entire company.
Tableau's Flexible, Ad-Hoc Modeling
Tableau takes a more decentralized approach. Data modeling is typically done by the individual analyst or business user within their own workbook. Key aspects include:
- Data Source Pane: Users connect to data and can create joins, unions, and relationships directly in the Tableau Desktop interface.
- Calculated Fields: Users can create custom calculations for their specific analyses. This offers immense flexibility for ad-hoc exploration.
- Lack of Central Control: The downside is the risk of inconsistency. Two analysts could create a "Revenue" calculation with slightly different logic, leading to conflicting reports.
- Tableau Prep & Data Model: To address this, Tableau offers Tableau Prep for data cleaning and shaping. The Tableau Data Model feature also allows for the creation of reusable data sources, but it is less robust and not as centrally enforced as LookML.
Tableau's model excels at speed and agility. It empowers users to answer their own questions without waiting for a data team. However, it requires careful management to prevent a "wild west" of conflicting metrics.
Data Integration & Connectivity: Connecting Your Data Universe
Both platforms offer robust options for connecting to your data, but their native strengths reflect their parent companies. A BI tool is useless if it can't access your data, making this a critical comparison point.
Looker's Strengths in the Google Ecosystem
Looker boasts over 800 data source connectors. Its architecture is designed to work seamlessly with modern cloud data warehouses. Its deepest integrations are within the Google Cloud family.
- Native Google Cloud Integration: Looker connects flawlessly with Google BigQuery, Google Analytics, and Google Ads. This makes it a natural choice for companies heavily invested in the Google ecosystem.
- SQL Dialect Support: It supports over 50 SQL dialects, allowing it to work with nearly any modern database like Snowflake, Amazon Redshift, and Azure Synapse.
- Focus on Databases: Looker's primary strength is connecting to structured data in SQL databases. It is less focused on connecting to flat files like Excel or CSVs directly.
Looker's approach aligns with its in-database philosophy. It's built to leverage the power of your cloud data warehouse, not to act as a standalone data engine. For businesses aiming to build a centralized data warehouse, Looker is a powerful partner.
Tableau's Broad Connectivity and Salesforce Synergy
Tableau is famous for its "connect to anything" reputation. It supports a vast array of connectors, from enterprise databases to simple text files.
- Extensive Connector Library: Tableau offers over 100 native connectors, including SQL databases, cloud applications, and file types like Excel, JSON, and PDF.
- Salesforce Integration: As a Salesforce product, Tableau has deep, native integrations with the Salesforce platform. This allows for seamless visualization of CRM and sales data.
- Web Data Connector: Allows users to build connections to web-based data sources that don't have a standard connector.
Tableau’s versatility makes it suitable for organizations with diverse and fragmented data environments. It can easily pull data from an old on-premise SQL server, a Google Sheet, and a Salesforce report into a single dashboard.
Data Visualization & Reporting Capabilities
For years, Tableau has set the standard for beautiful, interactive data visualizations. However, Looker (especially the unified Looker Studio) has made significant strides and offers a robust set of visualization options.
Tableau's Unmatched Visual Flexibility
Tableau offers near-limitless possibilities for visual design. Its drag-and-drop canvas allows users to create stunning and highly customized visuals.
- Vast Chart Library: From basic bar charts to complex Sankey diagrams, heatmaps, and geospatial maps, Tableau can build almost any visualization imaginable.
- Granular Formatting: Users have complete control over colors, fonts, labels, tooltips, and layout. This allows for pixel-perfect, brand-aligned dashboards.
- Interactive Elements: Tableau excels at creating interactive experiences. Features like dashboard actions, filters, and parameters let users explore data dynamically. For example, clicking a region on a map can filter charts across the entire dashboard.
- Storytelling: The "Story" feature allows users to create a guided narrative through a series of visualizations, which is excellent for presentations.
Looker's Focus on Governed, Actionable Dashboards
Looker's visualization capabilities are powerful and comprehensive, but they are designed to operate within its governed framework. The focus is less on artistic freedom and more on delivering clear, consistent, and reliable insights.
- Standard and Custom Visualizations: Looker provides a wide array of standard chart types. It also supports custom visualizations through its open-source visualization library or by integrating with third-party tools.
- Dynamic and Interactive: Looker dashboards are highly interactive. Users can drill down into data points, pivot dimensions, and apply filters, all while being protected by the underlying LookML model.
- Embedded Analytics Focus: Looker's visualization layer is built to be easily embedded. It's designed to bring data insights directly into the tools where people work.
- Looker Studio Integration: The integration with Looker Studio (formerly Google Data Studio) brings more of the flexible, drag-and-drop dashboarding experience to the Looker ecosystem.
A great example of applying these tools is in performance measurement. While Tableau might be used to create a highly custom dashboard for a specific campaign, Looker would be used to create a standardized dashboard that measures marketing ROI consistently across all campaigns.
Advanced Analytics & AI: The Battle for Smart Insights
Modern BI is no longer just about showing what happened. It's about explaining why it happened and predicting what will happen next. Both Looker and Tableau are investing heavily in AI and machine learning to provide deeper insights.
Tableau's User-Facing AI Features
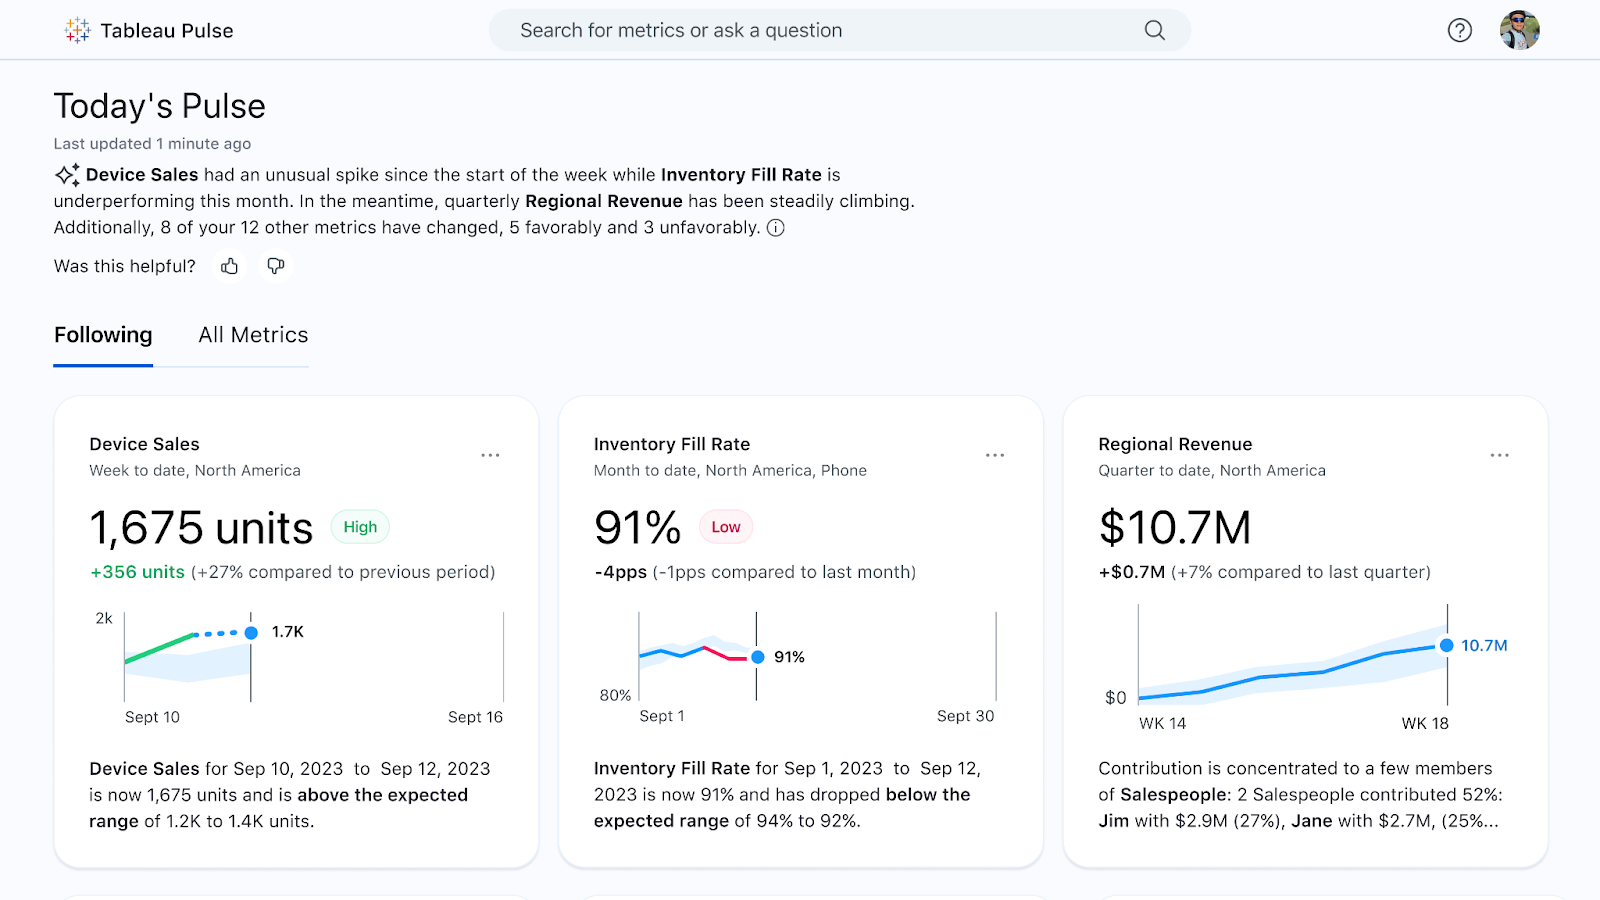
Tableau's AI is designed to be accessible to business users, helping them find insights without needing a data science background.
- Ask Data: A natural language query (NLQ) feature. Users can type a question like "what were the top 10 products by sales last quarter?" and Tableau will automatically generate a visualization.
- Explain Data: When a user sees an unexpected value in a chart (e.g., a sales spike), they can click on it and ask Tableau to "Explain Data." The tool uses AI to analyze the data and suggest potential explanations.
- Einstein Discovery: Integrated from Salesforce, Einstein Discovery provides AI-powered predictions and recommendations directly within Tableau dashboards. It can predict outcomes like customer churn and suggest actions to improve results.
Looker's Developer-Centric AI and Integration
Looker's AI capabilities are more integrated with the broader Google Cloud AI platform, targeting both business users and developers.
- Duet AI in Looker: This generative AI assistant allows for conversational analytics. Users can ask questions in natural language, and Duet AI can also help developers write LookML code, create calculations, and generate visualizations automatically.
- Integration with Vertex AI: Looker allows users to leverage powerful machine learning models built in Google's Vertex AI. This enables the visualization of predictive insights within Looker dashboards.
- BQML Integration: Through its tight connection with BigQuery, users can run BigQuery Machine Learning models directly from Looker, bringing predictive analytics into their BI workflow.
Both platforms are moving towards a future where AI automates much of the manual work in marketing analytics, freeing up time for strategic thinking.
Usability & Learning Curve: For Analysts vs. Business Users
The user experience and learning curve are often the deciding factors for departmental adoption. A powerful tool that no one can use is worthless.
Tableau: Low Floor, High Ceiling
Tableau is famously easy to get started with. A business user can download Tableau Desktop and create a meaningful visualization from an Excel file in under an hour. This low barrier to entry is a key reason for its popularity.
- Intuitive for Beginners: The drag-and-drop interface is visual and easy to understand.
- Steep Mastery Curve: While getting started is easy, mastering Tableau's advanced features, like Level of Detail (LOD) expressions, complex calculations, and performance optimization, requires significant time and practice.
Looker: Steeper Initial Climb
Looker has a steeper initial learning curve, particularly for those setting up the data model. Business users have an easier time once the model is built.
- Requires Technical Setup: Building the LookML model requires knowledge of SQL and the principles of data modeling. This work is typically done by a dedicated data team or BI developers.
- Easy for End-Users: Once the LookML model is in place, the "Explore" interface for business users is relatively straightforward. They can select dimensions and measures to build reports without needing to know the underlying code.
Deployment & Scalability: Cloud vs. On-Premise Flexibility
Where and how you deploy your BI tool can be constrained by security, compliance, or infrastructure requirements.
Looker is a cloud-native platform. It does not offer an on-premise version. It can be hosted on Google Cloud (natively), AWS, or Azure. This makes it a great fit for companies with a cloud-first strategy but a non-starter for those with strict on-premise requirements.
Tableau offers complete deployment flexibility. This is a major advantage for organizations with diverse needs.
- Tableau Desktop: The authoring tool that runs on a user's local machine.
- Tableau Server: An on-premise solution that gives organizations full control over their hardware and data.
- Tableau Cloud (formerly Tableau Online): A fully hosted cloud solution managed by Tableau. This flexibility allows companies to start in the cloud and move on-premise later, or support a hybrid environment.
For a deeper dive, consider exploring how Tableau compares to other tools in a Looker vs Tableau vs Power BI analysis.
Looker vs. Tableau Pricing: A Detailed Cost Breakdown
Pricing for enterprise BI tools can be complex. Both platforms have moved away from simple, public pricing toward custom quotes, but their models are fundamentally different.
Tableau's User-Based Pricing
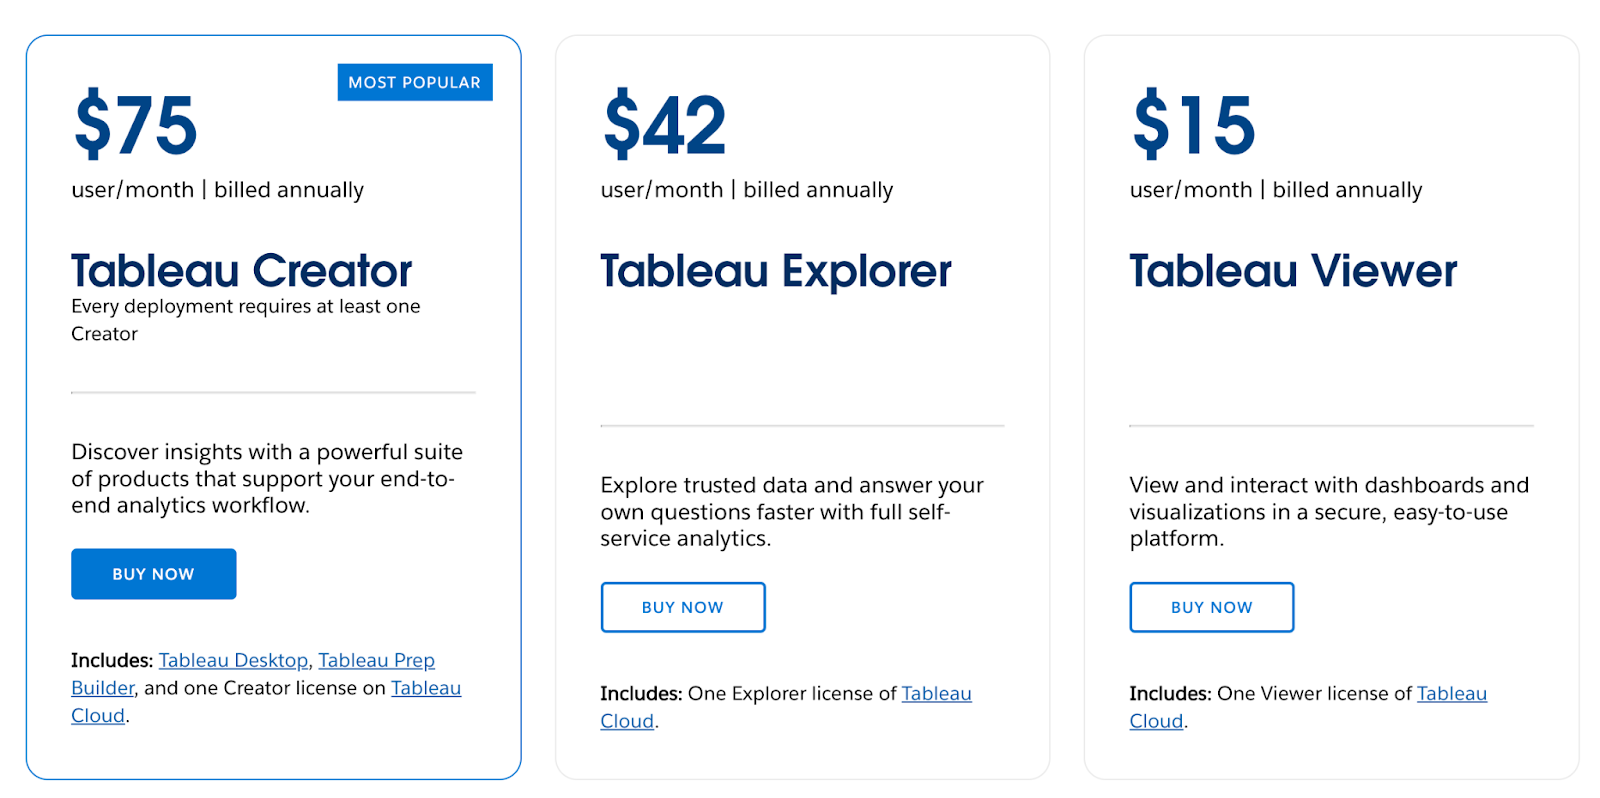
Tableau's pricing is more transparent and is based on user roles. This makes it easier to predict costs for teams of different sizes.
- Creator (~$75/user/month): These are power users who connect to data sources, prepare data, and build and publish dashboards. You need at least one Creator license to use Tableau.
- Explorer (~$42/user/month): These users can access published dashboards, explore the data within them, and create and save their own analyses from existing data sources.
- Viewer (~$15/user/month): These users can view and interact with published dashboards and workbooks but cannot create their own content.
This tiered model allows organizations to provide access to many people at a relatively low cost through Viewer licenses while equipping power users with Creator licenses.
Looker's Custom Platform Pricing

Looker's pricing is entirely custom and can be more opaque. It is generally considered a more expensive option, especially for smaller deployments. The price is based on a combination of factors:
- Platform Tiers: Looker offers different platform editions (Standard, Enterprise, Embed) that provide different levels of functionality and API access.
- User Licenses: Like Tableau, Looker has different license types for developers, standard users, and view-only users.
- Database Connections & Usage: The scale of your deployment and the number of database connections can also influence the final cost.
To get a price for Looker, you must contact their sales team. The total cost of ownership (TCO) is typically higher than Tableau's, reflecting its enterprise-grade governance and embedding features.
Choosing Your Winner: Use Cases & Ideal Company Profiles
So, which tool is right for you? The best choice depends entirely on your team's structure, data maturity, and business goals. There is no single "best" tool, only the best fit for your specific needs.
When to Choose Looker
Looker is the superior choice for organizations that prioritize:
- Centralized Data Governance: If you need every KPI to be consistent across every department, Looker's LookML layer is the industry standard.
- Embedded Analytics: If your goal is to embed data insights directly into your customer-facing product or internal applications, Looker's API-first design is ideal.
- A Strong, Central Data Team: Looker works best when a skilled data team can build and maintain the LookML model for the rest of the organization to use.
- Operating in the Google Cloud Ecosystem: If your data lives in BigQuery and you use other Google Cloud services, Looker will feel like a natural extension.
When to Choose Tableau
Tableau remains the champion for companies that value:
- Self-Service and Empowerment: If you want to enable business users in marketing, sales, and operations to answer their own questions with data, Tableau's intuitive interface is unmatched.
- Rapid, Ad-Hoc Visual Exploration: For teams that need to quickly connect to a new data source and explore it visually, Tableau provides the fastest path from data to insight.
- Deployment Flexibility: If you have on-premise requirements or need a hybrid cloud/on-prem solution, Tableau's options are a clear winner.
- Advanced, Creative Visualizations: For public-facing reports, executive presentations, and complex data storytelling, Tableau's visual engine provides more creative freedom. Many companies use it to build their primary marketing dashboards for this reason.
Looker vs. Tableau? Insightful Visualizations Start with Clear Data
While Looker, Tableau, and other data visualization tools are great at presenting information in an easy-to-digest way, it can still be a tedious challenge to gather all your data from various sources, prepare it, and send it all to your visualization or BI tool.
That's where tools like Improvado step in. The Improvado solution automatically aggregates data from 500+ data sources, applies data transformations to prepare the data for visualization, and pushes it to the tool of your choice. The platform provides a collection of pre-built recipes to properly prepare data for a particular marketing use case, for instance, to analyze paid ads, programmatic ads, or attribute sales revenue to a marketing activity.
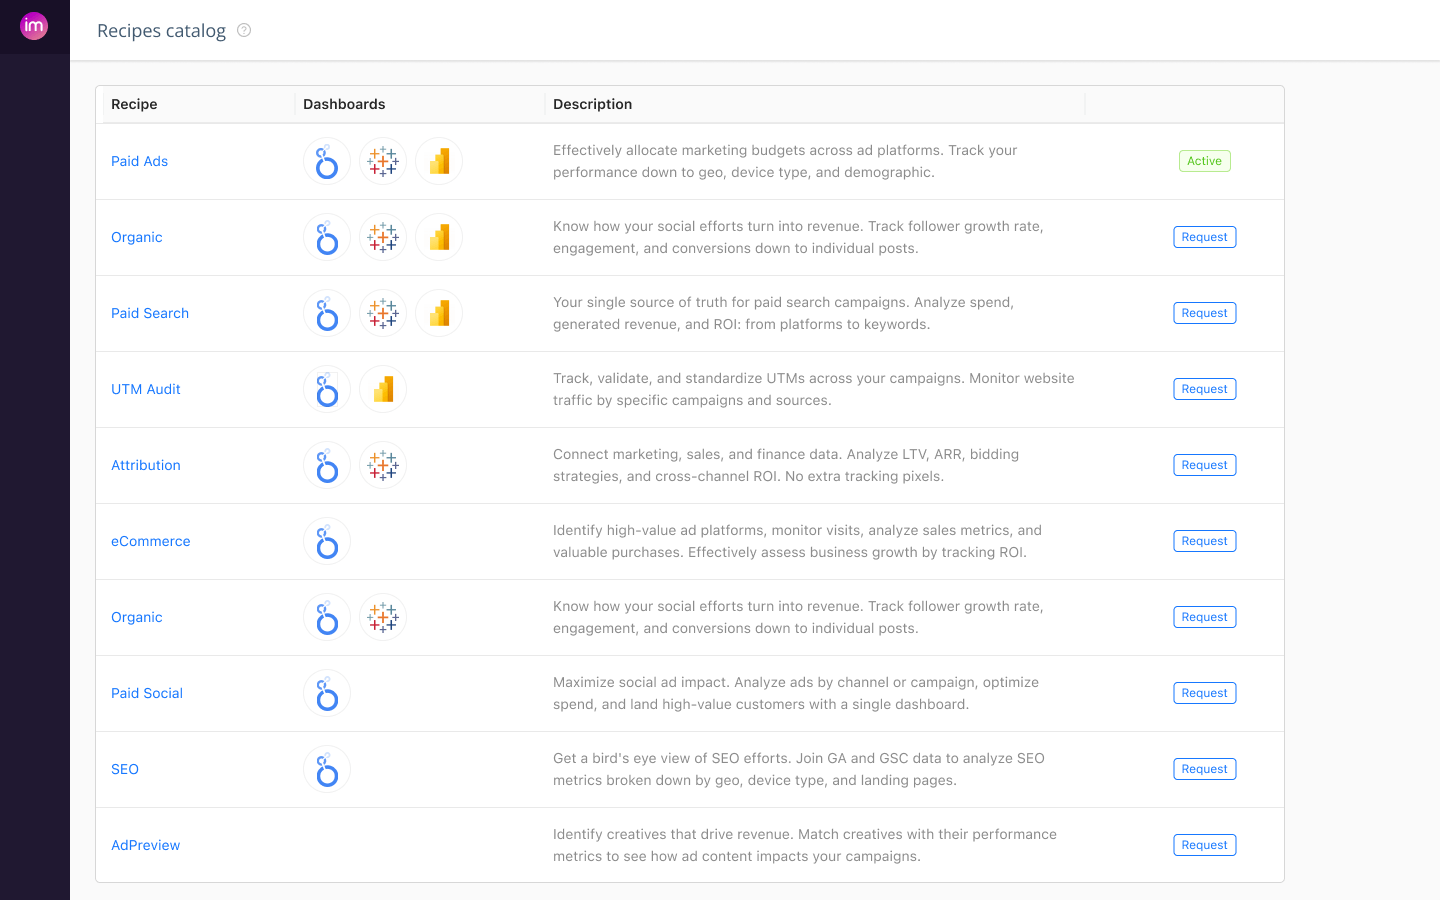
It significantly reduces the amount of manual work needed to start visualizing data and minimizes the likelihood of misleading visualization or errors with data harmonization and deduplication features.
Both Looker and Tableau are compatible with Improvado. This means you can rely on Improvado to automatically serve harmonized, high-quality data from your data sources to your preferred visualization and BI tools, allowing you to turn your data into beautiful, easy-to-interpret visualizations.
Get a demo to learn more about Improvado and how it can simplify your data visualization or go to the Data Transformation product page to learn more about its enterprise-grade transformation engine.
.png)

%20(1).png)


.png)
