Tracking the right KPIs is what separates reactive marketing teams from performance-driven organizations. Accurate, timely KPI tracking ensures that marketing investments translate into measurable business outcomes, not just activity.
This article explores how to build a KPI tracking framework that aligns marketing execution with strategic growth objectives. It covers how to define meaningful metrics, unify fragmented data sources, and implement systems that deliver real-time performance visibility across every channel.
Key Takeaways:
- KPI tracking is the systematic process of monitoring quantifiable measures of performance to gauge progress toward strategic business goals.
- Distinguishing between KPIs (strategic measures) and metrics (operational data points) is crucial for maintaining focus and avoiding data overload.
- Effective KPI tracking relies on a unified data strategy, often requiring automated platforms to consolidate information from disparate sources into a single source of truth.
- The process involves setting SMART goals, choosing relevant KPIs, establishing data collection methods, visualizing performance on dashboards, and conducting regular reviews to drive continuous improvement.
Quick answer
KPI tracking is the systematic process of monitoring, analyzing, and managing key performance indicators to assess the effectiveness of business operations against strategic objectives. It creates a feedback loop that transforms high-level business goals into actionable insights, providing quantifiable measures of performance across every facet of an organization from C-suite strategy to frontline execution.
What is KPI Tracking? The Foundation of Data-Driven Performance
KPI tracking is the systematic process of monitoring, analyzing, and managing key performance indicators to assess the effectiveness of business operations against strategic objectives. It creates a feedback loop that informs every facet of your organization, from C-suite strategy to frontline execution. This discipline provides a quantifiable measure of performance, transforming high-level business goals into actionable insights.
Defining Key Performance Indicators (KPIs)
A Key Performance Indicator (KPI) is a measurable value that demonstrates how effectively a company is achieving key business objectives. Organizations use KPIs at multiple levels to evaluate their success at reaching targets. While high-level KPIs may focus on the overall performance of the enterprise, low-level KPIs may focus on processes in departments such as sales, marketing, HR, or support.
A true KPI must be:
- Key: It must be directly tied to a strategic business objective.
- Performance: It must measure performance and show progress over time.
- Indicator: It must indicate a trend or direction, allowing you to predict future outcomes.
The Systematic Process of KPI Monitoring and Analysis
KPI monitoring is the ongoing, often real-time, observation of your selected KPIs. This is the "what's happening now" part of the equation. Analysis, on the other hand, is the deeper dive into the "why."
An effective KPI tracking system seamlessly integrates both monitoring and analysis, providing dashboards for at-a-glance performance checks and the underlying data for in-depth investigation.
This continuous cycle ensures that you're not just observing performance but actively managing it.
KPI Tracking vs. KPI Reporting: Understanding the Synergy
While often used interchangeably, KPI tracking and reporting are distinct but complementary processes.
- KPI Tracking is the continuous, dynamic process of monitoring performance data as it comes in. It's an active, internal function focused on operational agility and immediate adjustments.
- KPI Reporting is the structured, periodic communication of performance over a specific timeframe (for example, weekly, monthly, quarterly). It synthesizes tracked data into a coherent narrative for stakeholders, often using visualizations to highlight trends, successes, and challenges.
Effective tracking provides the accurate, real-time data necessary for meaningful reporting. Together, they create a comprehensive performance management framework.
KPIs vs. Metrics: Clarifying the Critical Difference
This is one of the most common points of confusion. All KPIs are metrics, but not all metrics are KPIs. The distinction is crucial for maintaining strategic focus.
- Metrics are any quantifiable data points that measure an activity. For example, website page views, number of social media followers, or call duration are all metrics. They provide valuable operational data but may not directly reflect strategic success.
- KPIs are a select few metrics that are directly linked to your most important business objectives. For instance, while page views are a metric, 'Conversion Rate from Organic Traffic' would be a KPI if your strategic goal is to increase online sales.
Tracking too many metrics without identifying your true KPIs leads to "analysis paralysis." The goal of a strong KPI tracking framework is to elevate the most critical performance indicators above the noise.
Why Is KPI Tracking Non-Negotiable for Business Growth?
Implementing a robust KPI tracking system is more than a best practice; it's a strategic imperative for any organization aiming for sustainable growth. It provides the clarity, alignment, and data-driven foundation needed to navigate a complex market. Without it, businesses operate on assumptions, leading to wasted resources, missed opportunities, and strategic drift.
Fostering Accountability and a Performance-Driven Culture
When KPIs are clearly defined and consistently tracked, they create a culture of accountability. Every team and individual understands what they are responsible for and how their work contributes to the bigger picture.
This transparency eliminates ambiguity and motivates employees by linking their daily efforts to measurable outcomes. Success becomes objective, not subjective, fostering an environment where performance is recognized and rewarded based on tangible results.
Gaining Strategic Alignment Across Departments
In many companies, departments operate in silos, each pursuing its own goals. KPI tracking breaks down these walls. By cascading strategic objectives down into departmental and team-specific KPIs, it ensures everyone is pulling in the same direction.
The marketing team's KPI for 'Marketing Qualified Leads (MQLs)' directly supports the sales team's KPI for 'Sales Conversion Rate,' creating a unified and collaborative growth engine.
Identifying Performance Gaps and Opportunities in Real-Time
The business landscape changes rapidly. KPI tracking acts as an early warning system. A dip in a leading indicator like 'Website Engagement Rate' can signal a problem long before it impacts a lagging indicator like 'Quarterly Revenue.'
This real-time visibility allows leaders to proactively address issues, reallocate resources to high-performing channels, and capitalize on emerging opportunities before competitors do. This agility is a significant competitive advantage.
Enhancing Stakeholder Communication and Transparency
Whether you're reporting to a board of directors, investors, or company leadership, KPI reports provide a clear, concise, and objective view of business performance. They replace vague updates with hard data, building trust and confidence.
This data-backed communication ensures that strategic conversations are productive and focused on facts, leading to better, more informed decisions about the future direction of the company.
Driving Continuous Improvement and Innovation
The ultimate goal of KPI tracking is not just to measure, but to improve.
By analyzing historical KPI data, you can identify patterns, understand what works, and refine your strategies. This iterative process of 'measure, analyze, act, repeat' is the core of continuous improvement. It encourages experimentation and innovation because the impact of new initiatives can be clearly measured against established KPIs, allowing you to fail fast, learn quickly, and scale successes across the organization.
A Comprehensive Framework for Choosing the Right KPIs
Selecting the right KPIs is arguably the most critical step in the entire tracking process. The wrong KPIs can lead your team down a path of optimizing for vanity metrics while neglecting what truly drives the business forward. A structured approach ensures your chosen indicators are relevant, actionable, and aligned with your ultimate goals.
The SMART Criteria for KPI Selection
A widely adopted and effective framework for vetting potential KPIs is the SMART criteria. Every KPI you choose should be:
- Specific: Is the KPI clearly defined and unambiguous? "Increase sales" is not specific; "Increase Q3 enterprise software sales revenue by 15%" is.
- Measurable: Can you quantify the KPI? You must have a reliable way to collect the data needed to measure it.
- Achievable: Is the target for the KPI realistic given your resources and market conditions? Setting impossible goals can demotivate your team.
- Relevant: Does this KPI directly contribute to a key business objective? If improving this KPI doesn't move the needle on a strategic goal, it's not a "key" indicator.
- Time-bound: Does the KPI have a defined timeframe for achievement? A deadline creates urgency and a clear endpoint for evaluation.
Aligning KPIs with Strategic Business Objectives
KPIs should never be chosen in a vacuum. The process must start from the top down.
- Begin with your highest-level business objectives, such as "Become the market leader in our niche" or "Achieve profitability."
- Then, break these objectives down into more specific goals. For example, "Become the market leader" might break down into goals like "Increase market share by 10%" and "Improve brand recognition."
- Only then can you select KPIs that measure progress toward these specific goals, such as 'Share of Voice (SOV)' and 'Customer Acquisition Cost (CAC) vs. Competitors'.
Distinguishing Between Leading and Lagging Indicators
A balanced KPI strategy includes both leading and lagging indicators.
- Lagging Indicators measure past performance and are typically output-oriented. Examples include 'Monthly Recurring Revenue (MRR)' or 'Customer Churn Rate.' They tell you if you've achieved your goals but are hard to influence directly.
- Leading Indicators are input-oriented and predictive of future success. Examples include 'Number of Sales Demos Booked' or 'Website Traffic from high-intent keywords.' They are easier to influence and give you an early indication if you're on track to hit your lagging indicators.
A good dashboard tracks lagging indicators to see the results, but focuses heavily on leading indicators to manage future performance.
Understanding Quantitative vs. Qualitative KPIs
While most KPIs are numerical, qualitative data can also be transformed into measurable indicators.
- Quantitative KPIs are the most common type, measuring objective numerical data. Examples include 'Conversion Rate,' 'Revenue per Employee,' or 'Website Traffic.'
- Qualitative KPIs measure non-numerical characteristics and opinions. While subjective, they can be quantified through scales and surveys. A prime example is the Net Promoter Score (NPS), which measures customer loyalty on a scale of -100 to 100, or tracking 'Customer Satisfaction' scores (CSAT) from surveys.
Combining both types provides a more holistic view of performance.
Types of KPIs: A Categorical Breakdown for Every Business Function
KPIs are not one-size-fits-all. The most relevant indicators vary significantly based on the business function and strategic level they are intended to measure. Understanding these categories helps in selecting a balanced portfolio of KPIs that provide a comprehensive view of organizational health.
Strategic KPIs: The C-Suite View
These are high-level indicators that monitor the overall health and long-term goals of the organization. They are typically reviewed by senior leadership and the board to guide major strategic decisions.
- EBITDA (Earnings Before Interest, Taxes, Depreciation, and Amortization): A measure of overall company profitability.
- Revenue Growth Rate: The speed at which the company's income is increasing.
- Market Share: The company's sales as a percentage of total sales in the industry.
- Customer Lifetime Value (CLV): The total revenue a business can expect from a single customer account.
Operational KPIs: Measuring Day-to-Day Efficiency
These KPIs measure performance over a shorter timeframe and are focused on the efficiency of business processes. They are crucial for departmental managers to optimize workflows and resource allocation.
- Lead Time: The time taken from the start of a process to its conclusion (e.g., order fulfillment time).
- Employee Productivity Rate: Output per employee over a specific period.
- First Contact Resolution (FCR): Percentage of customer issues resolved on the first interaction.
- Cost per Unit: The total cost to produce one unit of a product or service.
Financial KPIs: Tracking Fiscal Health
These are the bottom-line indicators that every business must track to ensure solvency and profitability. They are the primary concern of the finance department and executive team.
- Gross Profit Margin: (Revenue - Cost of Goods Sold) / Revenue.
- Net Profit Margin: (Net Income / Revenue) * 100.
- Operating Cash Flow: Cash generated from normal business operations.
- Debt-to-Equity Ratio: A measure of a company's financial leverage.
Customer-Centric KPIs: The Voice of the Customer
These KPIs focus on measuring customer satisfaction, loyalty, and service quality. They are critical for any business that wants to build a sustainable, customer-focused brand.
- Net Promoter Score (NPS): Measures customer willingness to recommend a company's products or services.
- Customer Satisfaction Score (CSAT): Measures how satisfied customers are with a specific interaction or product.
- Customer Churn Rate: The percentage of customers who stop doing business with a company over a period.
- Average Resolution Time: The average time it takes to resolve a customer support ticket.
Marketing & Sales KPIs: Measuring Growth Engines
This category focuses on the performance of the revenue-generating functions of the business. They track the entire funnel, from awareness to conversion and retention.
- Customer Acquisition Cost (CAC): The cost associated with acquiring a new customer.
- Marketing Qualified Leads (MQLs) & Sales Qualified Leads (SQLs): Tracking the volume and quality of leads moving through the funnel.
- Lead-to-Customer Conversion Rate: The percentage of leads that become paying customers.
- Marketing ROI: The revenue generated from marketing activities compared to the cost. A crucial aspect of measuring the return on marketing investments involves sophisticated marketing ROI analysis to justify budgets and optimize spend.
The Step-by-Step Process for Implementing a KPI Tracking System
Following a clear roadmap ensures that your KPI tracking system is built on a solid foundation of strategic alignment and data integrity, making it a valuable asset rather than a complex burden.
Step 1: Define Your Strategic Goals
Before you track anything, you must know what you want to achieve. This step involves high-level discussions with leadership to clarify the 3-5 most critical business objectives for the coming period (e.g., quarter or year).
These objectives should be clear, concise, and universally understood across the organization.
Step 2: Select Your Key Performance Indicators
With your goals defined, identify the KPIs that will best measure progress toward them. Use the SMART criteria and ensure a balanced mix of leading/lagging and quantitative/qualitative indicators.
Involve department heads in this process to ensure the selected KPIs are relevant to their teams' daily operations.
Step 3: Set KPI Targets and Benchmarks
A KPI without a target is just a number. For each KPI, you need to set a specific, time-bound target (for example, "Increase customer retention rate from 85% to 90% by the end of Q4").
It's also helpful to establish benchmarks based on historical performance, industry standards, or competitor analysis to provide context for your targets.
Step 4: Establish Data Collection Processes
This is where the technical work begins. For each KPI, you must identify the source of the data (CRM, Google Analytics, finance software) and define the method for collecting it.
A reliable and automated marketing data pipeline is essential here to ensure data is accurate, consistent, and timely. Manual data collection is prone to errors and becomes unsustainable as the business scales.
Improvado simplifies and automates this entire process by connecting directly to all your marketing, sales, and revenue platforms, pulling, standardizing, and validating data automatically.
Improvado eliminates the manual steps of exporting and reconciling data across systems, ensuring every KPI is sourced, structured, and refreshed consistently.
With Improvado, you can:
- Automatically extract data from 1,000+ marketing, CRM, and analytics sources
- Unify and normalize KPIs across channels, teams, and campaigns
- Enforce consistent naming conventions and taxonomy structures
- Apply governance rules and data validation at every stage
- Deliver clean, warehouse-ready datasets to BigQuery, Snowflake, or Redshift
- Automate refresh schedules for real-time KPI visibility
- Use the AI Agent to query metrics in natural language and surface insights instantly
By building your KPI tracking on top of Improvado, you gain a solid data foundation for analytics—one that keeps your data accurate, your metrics aligned, and your reporting cycle fully automated.
Step 5: Choose Your KPI Tracking Tools
You need a platform to aggregate, store, and analyze your KPI data. As we'll discuss in the next section, options range from simple spreadsheets to sophisticated Business Intelligence (BI) tools and dedicated KPI software.
The right choice depends on your budget, complexity, and the need for real-time data integration and visualization.
Step 6: Visualize Data with KPI Dashboards
Raw data is difficult to interpret. The next step is to create visual KPI dashboards that present the information in an easily digestible format. Use charts, graphs, and color-coding to highlight trends, progress against targets, and areas needing attention. Tailor different dashboards for different audiences (for example, an executive overview vs. a detailed marketing campaign dashboard).
Step 7: Schedule Regular Review and Analysis Cadences
KPI tracking is not a "set it and forget it" activity. Schedule regular meetings (weekly, monthly, or quarterly) to review the dashboards, discuss performance, and decide on action plans. This cadence embeds KPI analysis into the operational rhythm of the company, transforming it from a reporting exercise into a strategic management tool.
KPI Tracking Tools: From Spreadsheets to Automated Analytics Platforms
The tool you choose for KPI tracking can have a significant impact on the efficiency, accuracy, and scalability of your performance management system. The landscape of options is vast, catering to different needs and levels of technical sophistication.
Manual Tracking with Spreadsheets (Excel, Google Sheets)
For small businesses or single projects, spreadsheets can be a viable starting point. They are accessible, flexible, and require no additional software investment.
However, they are prone to human error, require significant manual data entry, lack real-time capabilities, and become incredibly cumbersome and difficult to manage as data volume and complexity grow.
Business Intelligence (BI) Tools (Power BI, Tableau)
BI tools represent a major step up from spreadsheets. They are designed for data visualization and can connect to multiple data sources to create interactive dashboards. They offer powerful analytical capabilities, allowing users to slice and dice data to uncover insights.
However, they often require significant technical expertise to set up and maintain the data connections and can be costly.
Dedicated KPI Software
These are specialized platforms built specifically for KPI tracking and management. They often come with pre-built templates for different industries and departments, goal-setting features, and user-friendly interfaces designed for business users, not just data analysts. They simplify the process of creating and sharing KPI dashboards across the organization.
Automated Data Integration Platforms like Improvado
The biggest challenge for modern businesses is not a lack of data, but the fragmentation of that data across hundreds of different marketing, sales, and operational platforms.
Marketing analytics platforms like Improvado act as the central nervous system for your data, automatically collecting information from all your sources, cleaning and transforming it, and delivering it to any destination, be it a BI tool, a data warehouse, or AI.
This automates the most time-consuming part of KPI tracking, ensuring data accuracy and providing a truly unified view of performance.
"Improvado helped us gain full control over our marketing data globally. Previously, we couldn't get reports from different locations on time and in the same format, so it took days to standardize them. Today, we can finally build any report we want in minutes due to the vast number of data connectors and rich granularity provided by Improvado.
Now, we don't have to involve our technical team in the reporting part at all. Improvado saves about 90 hours per week and allows us to focus on data analysis rather than routine data aggregation, normalization, and formatting."

Comparison Table
| Aspect | Spreadsheets | Business Intelligence (BI) Tools | Automated Data Platforms (Improvado) |
|---|---|---|---|
| Data Collection | Manual entry, copy-paste | Connectors exist, but often require technical setup | Fully automated, pre-built connectors to 1,000+ sources |
| Real-Time Data | No | Possible, but can be complex to configure | Yes, data is refreshed automatically |
| Scalability | Low, becomes unwieldy quickly | High, but requires engineering resources | Very High, designed for large data volumes |
| Data Accuracy | Low, prone to human error | High, if data pipelines are built correctly | Very High, automated error handling and normalization |
| Setup Effort | Low | High, requires data expertise | Low, managed service and intuitive setup |
| Collaboration | Limited, version control issues | Good, dashboards can be shared | Excellent, centralized source of truth for all teams |
| Best For | Small teams, initial tracking | Companies with dedicated data/analytics teams | Growth-focused companies needing a scalable, unified view |
Mastering KPI Dashboards: How to Visualize Performance Effectively
A KPI tracking system is only as good as its ability to communicate insights clearly and drive action. This is the role of the KPI dashboard, a visual interface that consolidates and displays your key performance indicators in a single, easy-to-understand screen.
The Purpose of a KPI Dashboard
The primary purpose of a KPI dashboard is to provide an at-a-glance view of business performance against targets. It should answer your most important questions quickly, without requiring you to dig through spreadsheets or multiple reports. It serves to align teams, monitor health, identify problems, and celebrate successes in real-time.
Designing an Actionable Dashboard: Best Practices
Effective dashboard design follows several key principles:
- Keep it Simple: Focus only on the most critical KPIs. A cluttered dashboard is an ineffective one. Use whitespace to guide the eye and prevent cognitive overload.
- Use the Right Visualizations: Use line charts for trends over time, bar charts for comparisons, pie charts for composition (sparingly), and gauges or single numbers for progress against a target.
- Provide Context: Numbers in isolation are meaningless. Always include comparisons, to the previous period, to the target, or to a benchmark, to give the data context.
- Logical Layout: Place the most important, high-level KPIs at the top-left, as this is where users' eyes naturally go first. Group related KPIs together.
- Enable Drill-Downs: A good dashboard allows users to click on a high-level KPI to see the underlying data and explore the "why" behind the number.
Tailoring Dashboards for Different Audiences
Not everyone needs to see the same level of detail. Effective visualization requires creating different dashboards for different stakeholders:
- Executive Dashboards: High-level, strategic view focusing on long-term goals like revenue growth, profitability, and market share. Less detail, more summary.
- Managerial/Analytical Dashboards: More detailed view allowing for trend analysis and exploration. These dashboards help managers understand performance drivers and make tactical decisions.
- Operational Dashboards: Real-time view of day-to-day activities for frontline teams. These dashboards track metrics that change frequently, like call center volume or website uptime.
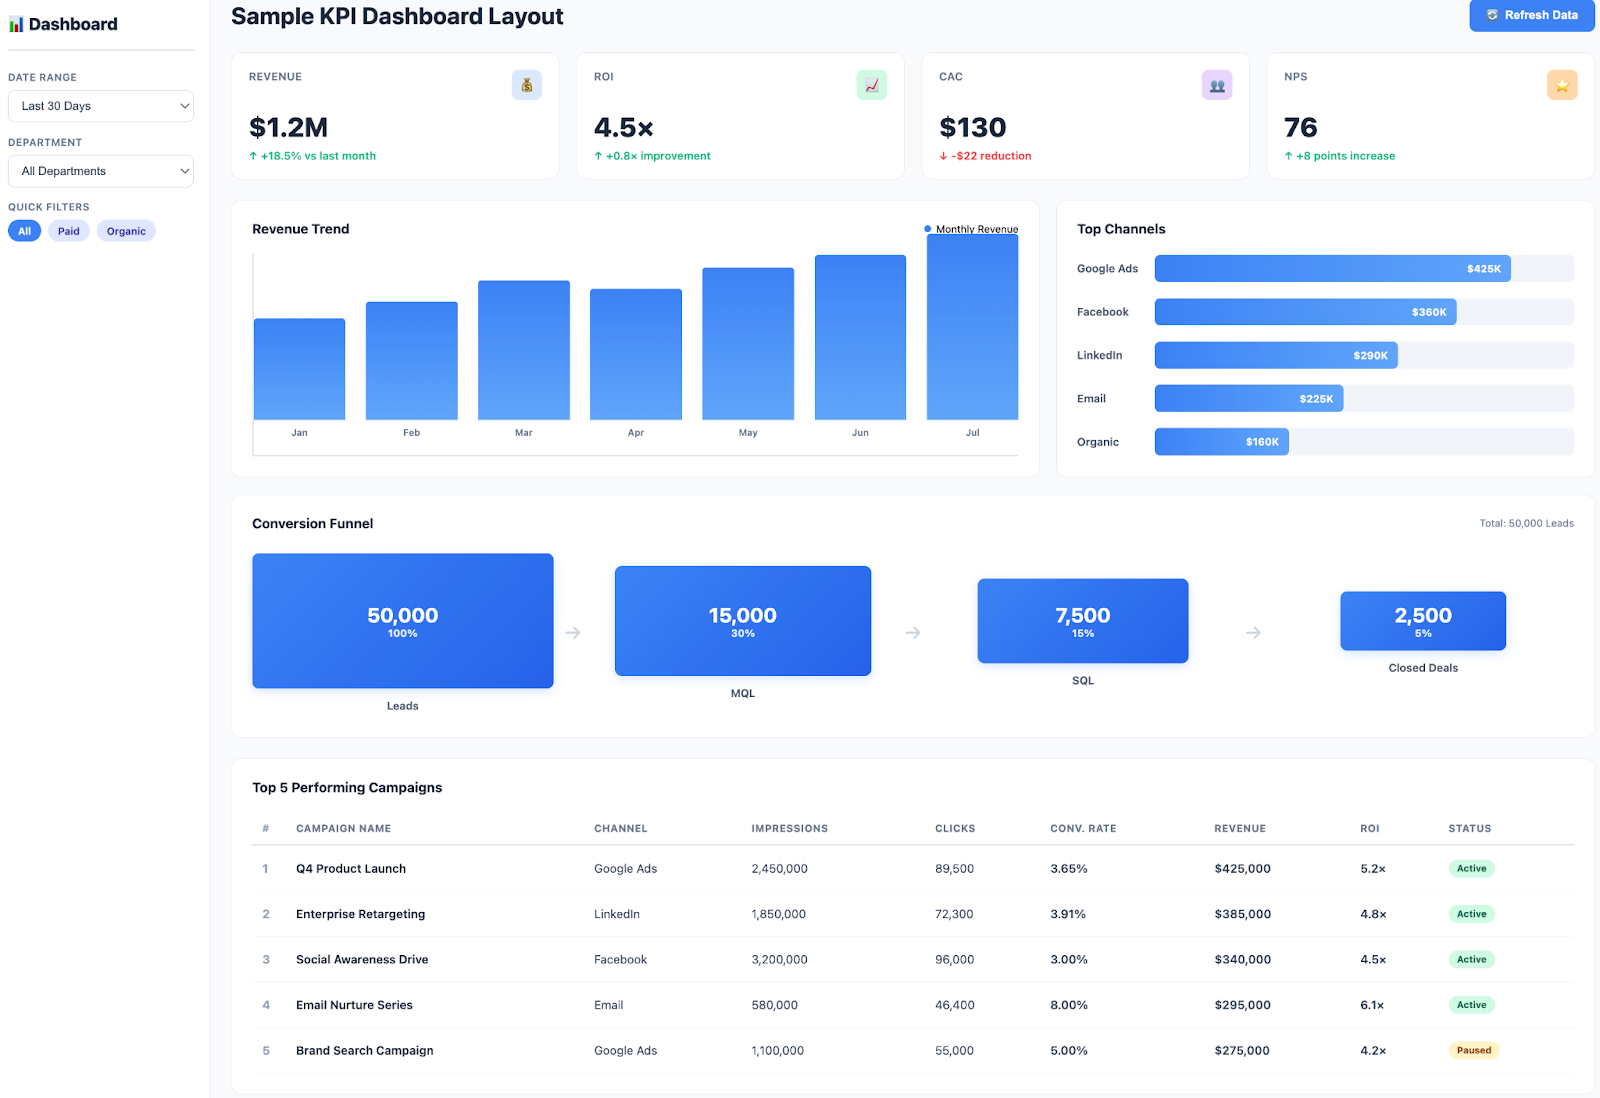
Creating tailored views ensures that each user gets the information most relevant to their role, making the data more actionable. For inspiration, exploring various KPI dashboard examples can provide valuable insights into effective layouts and visualizations for different business functions.
Best Practices for Effective and Sustainable KPI Tracking
Implementing a KPI tracking system is just the beginning. To derive long-term value, you must adopt practices that ensure the system remains relevant, accurate, and embedded in your company's culture.
Focus on Quality Over Quantity (The "Less is More" Principle)
It's tempting to track dozens of metrics, but this dilutes focus. A powerful key performance indicator tracker concentrates on the vital few indicators that truly reflect strategic success.
A good rule of thumb is to have 3-5 primary KPIs for the company as a whole, with each department tracking an additional 3-5 KPIs specific to its function.
Ensure Data Accuracy and Integrity
Your KPI tracking system is worthless if the underlying data is unreliable. This is the biggest argument for automation over manual processes. Implement data governance policies, use automated data integration tools to eliminate human error, and regularly audit your data sources to ensure consistency and accuracy. If your team doesn't trust the numbers, they won't use them to make decisions.
Contextualize Your Data for Deeper Insights
Data without context is just noise. Don't just report that 'Conversion Rate is 3%.' Report that 'Conversion Rate is 3%, which is up from 2.5% last month and ahead of our 2.8% target, driven by a high-performing new landing page.' Always analyze KPIs in the context of goals, historical trends, and business activities to turn data into a compelling story.
Foster Open Communication and Collaboration Around KPIs
KPIs should not be a tool for blame. They should be a catalyst for conversation and problem-solving. Use your KPI review meetings as collaborative sessions to discuss what's working, what isn't, and how to improve. When teams feel safe to discuss underperforming KPIs without fear of punishment, you foster a culture of transparency and continuous learning.
Be Flexible and Adapt KPIs as Business Goals Evolve
The business environment is dynamic. Your strategic goals will change, and your KPIs must change with them. Conduct an annual or semi-annual review of your entire KPI framework. Ask critical questions: Are these KPIs still relevant? Do they still align with our current objectives? Are we tracking anything that no longer provides value? This iterative refinement ensures your tracking system remains a sharp, effective strategic tool.
Common Pitfalls in KPI Tracking and How to Avoid Them
Even with the best intentions, many KPI tracking initiatives fail to deliver on their promise. Being aware of the common pitfalls can help you navigate the challenges and build a system that delivers lasting value.
Avoiding Vanity Metrics That Don't Drive Action
A vanity metric is a number that looks impressive on the surface but doesn't correlate with business success (e.g., social media likes, total registered users). Focusing on these can create a false sense of accomplishment while core business health declines.
How to Avoid: For every KPI, ask the "So what?" question. If this number goes up, what is the tangible impact on revenue, profit, or customer satisfaction? Tie every KPI back to a core business objective.
The Danger of Setting Unrealistic or Unclear Targets
Setting targets that are impossible to reach can crush team morale and lead to burnout. Conversely, targets that are too vague provide no clear direction.
How to Avoid: Use historical data and industry benchmarks to set challenging but achievable goals. Ensure targets are specific and time-bound, following the SMART framework.
Overlooking the Importance of Data Governance
This refers to the overall management of the availability, usability, integrity, and security of data. Without clear ownership and standardized definitions (e.g., what constitutes an "active user"), different teams may track the same KPI differently, leading to conflicting reports and a lack of trust in the data.
How to Avoid: Create a data dictionary that clearly defines each KPI and its calculation method. Assign clear ownership for each data source and KPI.
Tracking in Silos: The Need for a Unified View
When the marketing team only looks at marketing data and the sales team only looks at sales data, you miss the full customer journey. This leads to poor decision-making and missed opportunities for optimization.
How to Avoid: Invest in tools that can provide a single, unified view of performance. Effective marketing analytics tools must integrate data from across the entire customer lifecycle, from first touch to final sale and beyond, to provide a holistic understanding of business performance.
Forgetting the "Why": Connecting KPIs Back to Strategy
Sometimes teams get so focused on hitting a specific KPI target that they lose sight of the strategic reason it was chosen in the first place. This can lead to short-term tactics that harm the long-term health of the business.
How to Avoid: Regularly communicate the strategic narrative behind your KPIs during review meetings. Constantly reinforce how improving a specific indicator contributes to the company's overarching mission.
Advanced KPI Tracking Strategies for a Competitive Edge
Once you've mastered the fundamentals of KPI tracking, you can leverage more advanced techniques to unlock deeper insights and create a significant competitive advantage. These strategies move from reactive monitoring to proactive, predictive management.
Predictive Analytics and KPI Forecasting
Instead of just looking at past performance, predictive analytics uses historical data, statistical algorithms, and machine learning techniques to identify the likelihood of future outcomes. You can apply this to your KPIs to forecast future revenue, predict customer churn, or estimate future demand. This allows you to anticipate challenges and opportunities and make proactive adjustments to your strategy.
Incorporating AI and Machine Learning into KPI Analysis
Artificial Intelligence can analyze vast datasets far more quickly and effectively than a human analyst. AI-powered tools can automatically detect anomalies in your KPI trends, identify hidden correlations between different metrics (e.g., how a dip in website speed affects conversion rates), and even suggest specific actions to improve performance, turning your data into prescriptive insights.
Using KPI Tracking for Effective Marketing Attribution Models
Understanding which marketing channels and touchpoints contribute most to conversions is a complex challenge. Advanced KPI tracking involves connecting data across the entire customer journey.
By implementing sophisticated marketing attribution models (like multi-touch or data-driven attribution) on top of your unified data, you can move beyond last-click analysis and accurately measure the true ROI of each marketing activity.
Automating the KPI Reporting Cycle with Reporting Automation
The final step in maturing your KPI process is to fully automate the reporting cycle. This goes beyond just having dashboards. Using reporting automation tools, you can schedule and automatically distribute customized reports to different stakeholders via email, Slack, or other channels.
This eliminates countless hours of manual report building, ensures consistent and timely communication, and frees up your analytics team to focus on strategic analysis rather than report generation.
Conclusion
Accurate KPI tracking starts with clean, consistent data. No dashboard, metric, or report can deliver value if it’s built on fragmented or unreliable inputs.
As marketing operations scale and data flows in from dozens of disconnected platforms, ensuring accuracy, timeliness, and standardization becomes the defining factor between insight and noise. A strong data foundation turns KPI tracking from a manual reporting task into a strategic performance system.
Improvado provides that foundation, automating data extraction, normalization, and validation across all marketing, sales, and revenue sources. It enforces consistent taxonomies, aligns metrics across channels, and delivers governed, analysis-ready data directly into your warehouse or BI tool. With clean, trusted data powering your KPIs, every decision is faster, more precise, and directly tied to business outcomes.
Request a demo and see how Improvado enables accurate, automated KPI tracking at scale.


