Content marketing is closely linked with analytics and metrics. From monitoring the number of page views to assess the traction your content gets on search engines to tracking the number of backlinks to understand how credible your content seems to other domains. All these data are scattered across different platforms, spreadsheets, or charts. And, unfortunately, content marketers often have to gather these data manually, instead of conquering the tops of SERPs.
However, there’s a surefire way to optimize content analytics. With a content marketing dashboard, you can review all your favorite metrics in one place and monitor how your content impacts the company’s bottom line.
In this article, we'll walk you through the key steps of building a content marketing dashboard, including the essential metrics to track and the best tools to use.
Key Takeaways:
- A content marketing dashboard is a vital tool for analyzing and monitoring the performance of your content marketing efforts.
- It provides insights into the effectiveness of your campaigns and enables accountability for your activities.
- Metrics such as impressions, clicks, sessions, time on page, generated opportunities, total revenue, and conversion rate are important to include in your content marketing dashboard.There are various ways to build a content marketing dashboard, including manually updated data, a DIY dashboard with API integrations, third-party reporting tools, and automated marketing analytics platforms..io/docs/vk-ads">API integrations, third-party reporting tools, and automated marketing analytics platforms.
What Is a Content Marketing Dashboard.
A content marketing dashboard visually represents key metrics related to a company's content marketing efforts. It provides a centralized platform to track and analyze various metrics, such as website traffic, engagement, leads, and conversions, which can help marketing teams optimize their marketing strategies and improve content performance.
The primary role of a content marketing dashboard is to help teams monitor the performance of organic channels. By tracking key metrics, teams can evaluate their efforts' effectiveness and adjust their strategies accordingly to achieve better results.
Content marketing dashboards usually provide a real-time view of metrics, allowing teams to make content tweaks, redesign distribution strategies, check keyword positions, etc. They can also help teams set specific goals and track progress against those goals.
In a nutshell, a content marketing dashboard eliminates the need to switch between different analytics tools and platforms. By having all the relevant information in one place, teams can streamline data analysis and reporting, saving time and resources.
Who Should Use a Content Marketing Dashboard.
Content marketing dashboards are versatile enough to not only help regular content marketers, but also fulfill the needs of C-level marketing executives. Let's look at how different organizational roles can use it to improve their content marketing campaigns.
Content Marketing Managers
Content marketing managers can use the content marketing dashboard to understand how their day-to-day activities convert into numbers. By tracking content performance metrics, such as page views, average time on page, bounce rate, etc., they can assess whether the content is engaging enough and make necessary adjustments if required.
Additionally, the dashboard tracks the goals set for content pieces, such as trial requests, resource downloads, email form completion, etc. These goals show which content pieces drive your department to different objectives and which pieces should be optimized.
C-level Marketing Executives
C-level marketing executives use content marketing dashboards to evaluate the effectiveness of their content marketing strategy and the ROI of content marketing campaigns to make data-driven decisions. With this information, they can align the content department’s activities with global business goals and optimize content budgets.
What’s more, data from content marketing dashboards is an integral part of the quarterly/annual marketing report which CMOs present to the board. If the report proves that the organic channel generates enough revenue, the CFO might allocate more resources to scale successful content marketing activities.
Finally, the dashboard also might show the share of voice owned by your company compared to competitors. This info might be useful to better understand the reach of your content and the global share of the market occupied by your organization in the niche market.
Performance Marketing Managers
Performance marketing managers closely cooperate with content marketers. For example, teams often distribute promising content pieces via paid search ads and social media ads. Performance marketers can use the content marketing dashboard to assess the quality of incoming paid traffic and decide whether it’s worth investing in paid ads to promote the content piece.
Another point of intersection between performance and content teams is the messaging used on paid creatives. Performance marketers monitor different campaigns to understand which images or narrative works best. Having a separate dashboard that tracks the performance of different creatives helps performance marketers identify the most promising messaging and adjust other campaigns according to this messaging. Here’s, for example, how it works with Improvado’s paid ads dashboard:
Why Use a Content Marketing Dashboard.
Content marketing dashboards are essential for marketing teams as they provide a centralized platform to track and analyze metrics related to their content marketing efforts. Here are some benefits of using a content marketing dashboard:
Increased visibility
Content marketing dashboards offer a comprehensive view of marketing performance, providing real-time insights into data, including pageviews, clicks, social media engagement, leads, and conversions. This increased visibility can help teams identify trends, discover opportunities, and optimize their strategies in real time.
Improved accountability
A clear record of goals in a content marketing dashboard makes teams more accountable for their activities. More accountability motivates teams to achieve their targets and sets a clear course for a team, which makes it more productive.
Better decision-making
Content marketing dashboards enable teams to make informed decisions by providing access to real-time data. With a clear understanding of what's working and what's not, teams can optimize their content, improve overall messaging, and make accurate strategic decisions.
Customization
A content marketing dashboard can be customized to fit a team's specific needs. Teams can choose the metrics they want to track, the charts and graphs they want to use, and the overall layout of the dashboard. Customization allows teams to be more flexible and tailor the dashboard to their specific business objectives.
Increased efficiency
A content marketing dashboard doesn’t make much sense without a solid data infrastructure behind it. A dashboard development process also includes streamlining data collection, transformation, storing, and loading into the dashboard itself. Marketers often struggle to fulfill all the steps on their own due to the required level of technical expertise. However, with some external help from analysts or third-party vendors’ automation, the dashboard will be powered with real-time data, leaving marketers more time to focus on campaigns and analysis instead of spending time on gathering data.
Additionally, studies have shown that incorporating analytics tools, such as a content marketing dashboard, can lead to greater success in content marketing. A study by Content Marketing Institute found that 84% of the most successful content marketers use analytics tools to manage content. By utilizing a content marketing dashboard, marketing teams can gain a competitive advantage by leveraging real-time data to optimize their strategies, increase accountability, and ultimately achieve their content marketing goals.
What Metrics to Include in a Content Marketing Dashboard
According to the 2022 State of Marketing Report by Salesforce, 72% of high-performing marketers analyze marketing performance in real-time. This highlights the importance of having a content marketing dashboard that provides a centralized platform to track and analyze marketing metrics, enabling teams to make data-driven decisions. Let’s take a closer look at metrics used by different roles in various reporting scenarios:
Day-to-Day Content Marketing Metrics
We’ll start with the content marketing metrics that your team should closely monitor every day. These metrics allow your team to understand how search engines rank their content, how engaging the content is to readers, and how it helps you achieve your goals.
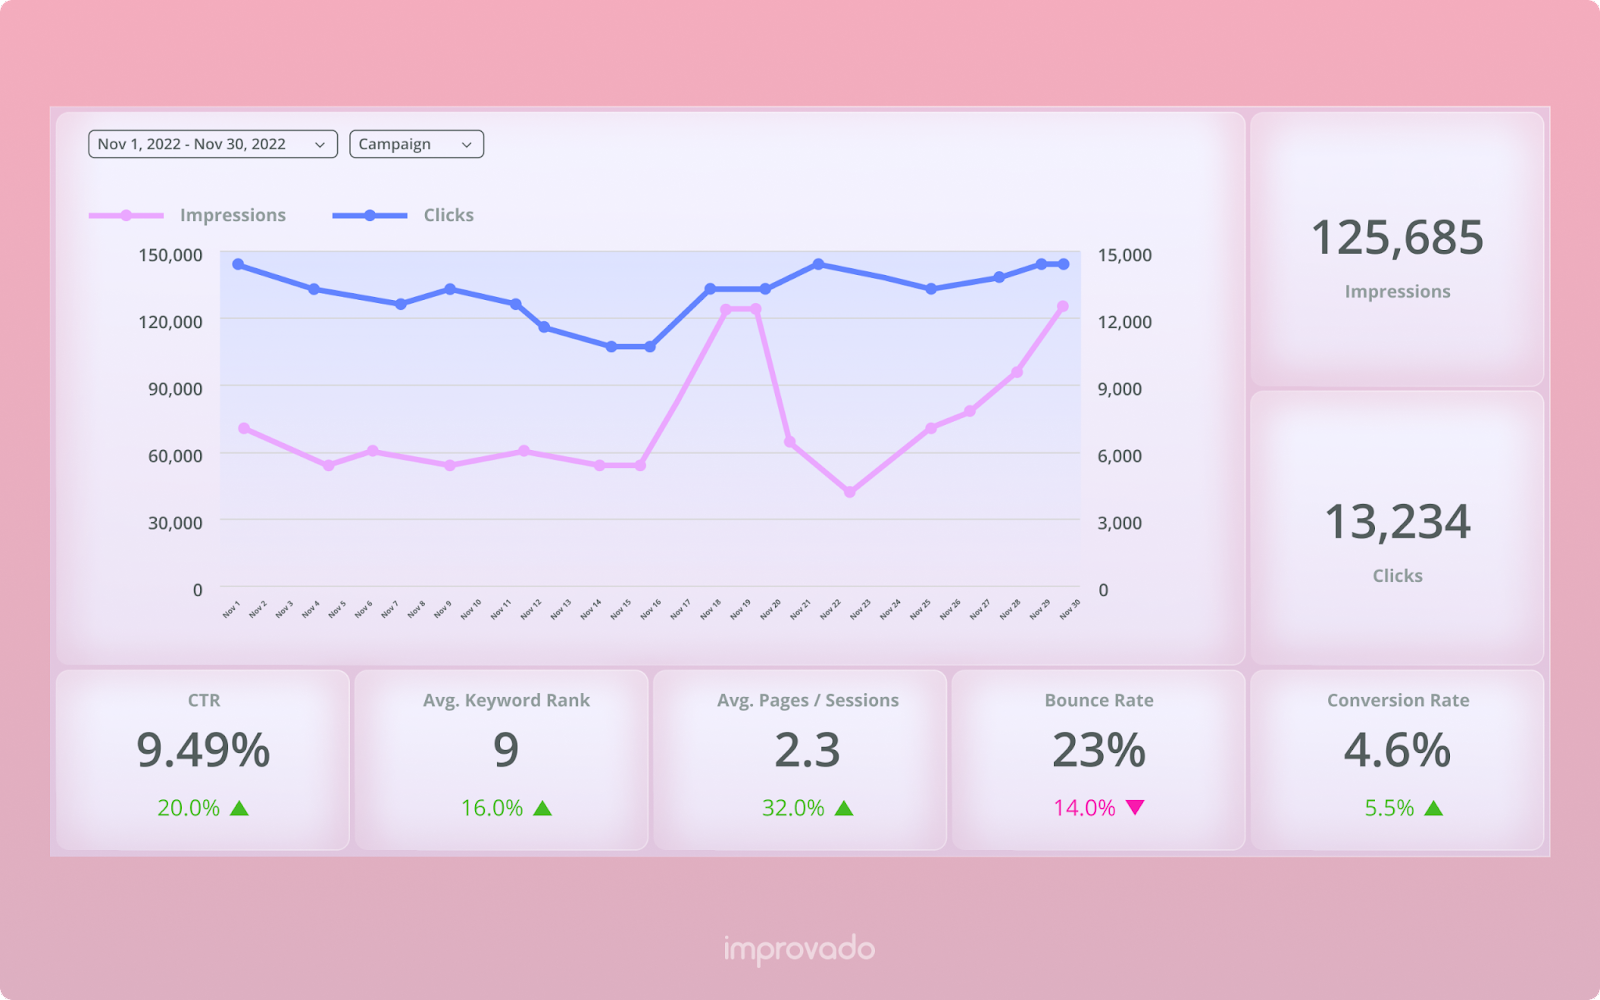
Impressions
This metric shows you how many people are seeing your content. By tracking this metric, you can identify which pieces of content are getting the most traction and identify the characteristics of the content piece that make it stand out on search engines. On the other hand, a sharp decline in impressions may indicate that the search engine doesn’t consider the content piece to be informative or trustworthy. In this case, you have to update it according to the E-A-T principle.
Clicks / CTR
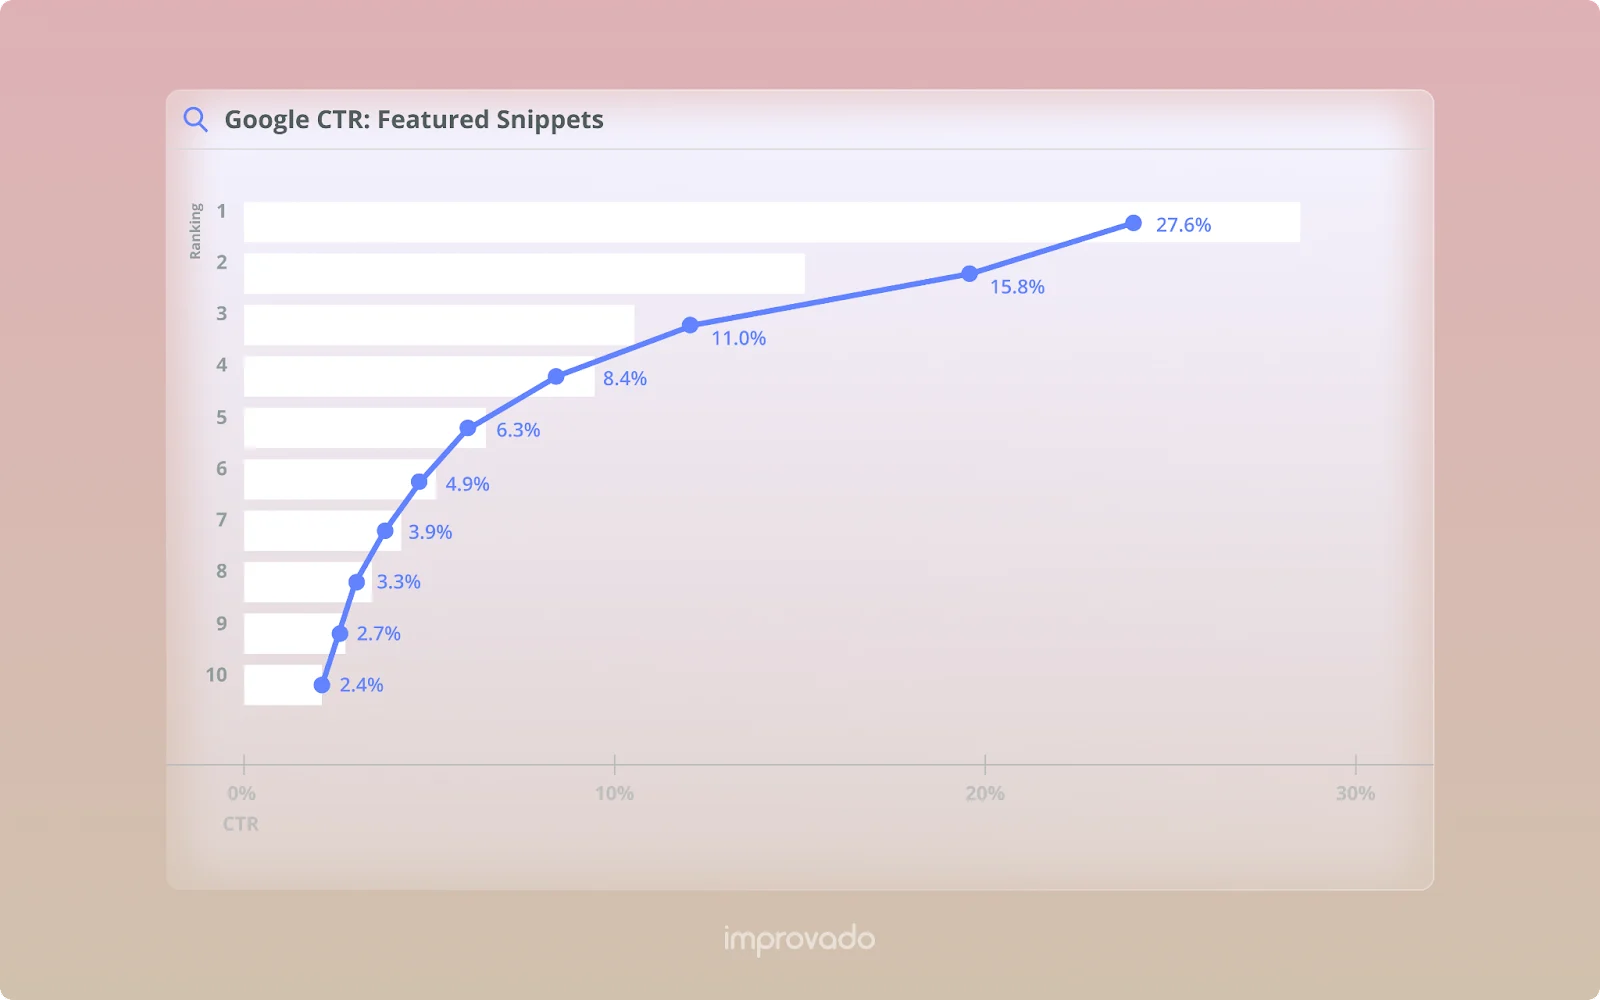
This metric shows how many people click on your content. By tracking clicks, you can understand how engaging the content’s title is. If your piece has a high SERP position but doesn’t generate enough traffic, you need to come up with a more catchy title. You can use the chart below as a CTR benchmark for your content pieces. The higher your article is on SERP, the higher the projected CTR is.
Bounce rate
This metric shows the percentage of people leaving your site after viewing only one page. By tracking this metric on each content piece, you can identify which pieces of content aren’t engaging enough or don’t have the required navigational elements to prolong the user journey on your website.
Marketers who promote products with longer sales cycles should keep a close eye on this metric. The more touchpoints users have with your brand, the more willing they are to buy your product.
Keyword ranking
This metric shows how your content ranks for specific keywords. Keyword ranks are extremely important to know the estimated amount of traffic each piece brings to your website and understand how your content compares to competitors’ pieces.
In addition to monitoring your ranks, you can also check competitors’ keywords. At some point, you might realize that your rivals rank for keywords that aren’t covered on your blog. If the keyword cluster is in line with the topic of your blog or website, you’ve found yourself a topic to cover and a new opportunity to generate more traffic and leads.
Number of backlinks by page
This metric shows the number of websites linking to your content piece. By tracking this metric, you can identify which pieces of content are the most shareable and how your backlink profile compares to competitors’ profiles.
Backlinks play a significant role in content ranking. That’s why, if you’re coming up with a new content piece, you should check the number of backlinks on top-ranking content for your seed keyword. Knowing the number will help you plan the link-building strategy for your piece. Whether you’re paying for backlinks or gathering them organically, it’s important to keep up with competitors.
Backlinks
Let’s take a more in-depth look at backlinks. There’s one important thing to remember: backlinks aren’t equal. The quality of the backlinks depends on the linking domain authority, URL strength, the amount of traffic generated by the linking domain, thematic fit, and more.
For example, if you’re posting an article on content marketing dashboards (just like the one you’re reading), a backlink from HubSpot would have much more impact than a link from a regular guest-posting website for two main reasons:
- HubSpot is a trustworthy resource in the marketing field (authority + thematic fit).
- HubSpot most likely attracts more traffic.
Ahrefs offers a lot of metrics to help you measure the backlink potential of different websites and assess the strength of your backlink profile. You can streamline this data to your content marketing dashboard to create a single source of truth for content marketing data.
Avg. number of pages per session
This metric shows how many pages your visitors view on average during a single session. By tracking this metric, you can identify which pieces of content are the most engaging and adjust your content strategy accordingly.
Metrics for C-level Marketing Execs
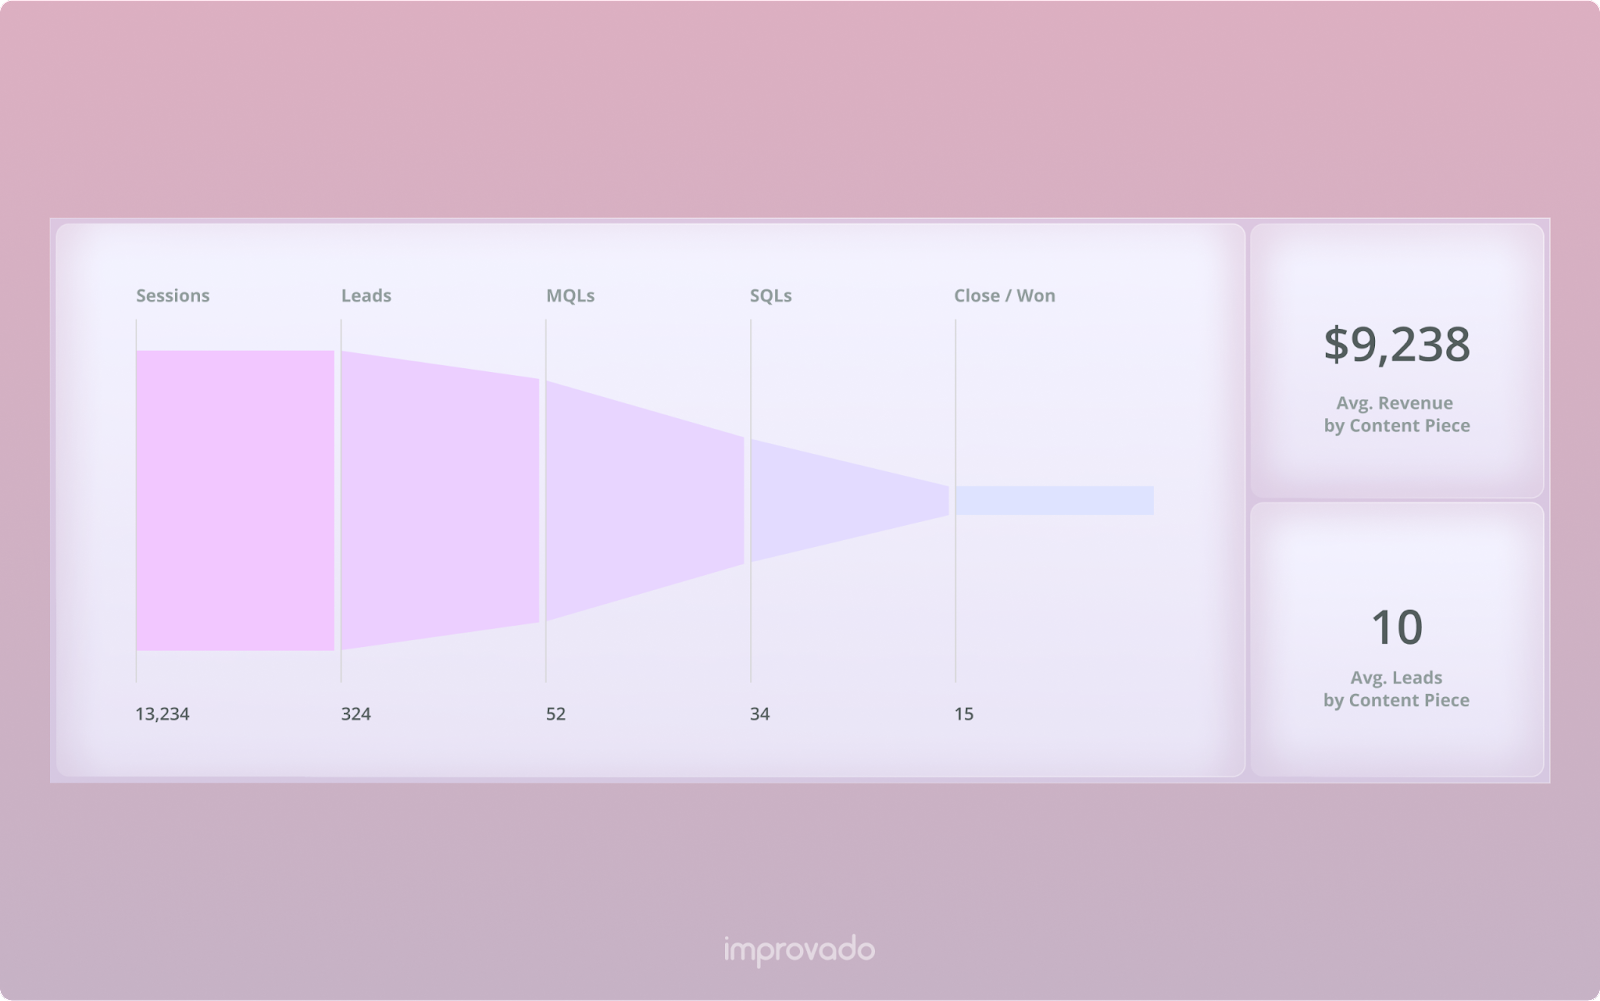
Next up are higher-level metrics that can be used in general marketing reports presented to the board or CMOs/VPs of Marketing.
Revenue attributed by content piece
While all the metrics listed above indicate the effectiveness of your content in terms of ranking and SEO, CMOs usually focus on more tangible metrics, such as revenue. That’s why a report showing which content pieces bring the most revenue is crucial.
MQLs attributed by content piece
Tracking qualified leads is as important as tracking revenue. Instead of simply displaying the content pieces that bring the most leads, you can go further and break down those leads into groups. In this way, your dashboard will show which content pieces are popular among small businesses and which attract enterprises. You can use it to track the ROI of your content marketing efforts and adjust your content according to your target audience preferences.
Digital velocity
Digital velocity metrics show the speed at which accounts go from a lead to the closed/won stage. This indicator will help you understand which content pieces bring audiences that are more aware of your product and are more willing to buy it.
Pipeline conversion rates
This metric shows how many leads move through your sales pipeline and convert into paying customers. By tracking this metric, you can identify areas where your pipeline might get clogged and adjust your content strategy accordingly.
How to Build a Content Marketing Dashboard
Now that you know which metrics to include in your content marketing dashboard, let's look at how to build one. There are a few different ways to build a content marketing dashboard, each with its own advantages and disadvantages.
Build a content marketing dashboard with manually updated data
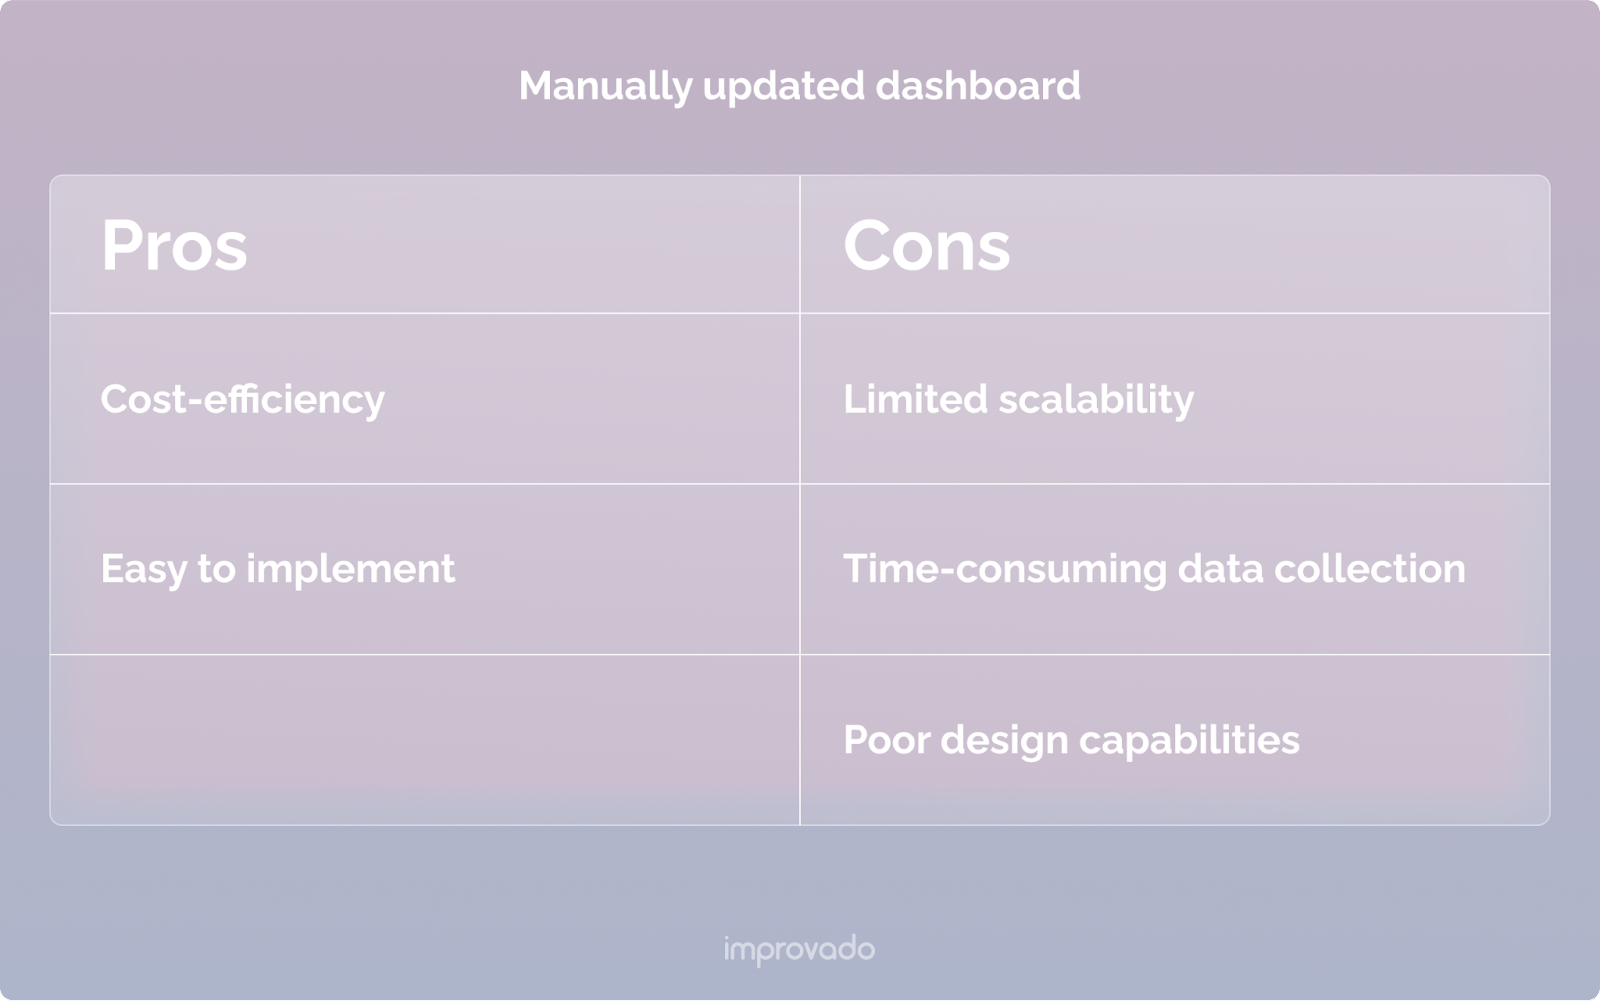
Spreadsheets are a tool that requires little to no technical knowledge. That's why they are so popular with most marketers. Teams often use spreadsheets as a single source of truth for their marketing activities. They have to populate tables with metrics gathered manually from different sources, and, unfortunately, that's not a very efficient or scalable way to build a content marketing dashboard. Here's why:
- Manual data collection: Collecting data from multiple sources and inputting it into a spreadsheet is time-consuming. Each data point has to be manually copied and pasted, which can result in errors and inconsistencies.
- Limited scalability: As your business grows and your data sources increase, manually updating a spreadsheet becomes more challenging. With more data points to track, it can quickly become overwhelming and difficult to manage. Plus, spreadsheets aren’t designed to be a database. When processing tens of thousand data rows, spreadsheets tend to stutter, freeze, or even crash regular office PCs.
- Lack of real-time insights: Manually updating a spreadsheet can result in a time delay in obtaining the most up-to-date information. As a result, it becomes impossible to make informed decisions when your data has a lag of a few days.
- Limited customization: A manually updated spreadsheet may not provide the flexibility and customization that some businesses need. They often lack in chart design capabilities and other features compared to visualization tools such as Tableau or Power BI.
Overall, building a content marketing dashboard using a spreadsheet and manually updated data may be a low-cost, entry-level solution. However, there are more efficient options for businesses that require comprehensive real-time insights.
Build a DIY dashboard with API integrations
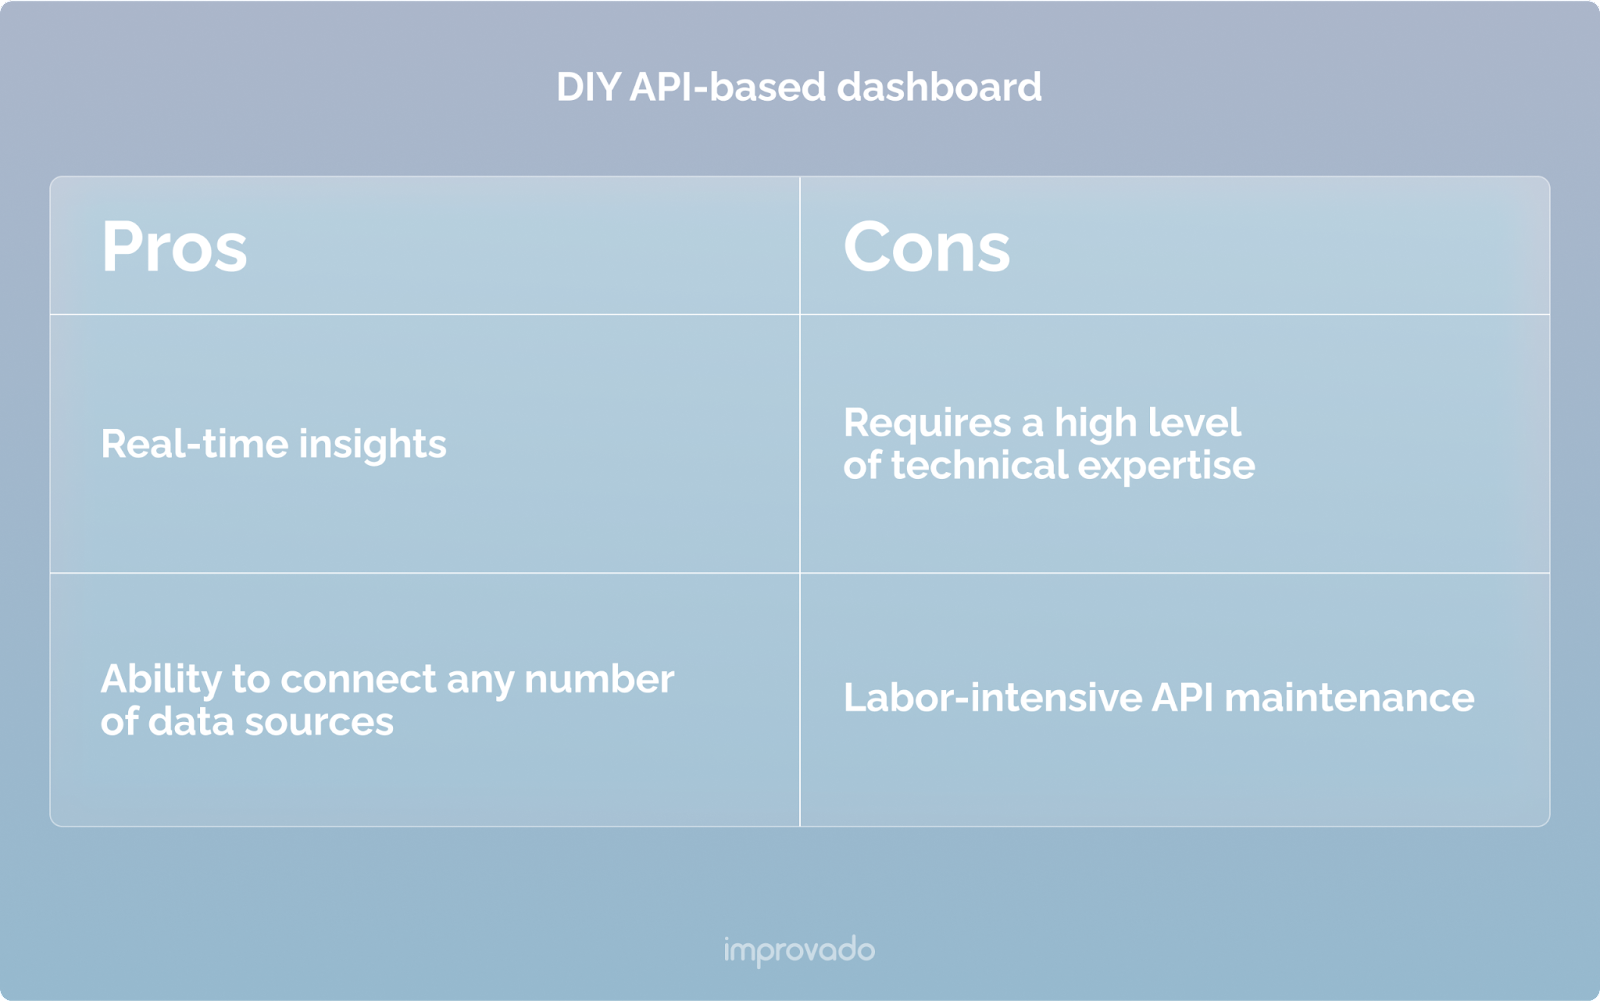
Another option to build a content marketing dashboard is using API integrations to pull data from different sources automatically. While this approach automates data collection, it also requires certain technical expertise and resources to maintain. The process of setting up APIs can be complicated, involving programming and review of each API’s documentation.
To set up an API integration, developers need to understand API protocols, authentication methods, and endpoint documentation, among other technical aspects. This process can quickly turn into a large time suck and require additional resources to ensure the integrations are working correctly.
What’s even more challenging is maintaining these APIs. Platforms roll out several updates per year for each of their APIs. Developers will also need to keep an eye on these changes, as they may require the codebase to be updated to keep the integration working properly.
For instance, to extract data from Facebook Ads, marketers need to access Facebook's API documentation, obtain a Facebook app ID and secret key, and create an access token. This requires technical expertise and a clear understanding of the authentication process. Marketers also need to use the appropriate endpoints to extract the desired data, which can be complicated.
And don’t even get me started on API deprecation, for example, a recent Adwords API sunset. Migrating your current infrastructure to a completely new API is a real pain in the neck.
Furthermore, integrating multiple data sources can add a layer of complexity. To access data from different sources, developers must use other API protocols and ensure they are compatible. This may require more development resources, time, and cost.
In summary, while building a content marketing dashboard with API integrations certainly automates your data workflow, it also requires technical expertise and considerable development resources.
Use a third-party reporting tool
One way to build a content marketing dashboard is to use a third-party reporting tool such as Whatagraph.
It can be a quick and easy way to get a content marketing dashboard up and running. However, these tools often provide limited insights and lack the granularity required to achieve deeper insights out of raw numbers. Users typically have limited options for customizing the dashboard and may be limited to pre-built templates.
While these tools may work for teams with limited resources or very basic reporting requirements, more advanced marketers may find them too basic and not customizable enough to meet their needs.
Use automated marketing analytics platforms
Automated marketing analytics platforms, like Improvado, provide a powerful solution to build a content marketing dashboard. With Improvado, you can easily collect data from all your data sources, including Google Search Console, social media platforms, Google Analytics, etc. and streamline all the data to one of Improvado’s pre-built visualization templates.
Over a 1000 mid-sized and large companies trust their marketing data to Improvado, among them are giants such as ASUS, Activisions, Illy, and Docker.
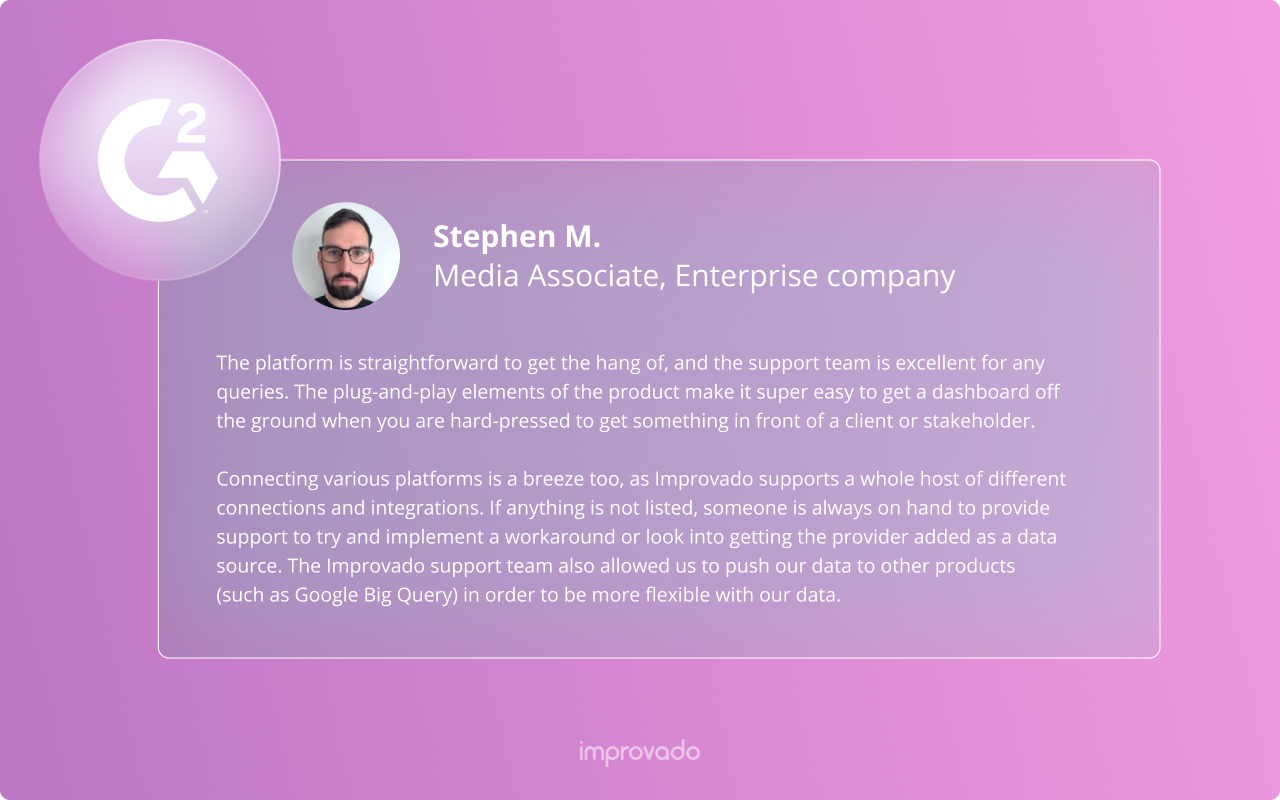
Here are some of the benefits of using an automated marketing analytics platform like Improvado for your content marketing dashboard:
- Customization: Unlike third-party reporting tools, automated marketing analytics platforms like Improvado allow you to customize your dashboard to fully meet your specific needs. You can choose the metrics you want to track, create custom visualizations, and more. You can either use pre-built templates or contact the platform for a fully custom dashboard.
- Granularity: Marketing analytics platforms provide more granular insights into your content marketing performance. This means you can dig into each metric provided by all of your content marketing tools to uncover patterns and insights you might not have noticed otherwise. From Semrush alone, Improvado can pull over 60 different metrics and streamline all of them on the dashboard of your choice.
- Number of sources: Marketing analytics platforms support an extensive list of data sources, making it easy to bring all your marketing data into one place. With Improvado you can integrate with over 500 platforms and data sources, including Google Analytics, Google Search Console, Ahrefs, Semrush, Salesforce, and many more.
- Time-saving: Automated marketing analytics platforms allow you to save time by automating data collection. You don't need to manually extract and upload data, as the platform does it for you, which leaves you more time to focus on analyzing your data and making informed decisions.
By using an automated marketing analytics platform like Improvado, you can easily build a content marketing dashboard that provides the insights you need to optimize your content marketing efforts.
Drive Higher ROAS with a Content Marketing Dashboard from Improvado
Building a content marketing dashboard is crucial for any marketing team that wants to measure the effectiveness of its content marketing efforts. There’s a lot of ways to build a content dashboard and even more metrics to consider when creating a versatile content marketing dashboard.
However, to get the most out of content marketing analytics, you need either a group of experienced analysts and engineers or a trustworthy marketing analytics platform.
.png)


.png)
