
Marketing generates more data than ever, but without structure, it quickly becomes noise.
Reports are the lens that transform scattered metrics into clarity, revealing what campaigns achieved and how those results translate into revenue, efficiency, and growth.
When reporting lacks consistency or rigor, the consequence is essentially missed opportunities, misallocated budgets, and decisions made without a trustworthy foundation.
This guide examines the essential components of effective marketing reports, the cadences that matter, the report types that provide the most value, and offers a number of marketing report templates. Each section highlights not just what to measure, but how to interpret results in a way that drives accountability and resource allocation.
What Is a Marketing Report?
The value of a marketing report lies in its ability to convert complex, cross-channel data into insights that inform decision-making at both the operational and leadership levels:
- For operations roles, reports ensure that marketing data pipelines are reliable, consistent, and governance-ready, supporting accurate attribution and streamlined resource allocation.
- For marketing leadership, they provide the visibility needed to evaluate ROI, align execution with growth objectives, and justify investment decisions.
Why Is Marketing Reporting Crucial for Business Growth?
Marketing reporting is not a tactical afterthought, but a strategic capability that directly impacts revenue growth, resource efficiency, and organizational alignment.
By transforming fragmented marketing data into actionable intelligence, reporting enables leaders to defend budgets, optimize execution, and connect marketing’s contribution to overarching business outcomes.
Justifying Marketing Spend and Proving ROI
In an environment where marketing is expected to operate as a growth engine, accountability is non-negotiable.
Marketing reports provide the transparency needed to demonstrate clear connections between spend and outcomes, whether revenue, pipeline acceleration, or customer acquisition efficiency.
By translating campaign activity into ROI metrics, organizations can validate past investments, strengthen budget negotiations, and position marketing as a profit center rather than a discretionary cost.
Enabling Data-Driven Decision-Making
The speed of the market demands rapid, evidence-based choices. Reporting equips decision-makers with real-time visibility into campaign performance, channel efficiency, and customer behavior.
These insights reveal where spend generates disproportionate value, where campaigns underperform, and where opportunities exist to reallocate resources. With this level of intelligence, leaders can pivot strategy, refine targeting, and scale proven initiatives before competitors capitalize.
Aligning Marketing Efforts with Business Objectives
For marketing to drive measurable impact, it must operate in lockstep with enterprise priorities. Marketing reporting creates that alignment by mapping activities directly to business goals such as revenue growth, customer lifetime value, or market expansion.
This shared visibility ensures that KPIs are not siloed but integrated into the broader scorecard that leadership uses to measure success. The result is organizational cohesion—marketing, sales, finance, and the C-suite operating from a unified definition of performance.
What Should a Digital Marketing Report Include? Essential Components
A comprehensive digital marketing report is a narrative that links marketing performance to business outcomes. Each section should provide clarity, context, and actionable direction.
Key Performance Indicators (KPIs) & Core Metrics
KPIs are the backbone of marketing reporting, but their selection should never be one-size-fits-all.
The right set of marketing metrics depends on the purpose of the report, the business model, and the audience consuming it. Executive-level reviews require financially aligned indicators such as ROI, CAC, and LTV, while operational reports demand more granular, channel-specific metrics tied to optimization workflows.
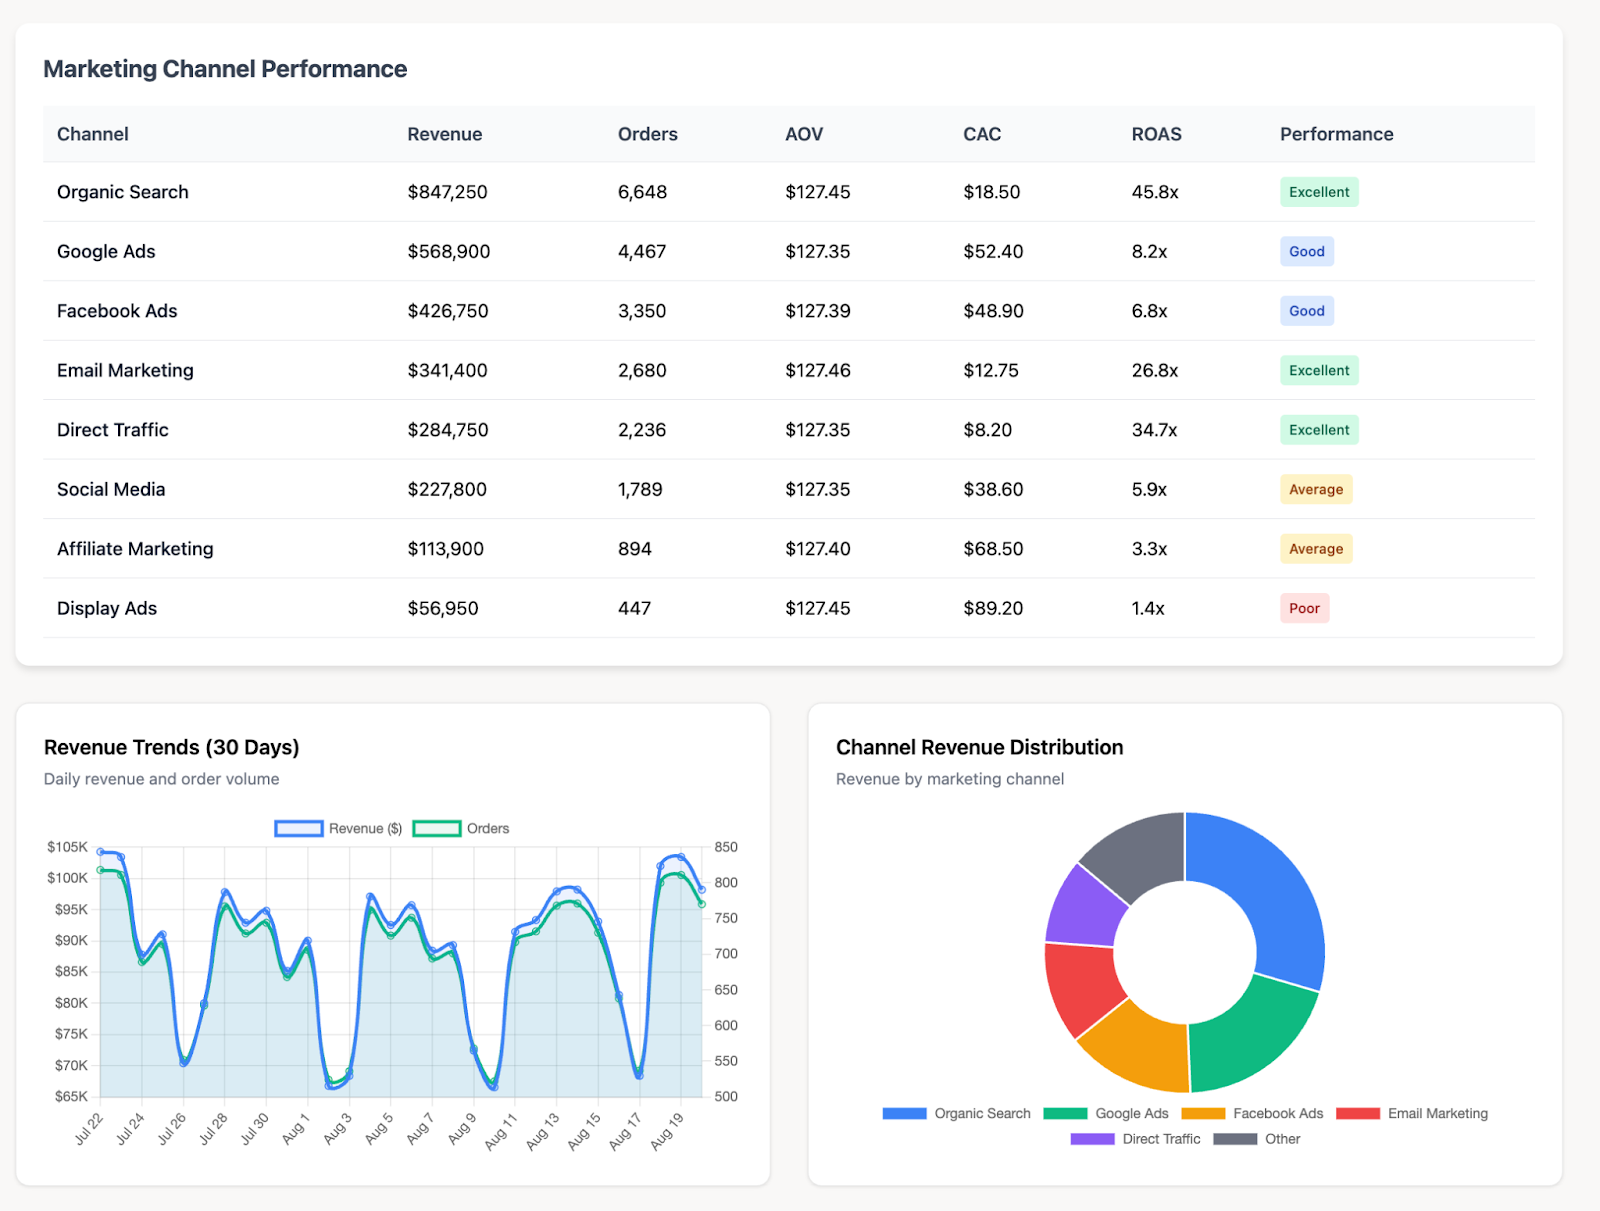
Let’s take a Marketing Channel Performance report as an example.
When reporting on channel-level efficiency, KPIs should answer: Is this channel meeting its role in the funnel, and is it delivering returns aligned with business goals?
Core metrics to include in channel reporting:
- Revenue: The total income attributed to each channel, serving as the baseline for measuring impact.
- Orders / Conversions: Volume of completed transactions or desired actions.
- Average Order Value (AOV): Revenue per transaction, crucial for e-commerce profitability.
- Customer Acquisition Cost (CAC): Average cost to acquire a customer; signals efficiency of spend.
- Return on Ad Spend (ROAS): Ratio of revenue generated to advertising cost; primary profitability metric.
- Performance Rating: Qualitative categorization derived from thresholds for ROAS, CAC, and revenue contribution.
By aligning KPIs with the report's structure, decision-makers can quickly identify high-performing channels from underperforming ones. This enables the informed reallocation of budgets, early detection of inefficiencies, and stronger alignment with financial objectives.
Findings, Analysis, and Key Insights
Raw numbers alone rarely influence decisions. The true value of a marketing report lies in its ability to transform data into context-rich insights that explain what happened, why it happened, and what it means for business outcomes.
This section serves as the diagnostic layer of the report, connecting performance metrics with actionable insights.
Key Practices:
- Identify trends: Highlight growth trajectories or early warning signals.
- Spot anomalies: Flag sudden drops in CTR or spikes in bounce rate and connect them to likely causes.
- Surface root causes. For example:
- Declining conversion rate → Landing page latency or irrelevant ad copy.
- Rising CPC → Increased competition in auctions.
- Falling engagement → Content fatigue or misaligned targeting.
Actionable Recommendations and Next Steps
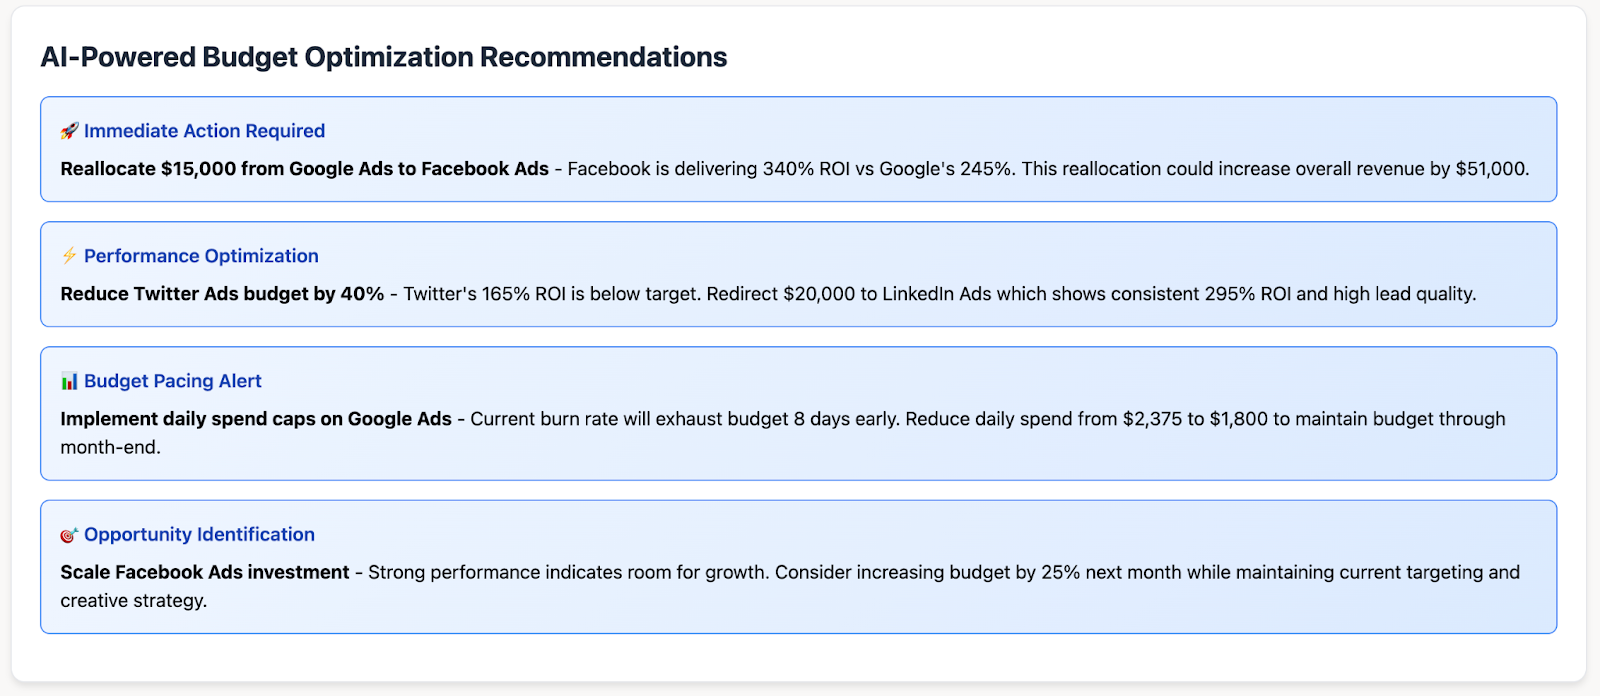
The ultimate value of a marketing report lies in actionability. Insights must translate into a roadmap that connects analysis back to business objectives.
Characteristics of Effective Recommendations:
- Specific: Clearly outline the adjustment, for example, “Shift 10% of paid search budget from non-branded to branded campaigns”.
- Measurable: Define success criteria and KPIs to track improvement.
- Prioritized: Differentiate between quick wins and longer-term structural improvements.
- Revenue-Aligned: Ensure recommendations tie directly to ROI, CAC efficiency, or pipeline growth.
Example:
- Pause underperforming ad groups with CAC > target benchmark.
- Reallocate 15% of paid social spend into high-performing lookalike audiences.
- Optimize landing page speed to reduce bounce rate by 20%.
- Scale content formats that drive the highest LTV-based conversions.
How to Create a Marketing Report in 5 Steps
Creating a marketing report is more than pulling metrics. It’s a structured process that transforms fragmented data into a decision-making framework. Each step builds on the previous one to ensure that insights are both accurate and strategically actionable.
Step 1: Define Your Audience and Objectives
Before collecting any data, clearly define who your target audience is for the report. Each audience has different needs and priorities, and reports must be tailored to the stakeholders who will use them:
- Executive leadership requires financial alignment (ROI, revenue contribution, CAC, LTV).
- Marketing operations need visibility into process efficiency, attribution models, and cross-channel governance.
- Channel managers focus on tactical optimization metrics such as click-through-rate (CTR), CPC, or Quality Score.
At the same time, define the objectives of the report. Ask:
- What business questions must this report answer?
- What decisions will be made based on it (budget allocation, campaign scaling, or strategic shifts)?
This ensures the report remains outcome-driven rather than a static data dump.
Step 2: Select the Right KPIs and Metrics
Based on your audience and objectives, select the most relevant Key Performance Indicators (KPIs) and core metrics. Resist the urge to include every possible metric. Focus on those that directly measure progress toward your marketing goals and provide meaningful insights.
The KPIs chosen must reflect both the objective of the report and the stage of the funnel being evaluated.
For instance, if your goal is brand awareness, you'll focus on impressions and reach, whereas if it’s lead generation, you’ll prioritize MQLs, SQLs, and conversion rates.
Step 3: Gather and Consolidate Your Marketing Data
This step is often the most challenging, as marketing data is typically scattered across numerous platforms like Google Analytics (GA4), Google Ads, Facebook Ads, HubSpot, your CRM, and more.
Manually pulling data from dozens of platforms is time-consuming and prone to errors. Improvado, a marketing data and analytics platform, solves this challenge by automating the entire process.
It connects to 1,000+ marketing, sales, and revenue platforms, normalizes the data into a consistent structure, and delivers it into your BI tools or data warehouse. By enforcing standardized taxonomies and eliminating manual prep, Improvado ensures your team works from a single source of truth.
The result: reliable, governance-ready datasets that cut reporting time from hours to minutes and allow decisions to be made with confidence.
Before Improvado, preparing reports at Signal Theory was a labor-intensive process, often taking four hours or more per report. Switching to Improvado reduced that time by over 80%, making reporting significantly more efficient and far less stressful.
"Reports that used to take hours now only take about 30 minutes. We're reporting for significantly more clients, even though it is only being handled by a single person. That's been huge for us.”

Step 4: Visualize Your Data and Tell a Story
Numbers in isolation don’t drive action, stories do. Visualization is the bridge between data and comprehension.
- Use charts, dashboards, and graphs to surface key trends at a glance.
- Choose visualization methods suited to the data, for example, time-series charts for trends, funnel charts for conversions, ROAS vs. CAC tables for efficiency.
- Structure reports from high-level overview → drill-down insights → recommendations so readers follow a clear logical flow.
A best practice is to align visuals with the narrative: instead of showing “ROAS per channel,” explain why one channel outperforms others and what the implications are for budget allocation.
Step 5: Analyze and Formulate Recommendations
This is where reporting becomes a strategy. Analysis should go beyond “what happened” to uncover:
- Trends: Sustained improvements or declines across channels.
- Anomalies: Sudden changes in performance requiring root-cause investigation.
- Business impact: Linking metrics back to revenue, CAC efficiency, or pipeline velocity.
From this foundation, develop actionable recommendations:
- Scale channels with sustainable CAC and high ROAS.
- Address underperforming campaigns with creative refreshes or audience refinements.
- Reallocate budget away from inefficient segments to maximize overall ROI.
Each recommendation should be specific, measurable, and financially aligned, turning the report into a roadmap for continuous optimization and growth.
How to Choose Your Reporting Frequency
The ideal reporting frequency depends heavily on your marketing goals, the pace of your campaigns, and the target audience for the report.
Different cadences serve different strategic purposes.
Daily Reports: For Fast-Paced Campaigns
Daily reporting is essential in environments where performance shifts rapidly and delayed action can result in wasted spend or missed opportunities. They are most valuable for channels and campaigns with high budget velocity, auction-driven variability, or ongoing experimentation.
Examples of reports with a daily cadence:
- PPC Performance Monitoring (Google Ads, Bing Ads, etc.): Tracks spend pacing, detects anomalies like budget overruns, disapproved ads, or sudden changes in auction dynamics.
- E-commerce Revenue & Orders Report: Captures daily sales, AOV, and CAC by channel, critical for managing promotions or inventory-sensitive campaigns.
- Email Campaign Health Report: Tracks open rates, click-through rate, deliverability, and unsubscribes to safeguard deliverability during frequent sends.
- Budget Pacing Report: Compares actual vs. planned spend across accounts, preventing overspend and enabling mid-flight budget reallocation.
Weekly Reports: For Team-Level Adjustments
Weekly reports strike the right balance between data stability and agility. They provide enough volume of data to identify meaningful trends while still allowing teams to adjust tactics before small inefficiencies compound into larger issues.
This cadence is particularly useful for internal team reviews, short-term planning, and ensuring campaigns remain aligned with near-term goals.
Examples of reports with a weekly cadence:
- Channel Performance Report: Compares spend, CTR, conversion rates, and ROAS across search, social, email, and organic channels to guide weekly optimizations.
- Lead Generation & Funnel Report: Tracks MQLs, SQLs, and pipeline contributions to validate whether campaigns are driving qualified demand.
- Creative & Messaging Performance Report: Reviews and creatives, subject lines, and landing pages to identify fatigue and inform content refreshes.
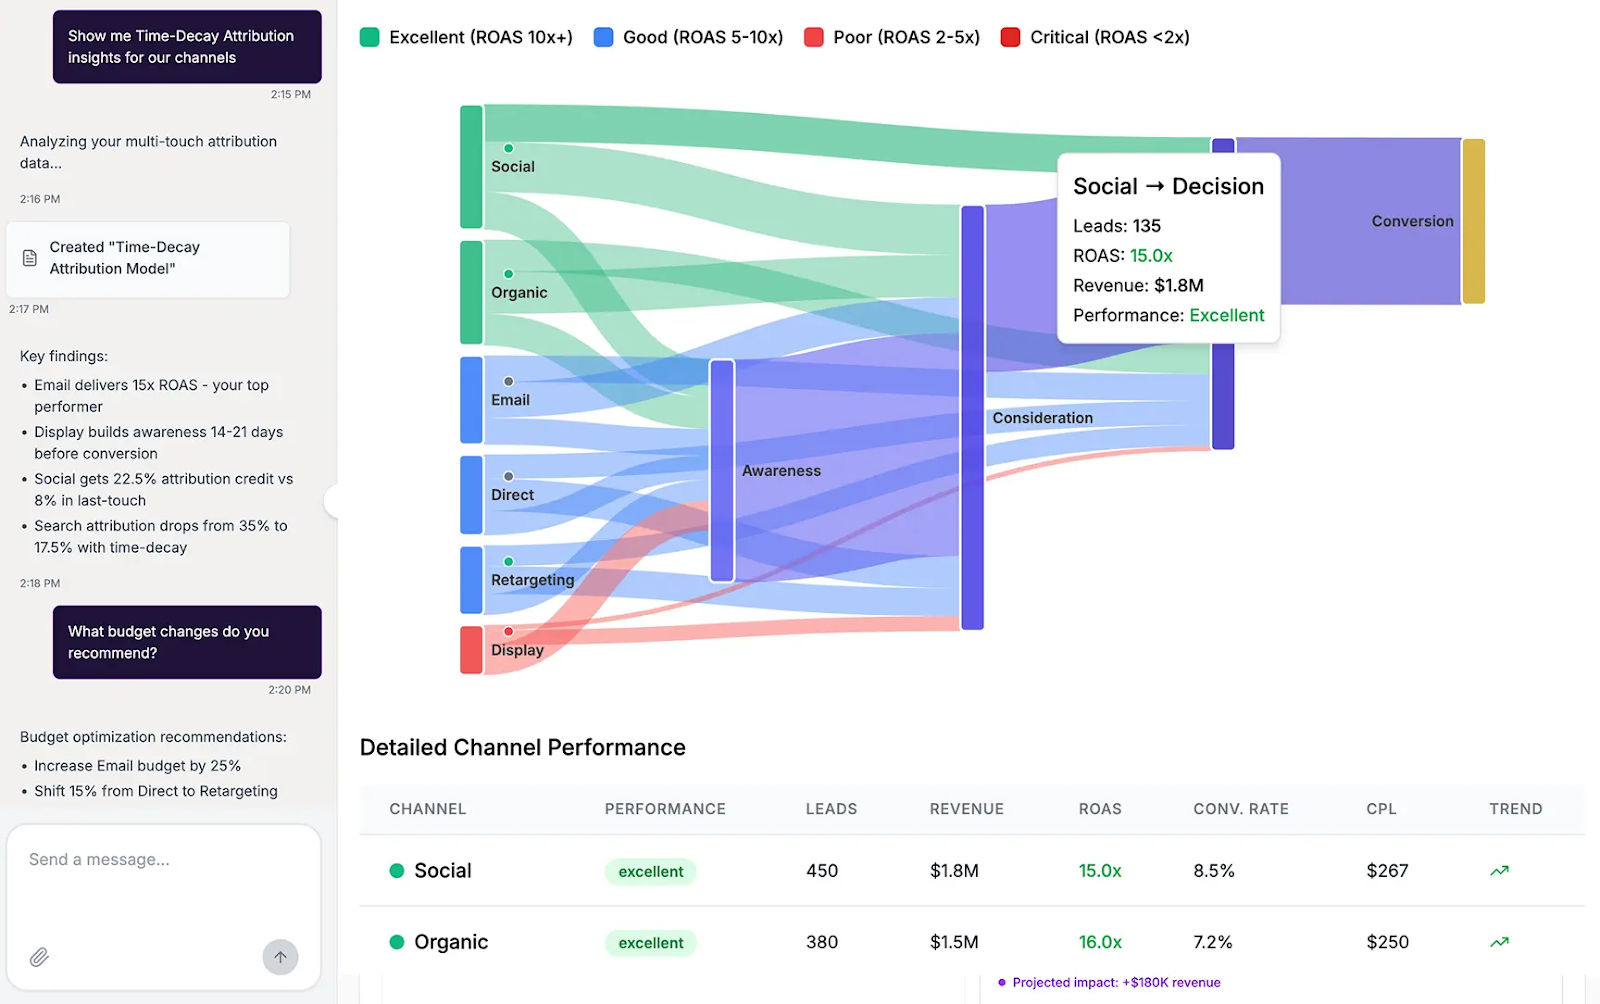
- Attribution Snapshot: Evaluates multi-touch contributions at the channel level to adjust short-term budget allocations.
Monthly Reports: For Strategic Trend Analysis
Monthly marketing reports provide the necessary perspective to evaluate broader marketing performance. With a larger data set, these reports smooth out short-term fluctuations and highlight meaningful trends that inform mid-term strategy.
This cadence is best suited for assessing the cumulative impact of campaigns, tracking progress against quarterly or annual goals, and aligning marketing activity with business outcomes.
Monthly marketing reports are also a standard deliverable for client-facing reporting.
Examples of reports with a monthly cadence:
- Cross-Channel Performance Report: Consolidates results from paid, organic, email, and social channels to evaluate efficiency, ROI, and channel contribution to pipeline.
- Customer Acquisition & Retention Report: Analyzes CAC, LTV, churn, and retention trends to connect marketing efforts with customer lifecycle value.
- Attribution & ROI Report: Provides a deeper view of multi-touch attribution models, showing how campaigns work together to drive conversions and revenue.
- Budget Utilization & Forecast Report: Summarizes monthly spend vs. budget, identifies over- or under-investment, and informs reallocation for upcoming months.
- Content & SEO Performance Report: Tracks organic traffic, keyword movements, content engagement, and contribution to lead generation.
Quarterly Reports: For High-Level Business Reviews
Quarterly reports shift the lens from campaign execution to strategic business impact. This cadence provides senior leadership and the C-suite with a consolidated view of how marketing contributes to enterprise objectives such as revenue growth, market expansion, and customer retention. Unlike daily or weekly reports, the focus here is not tactical adjustments but rather long-term planning, budget allocation, and performance against strategic goals.
These reports should integrate marketing metrics with financial and operational KPIs, bridging the gap between marketing activity and business outcomes. They often serve as the foundation for board meetings, budget reviews, and resource planning cycles.
Examples of reports with a quarterly cadence:
- Marketing ROI and Business Impact Report: Connects marketing spend to revenue growth, pipeline contribution, and customer acquisition efficiency.
- Channel Profitability Analysis: Evaluates which channels are delivering sustainable returns when viewed over a multi-quarter period.
- Customer Lifecycle / LTV Report: Examines retention, churn, upsell, and cross-sell performance to validate long-term customer value.
- Market Expansion and Regional Performance Report: Tracks campaign impact in new geographies or market segments against growth objectives.
- Budget Allocation & Forecast Report: Reviews quarterly spend vs. outcomes to guide next-quarter investments and reallocation decisions.
- Strategic Initiative Review: Measures the results of major initiatives (e.g., product launches, brand repositioning, large-scale demand generation programs).
Automating Your Marketing Reports to Save Time
Manual marketing reporting is a time-consuming and error-prone process that drains valuable resources from marketing teams. Automating this process is no longer a luxury but a necessity for modern marketing operations.
The Challenge of Manual Data Collection
Marketing data lives across dozens of systems: Google Analytics, Google Ads, social platforms, CRM tools, marketing automation systems, and more. Manually extracting, cleaning, and merging this data into a single report introduces serious risks:
- Time drain – reporting cycles stretch into days or weeks.
- Human error – mismatched naming conventions, missing data, and misaligned attribution that will affect decision-making.
- Delayed insights – leadership receives outdated information, slowing strategic decisions.
This fragmented, labor-intensive process diverts resources away from strategy and optimization, the very areas where marketing teams should be focusing.
Leveraging Marketing Reporting Tools and Dashboards
Modern marketing operations demand automated pipelines and robust marketing reporting tools.
Instead of relying on spreadsheets and manual exports, platforms like Improvado connect directly to 1,000+ data sources, including Google Ads, LinkedIn, HubSpot, Salesforce, and beyond, automating extraction, normalization, and consolidation.
With Improvado’s automated reporting framework, teams can:
- Eliminate manual prep: No more CSV exports or copy-paste extractions, Improvado consolidates data from all online, offline, in-house, and legacy systems.
- Standardize taxonomies: Enforce governance rules for campaign naming, UTMs, and metrics across all accounts.
- Accelerate insight delivery: Build real-time dashboards that update automatically, reducing reporting cycles from weeks to minutes.
- Build AI-powered reports: Build dashboards and reports from prompts in natural-language, get AI recommendations and insights.
This transforms reporting into a continuous process rather than a monthly scramble.
Benefits of a Centralized Data Warehouse
For organizations with complex account hierarchies and multiple channels, automation doesn’t stop at dashboards. The goal is to build reliable end-to-end pipelines that flow into a centralized data warehouse.
Improvado integrates directly with leading destinations like BigQuery, Snowflake, AWS S3, Redshift, and Databricks, creating a governed single source of truth. From there, data feeds seamlessly into BI tools like Tableau, Looker, or Power BI for advanced analysis.
The benefits are clear:
- Consistency: Harmonized metrics across all campaigns and platforms.
- Scalability: New data sources can be onboarded without redesigning workflows.
- Depth of analysis: Cross-channel attribution, cohort tracking, and revenue alignment become achievable without manual intervention.
Common Types of Marketing Reports (With Examples)
While the core principles of marketing reporting remain consistent, the specific metrics and focus will vary depending on the marketing channels or areas being evaluated.
Here are some common marketing report templates and examples.
General Marketing Performance Report
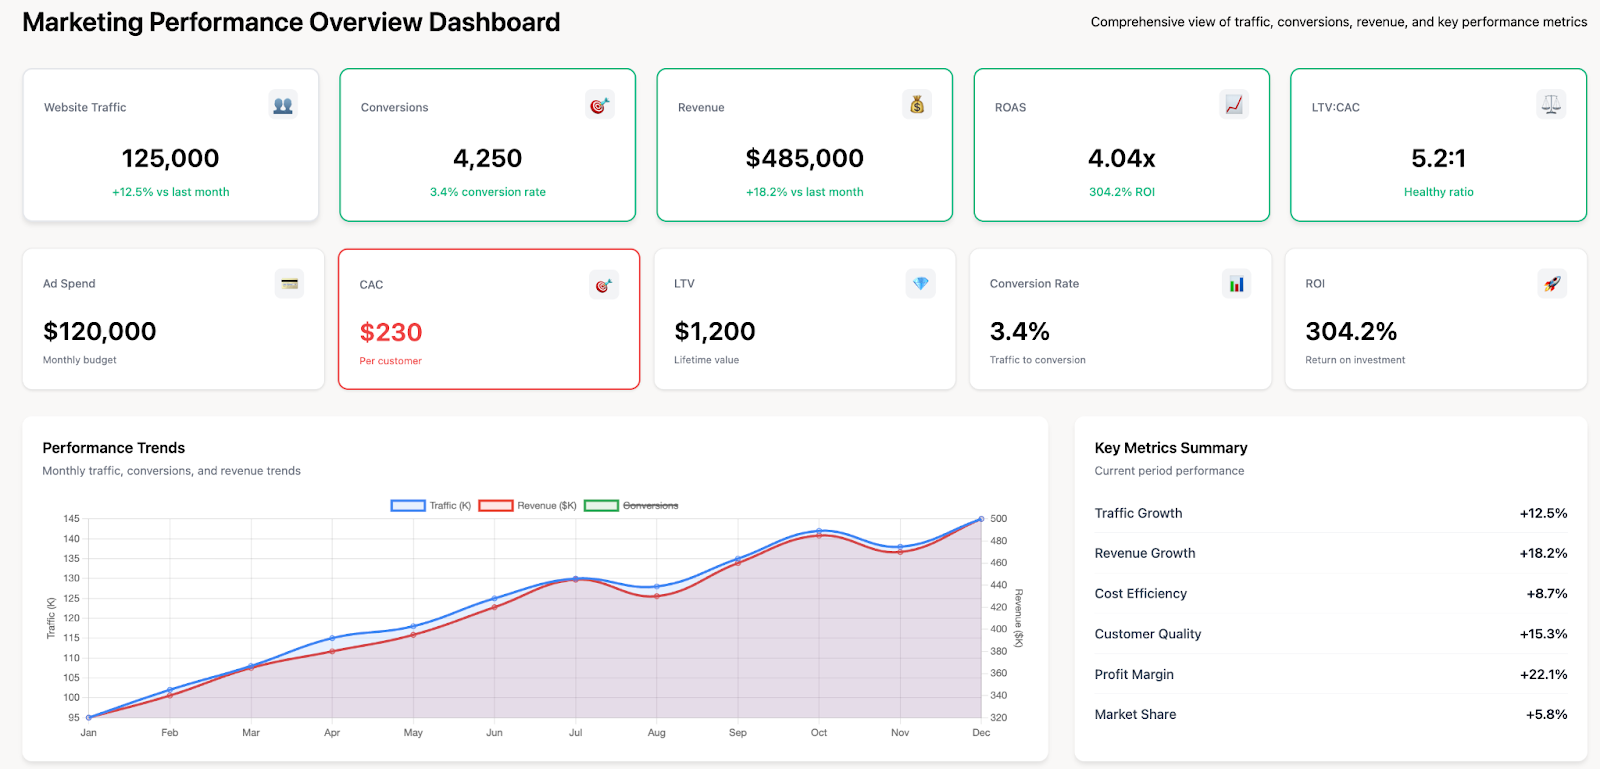
A General Marketing Performance Report provides a holistic, executive-level view of marketing effectiveness across all channels that helps leadership evaluate how marketing contributes to business growth and financial performance.
This type of report highlights both efficiency metrics and strategic outcomes.
In the example dashboard, metrics such as website traffic, conversions, and revenue provide volume indicators, while CAC, LTV, ROAS, and LTV:CAC ratio measure efficiency and sustainability. Together, they connect marketing execution with profitability and long-term customer value.
Why this matters:
- For marketing leadership, it validates ROI and supports strategic budget planning.
- For operations, it ensures that campaign data aligns with profitability benchmarks and growth KPIs.
- For the C-suite, it demonstrates marketing’s role as a revenue-driving function, not just a cost center.
Web Analytics & Website Performance Report
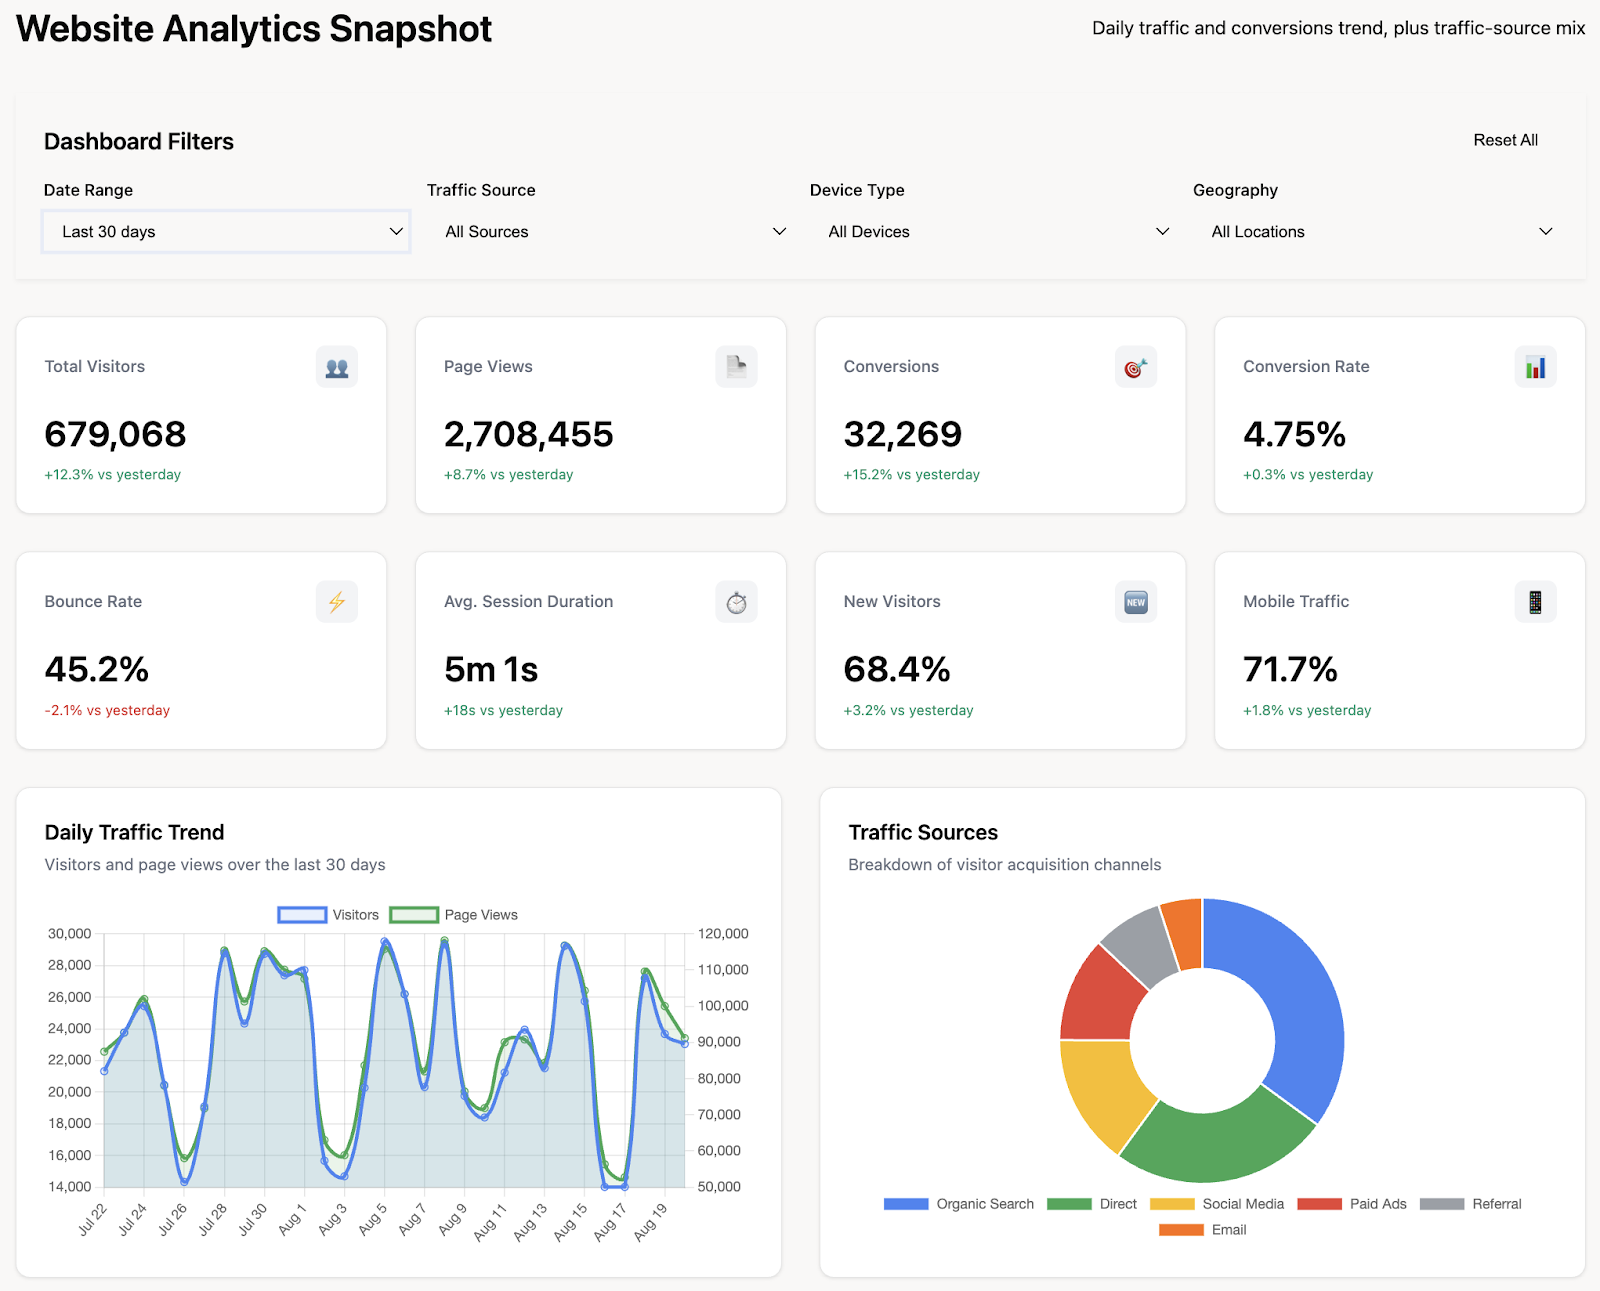
A Web Analytics & Website Performance Report provides a comprehensive view of how users interact with your site, combining traffic, engagement, and conversion metrics into a single snapshot.
In the example dashboard, performance is broken down across multiple dimensions:
- Volume Metrics: Total visitors and page views track reach and engagement scale.
- Conversion Metrics: Conversions and conversion rate reveal how effectively the site turns visitors into leads or customers.
- Engagement Metrics: Bounce rate and average session duration uncover user intent, content relevance, and potential friction.
- Audience Insights: New visitors and mobile traffic share inform acquisition health and device optimization priorities.
- Acquisition Mix: Traffic source breakdown shows which marketing channels drive volume and conversions.
SEO Marketing Report
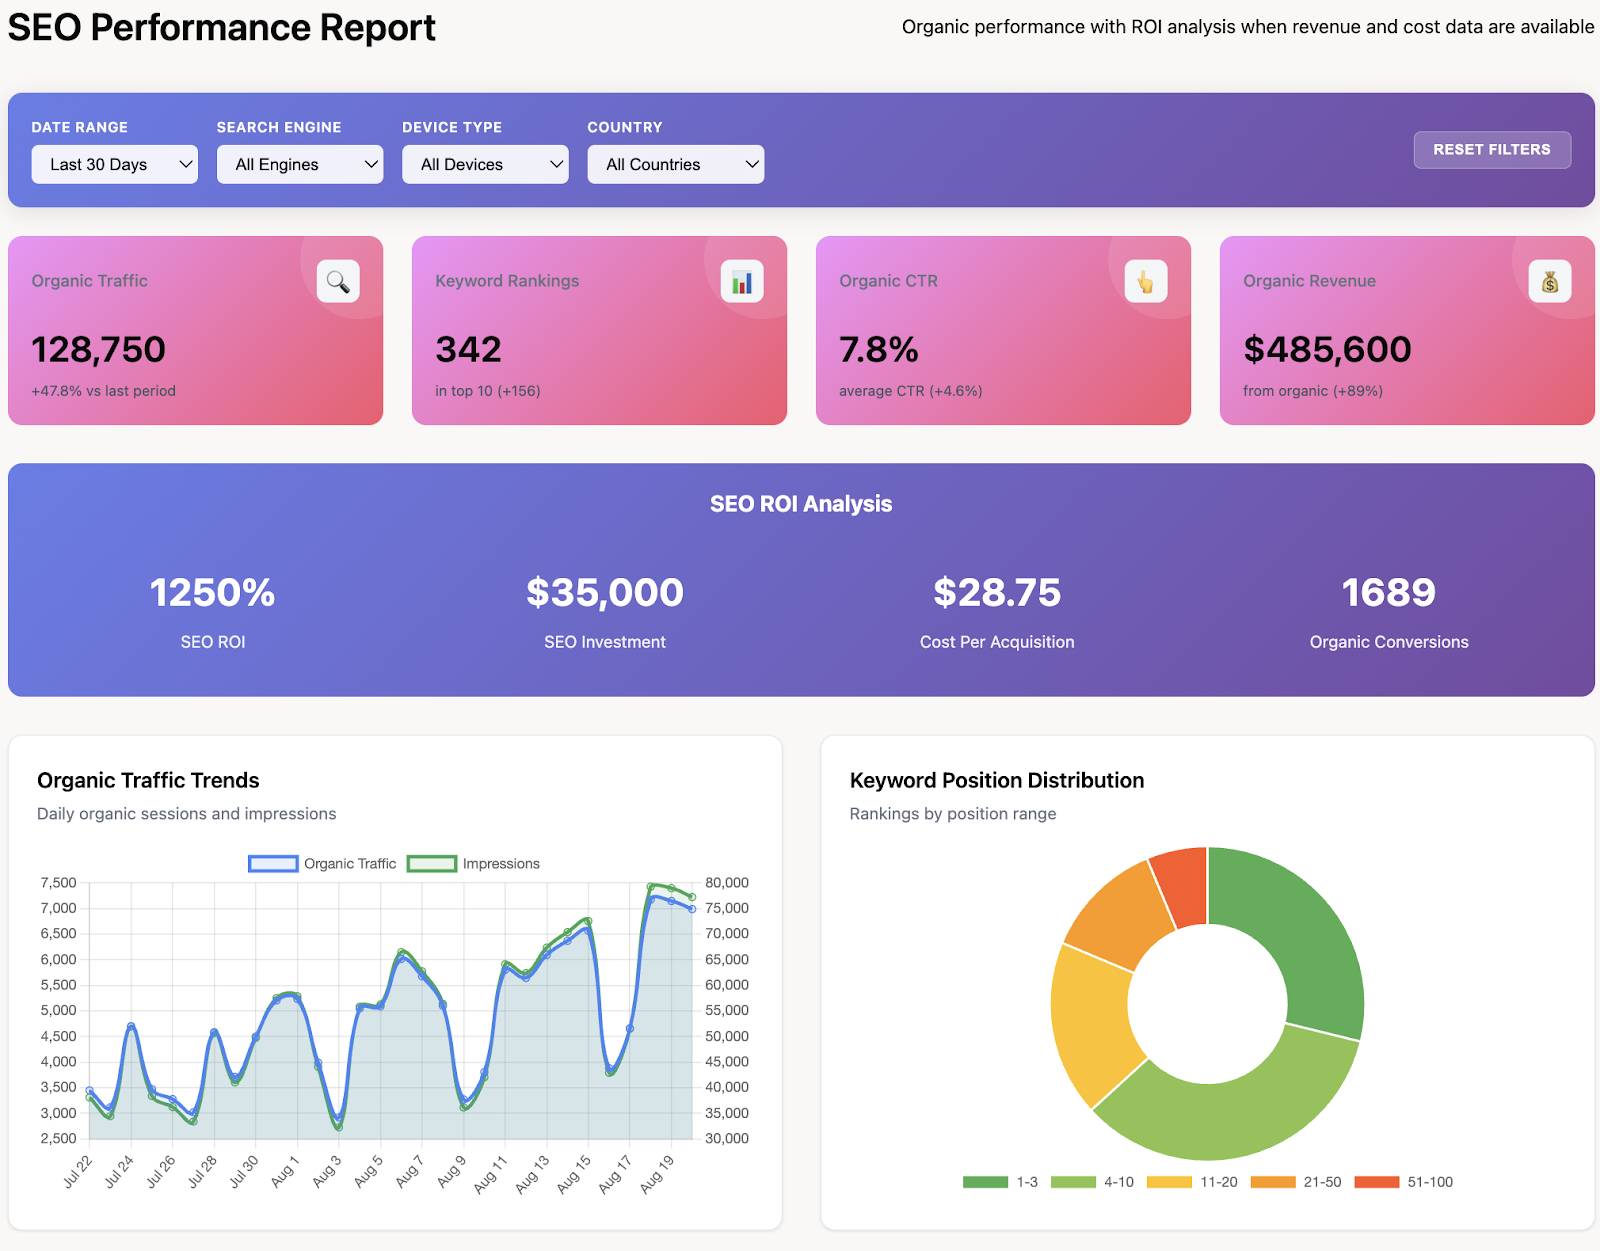
An SEO Marketing Report provides a comprehensive view of organic search performance and its contribution to revenue growth. By consolidating traffic, ranking, and ROI data, it enables teams to measure the effectiveness of SEO strategies, validate investment decisions, and uncover opportunities for further optimization.
In the example dashboard, performance is evaluated across several dimensions:
- Organic Traffic & CTR highlight visibility and engagement from search.
- Keyword Rankings measure competitive share of voice.
- Revenue Contribution demonstrates SEO’s direct financial impact.
- Conversions & Efficiency — 1,689 organic conversions at a $28.75 CPA quantify efficiency, while a 1250% ROI validates SEO as a profitable acquisition channel.
Why this matters:
- For marketing leadership, it validates SEO as a revenue-driving channel with clear ROI.
- For operations, it highlights keyword clusters, CTR trends, and conversion efficiency, guiding technical and content prioritization.
- For executives, it connects SEO investments to tangible business outcomes such as revenue, ROI, and customer acquisition costs.
PPC Marketing Report (Google Ads, Paid Social)
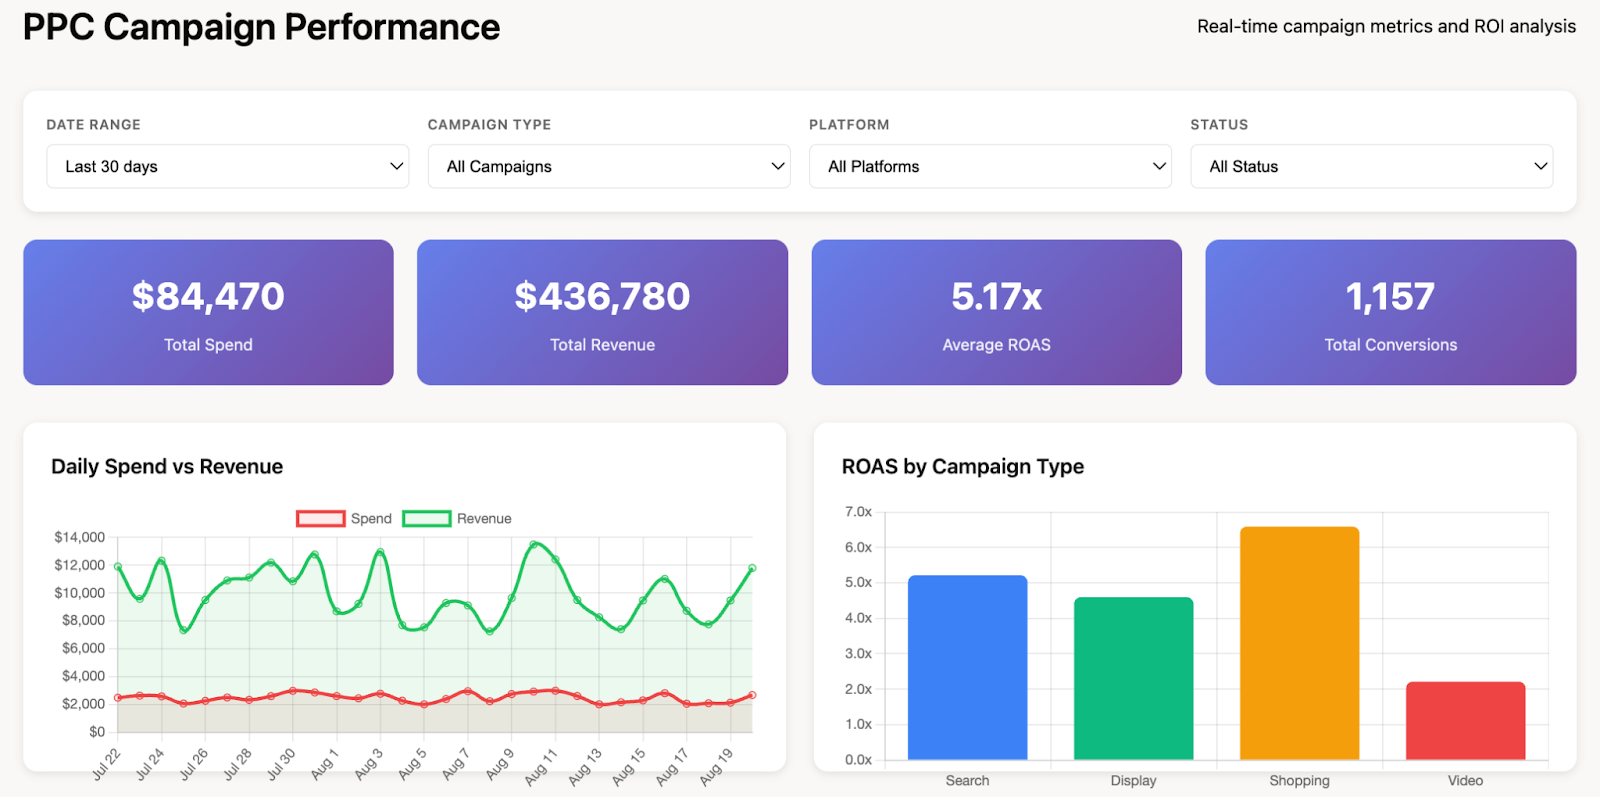
A pay-per-click (PPC) Marketing Report provides a comprehensive view of paid media performance across platforms such as Google Ads, Facebook Ads, LinkedIn Ads, and others. By consolidating campaign data into a single dashboard, it enables marketing and operations teams to assess the efficiency and profitability of ad spend in real time.
The report tracks a set of core PPC metrics that directly influence budget and optimization decisions:
- Ad Spend: Total investment allocated across campaigns.
- Revenue and Conversions: Output generated by PPC activities, connecting spend to tangible outcomes.
- ROAS: Efficiency metric showing how effectively advertising dollars generate revenue.
- CTR and CPC: Indicators of campaign engagement and auction competitiveness.
- Cost per Conversion: The average cost to acquire a customer or lead through paid channels.
Visual breakdowns such as spend vs. revenue trends and ROAS by campaign type provide context for daily performance and channel-level comparisons. This allows teams to quickly identify high-yield campaigns, underperforming ad types, or overspending risks.
Social Media Marketing Report
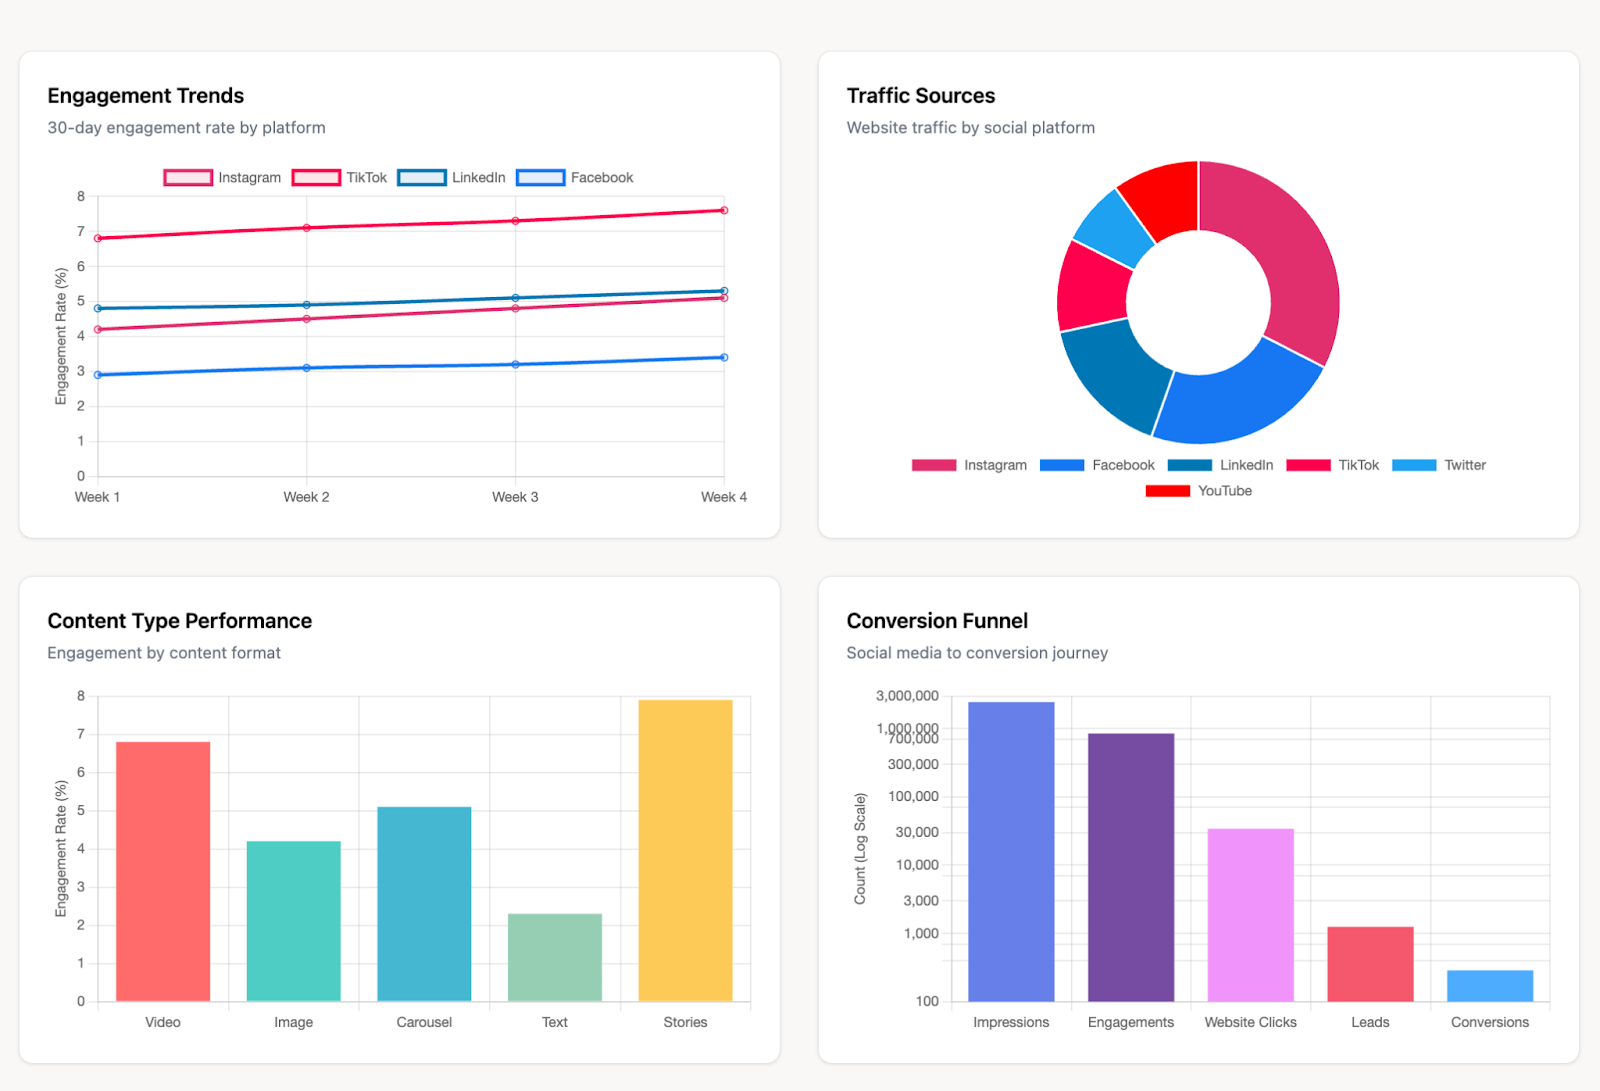
A Social Media Marketing Report provides a comprehensive view of how social channels contribute to brand visibility, audience engagement, and conversions. By consolidating metrics across platforms, it enables teams to evaluate campaign effectiveness and optimize content strategies for maximum impact.
In the example dashboard, performance is broken into several critical dimensions:
- Engagement Trends: Tracks how engagement rates evolve across platforms (e.g., Instagram, TikTok, LinkedIn, Facebook) to identify where audience activity is accelerating or declining.
- Traffic Sources: Highlights the contribution of each social platform to website traffic, offering clarity on which channels are driving the highest acquisition.
- Content Type Performance: Measures engagement across formats such as video, images, carousels, stories, and text, informing content strategy and investment priorities.
- Conversion Funnel: Visualizes the journey from impressions to engagements, website clicks, leads, and final conversions, helping assess where drop-offs occur in the social-to-revenue pipeline.
Email Marketing Report
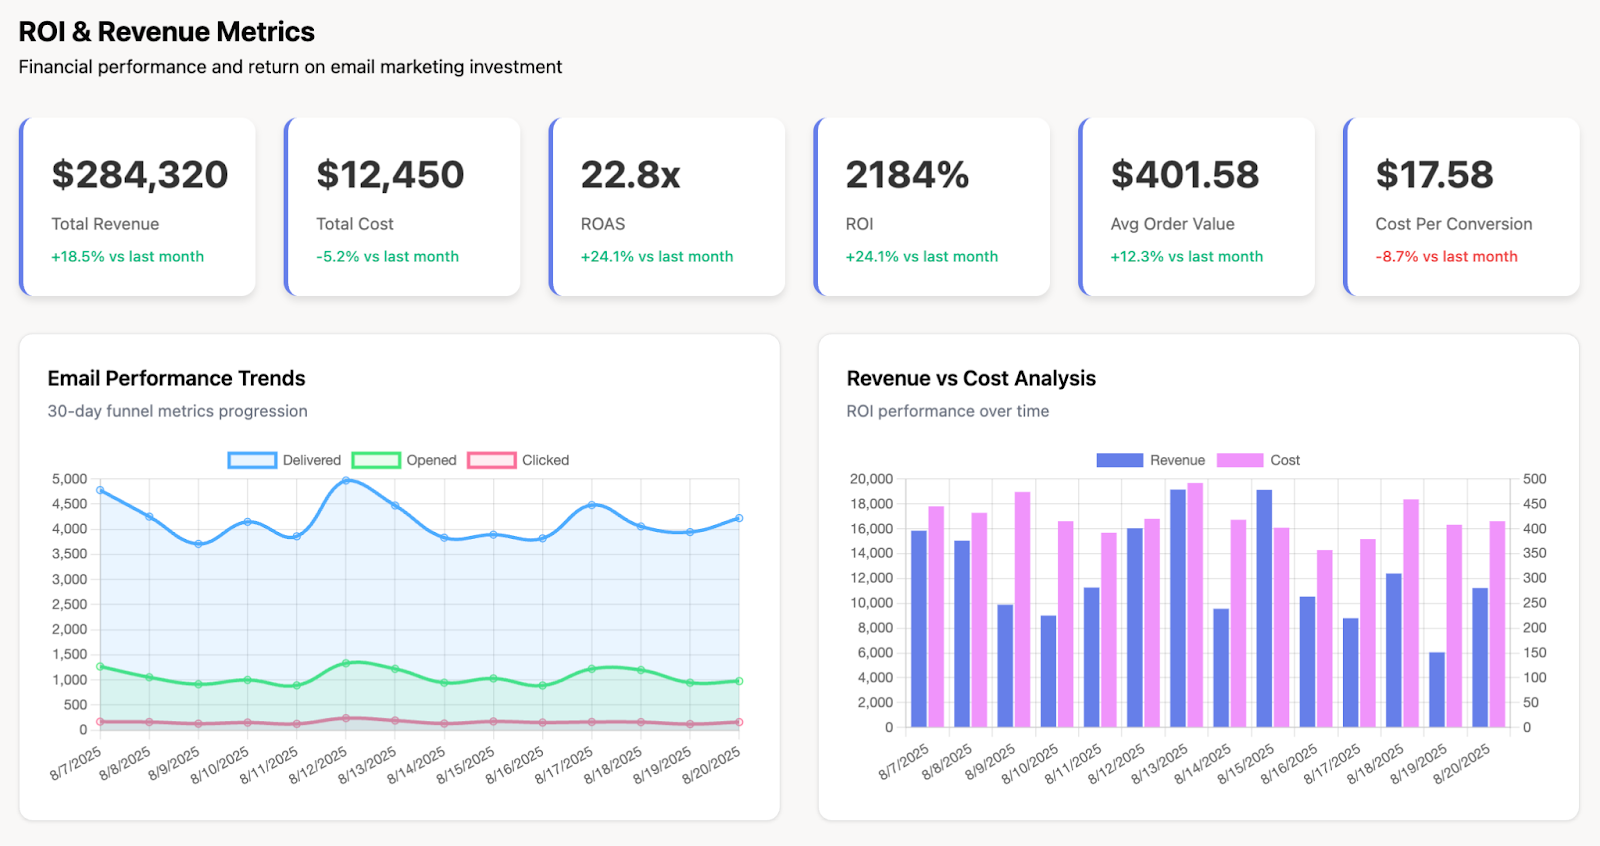
An Email Marketing Report provides a comprehensive view of email campaign performance and its direct contribution to revenue. By tracking engagement, conversion efficiency, and ROI, it enables teams to evaluate how effectively email supports customer acquisition, retention, and upsell initiatives.
In the example dashboard, email performance is assessed across multiple dimensions:
- Financial Metrics: Revenue, total cost, ROAS, ROI, average order value, and cost per conversion establish the business impact of email campaigns.
- Engagement Funnel Metrics: Delivered, opened, and clicked emails show how recipients progress through the engagement funnel, highlighting drop-off points.
- Conversion Performance: Tracks how efficiently email drives conversions, tying engagement activity back to customer actions and revenue outcomes.
- Revenue vs. Cost Analysis: Compares campaign costs against generated revenue over time, ensuring email investments remain profitable and scalable.
E-commerce Marketing Report
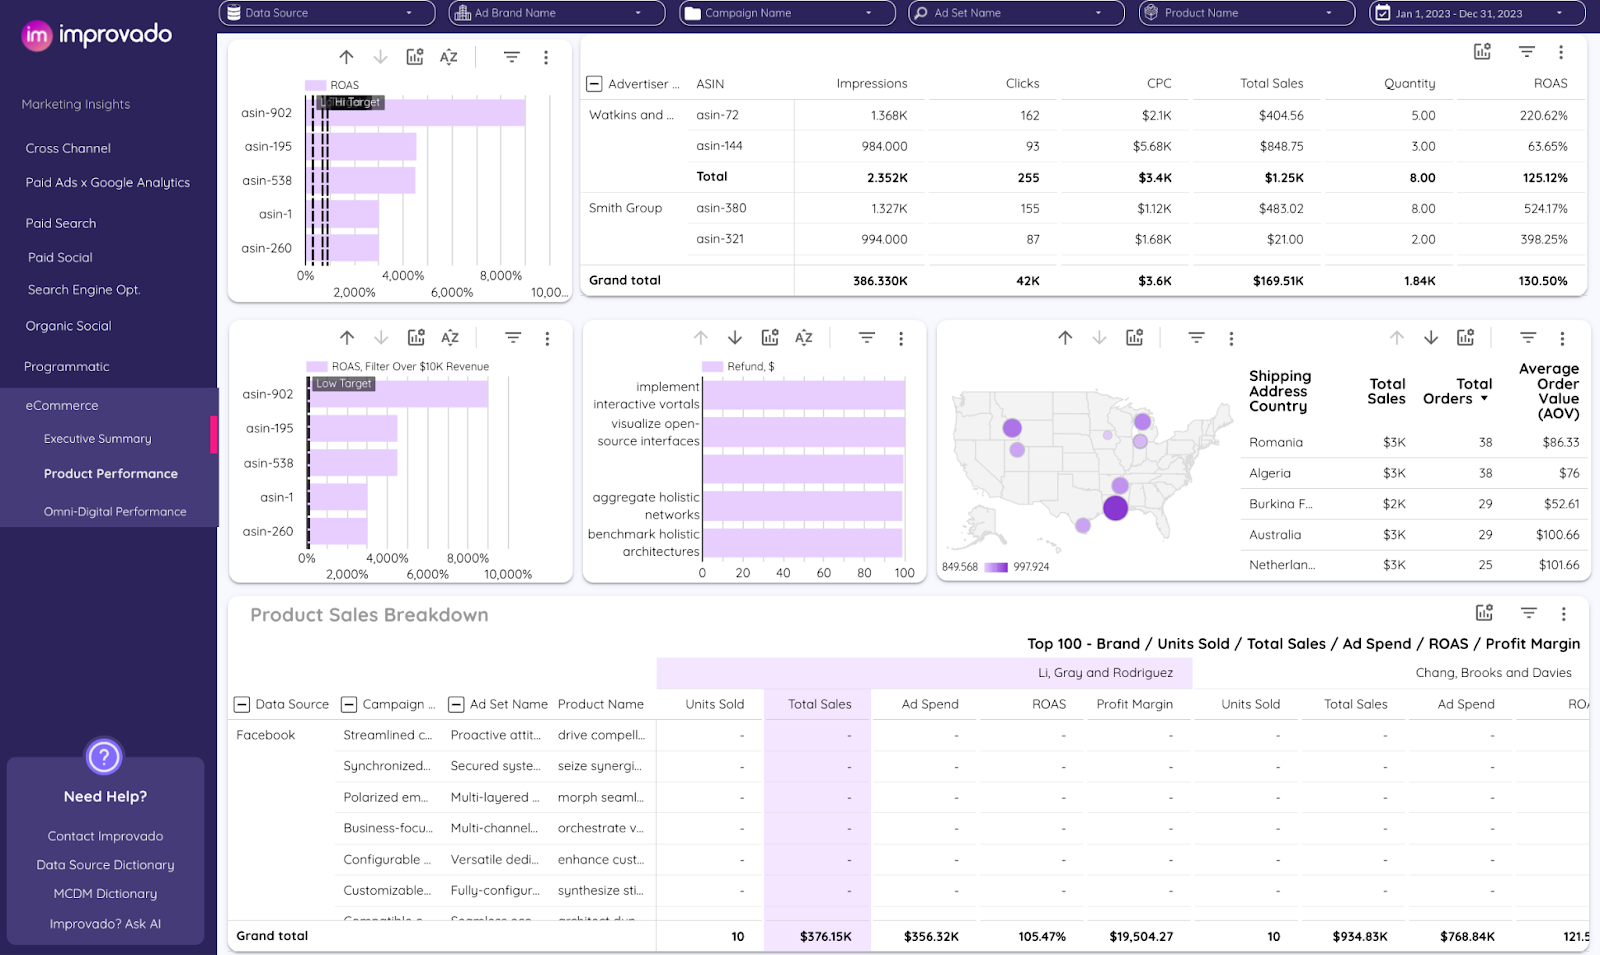
An E-commerce Marketing Report provides a comprehensive view of digital store performance, combining marketing efficiency metrics with sales and customer behavior data. By capturing results across the entire funnel, it enables operations, marketing, and leadership teams to align acquisition strategies with profitability and customer lifetime value.
In the example dashboard, performance is analyzed across several layers:
- Sales & Revenue Metrics: Total sales, units sold, and revenue breakdowns highlight overall business impact.
- Efficiency Metrics: ROAS, profit margin, and CAC connect marketing investments directly to profitability and cost efficiency.
- Customer Value Indicators: Average order value (AOV) and lifetime value (LTV) reveal revenue sustainability and purchasing behavior.
- Product & Campaign Breakdown: Granular reporting by brand, product, campaign, or ad set uncovers which levers drive the highest return.
- Geographic Insights: Country-level breakdowns show regional sales performance, helping guide market expansion and localization strategies.
- Refund & Return Metrics: Identifies post-purchase inefficiencies that impact profit margins and customer satisfaction.
From Data to Reports in Minutes, Not Weeks
Enterprises can no longer afford to wait weeks for manual reporting cycles. The speed of decision-making depends on how quickly raw data can be transformed into reliable, actionable reports.
With Improvado, reporting is automated end-to-end.
The platform connects to 1,000+ marketing and sales data sources, harmonizes metrics, and delivers analytics-ready datasets directly into your BI tools or custom dashboards. Instead of wasting time on manual prep, teams get consistent, real-time insights to optimize campaigns and align spend with revenue outcomes.
Ready to cut reporting time and unlock faster decisions? Book a demo with Improvado and see how to go from data to reports in minutes.
Related reading: 20 Best Digital Marketing Tools for 2026 [Expert Guide], Monthly Marketing Report Template Guide (2026), Best Report Garden Alternatives (2026 Comparison)