Manually exporting Facebook Ads data into spreadsheets is a familiar ritual for marketers. But familiar does not mean effective. The process is slow, repetitive, and error-prone. Hours go into copying data, fixing formulas, and rebuilding reports. By the time analysis begins, the numbers are already outdated.
There is a better way. Automated Facebook Ads reporting replaces manual exports with continuous data delivery. Campaign data flows directly into a centralized environment, ready for analysis and decision-making. This shifts reporting from a weekly task to an always-on performance engine. This guide explains how to make that transition.
Key Takeaways:
- Automation eliminates hours of manual data collection. It frees up your team to focus on strategy and optimization instead of tedious report building.
- Automated systems provide real-time data. This enables you to spot trends, fix issues, and capitalize on opportunities as they happen, not days later.
- Centralizing data from Facebook Ads and other channels creates a single source of truth. This leads to more accurate insights and a holistic view of your marketing performance.
- Effective automation requires tracking the right KPIs. Go beyond vanity metrics to focus on conversion rates, ROAS, and customer lifetime value.
- The right reporting tool is crucial. Look for platforms that offer robust data integration, customizable dashboards, and scalable solutions for growing businesses.
Quick answer
A Facebook Ads report template is a pre-built dashboard or spreadsheet structure that displays key campaign metrics like impressions, clicks, conversions, CPA, ROAS, and CTR. Automated templates pull data directly from the Facebook Ads API into centralized dashboards, eliminating manual CSV exports and providing real-time performance insights for faster optimization decisions.
Why Manual Facebook Ads Reporting Fails Modern Marketers
The pace of digital marketing demands agility. Manual reporting processes, however, are fundamentally slow and rigid. They create a significant gap between data generation and actionable insight.
This gap is where opportunities are lost and budgets are wasted.
The Time Sink of Manual Data Extraction
Every week, marketers spend countless hours navigating the Facebook Ads Manager interface. They download CSVs, clean up messy data, and struggle to merge it with information from other platforms. The data preparation process can take over 90 hours a week.
This repetitive labor is not just inefficient; it's a significant drain on valuable, strategic resources. A single comprehensive report can take a full day to assemble, time that could be spent optimizing campaigns or developing new creative strategies.
The High Risk of Human Error
Manual data handling is a recipe for errors. A simple copy-paste mistake, a misplaced decimal, or an incorrect formula can skew an entire report. These inaccuracies lead to flawed conclusions and misguided decisions.
When you're managing significant ad spend, a small reporting error can have major financial consequences. Automation removes this risk by creating a direct, error-free pipeline from the data source to your dashboard.
Stale Data Leads to Missed Opportunities
By the time a manual report is compiled and distributed, the data is often hours or even days old. In the fast-moving world of Facebook advertising, this delay can be costly.
A high-performing ad might be scaling too slowly, or a failing ad might be burning through the budget unchecked. Real-time data, delivered through automated reporting, is essential for making timely optimizations that maximize performance.
Lack of Granularity and Depth
Facebook Ads Manager provides a wealth of data, but getting granular insights manually is challenging.
For example, Native Meta tools like Ads Manager restrict historical data retention, blocking year-over-year analysis and cross-channel joins, leading to incomplete ROAS views. Manual CSV exports cause version drift, inconsistencies, and errors, with the majority of teams reporting discrepancies from mis-tagged campaigns or attribution mismatches.
The Power of Automated Facebook Ads Reporting
Transitioning to an automated reporting system is a strategic upgrade for your entire marketing operation. Automation empowers teams with the accuracy, speed, and depth of insight needed to compete effectively. It shifts the focus from data collection to data interpretation and strategic action.
Ensure Data Accuracy and Consistency
Automated data pipelines eliminate the manual steps where errors most often occur.
By pulling data directly from the Facebook Ads API, these systems ensure that your reports are consistently accurate and reliable. This builds trust in your data across the organization. It allows stakeholders to make decisions with confidence, knowing they are based on a single source of truth.
Before Booyah Advertising implemented Improvado, their analytics team struggled with frequent data quality issues. Entire days of data were missing, duplicates distorted performance metrics, and aggregation across over 100 clients required extensive manual reconciliation.
After the migration, Booyah achieved 99.9% data accuracy and cut daily budget-pacing updates from hours to 10-30 minutes. Improvado’s unified pipelines, standardization logic, and real-time refresh capability gave the agency full visibility and control over multi-source data (15–20 feeds per client).
“We never have issues with data timing out or not populating in GBQ. We only go into the platform now to handle a backend refresh if naming conventions change or something. That's it.
With Improvado, we now trust the data. If anything is wrong, it’s how someone on the team is viewing it, not the data itself. It’s 99.9% accurate.”

Gain Real-Time Performance Insights
The most significant advantage of automation is access to live data.
Your dashboards are always up-to-date, reflecting campaign performance as it happens. This allows you to monitor key metrics like Cost Per Acquisition (CPA), Return on Ad Spend (ROAS), and Click-Through Rate (CTR) in real time.
You can immediately identify performance dips or spikes and take action to optimize your campaigns for better results.
Improve Team Efficiency and Focus
By automating repetitive reporting tasks, you free up your team's time and mental energy.
Analysts and campaign managers can stop being data wranglers and start being strategists. They can dedicate their expertise to analyzing trends, testing new hypotheses, and developing creative solutions.
This shift leads to a more engaged, proactive, and effective marketing team.
Before centralizing marketing data and intelligence, preparing reports at Signal Theory was a labor-intensive process, often taking four hours or more per report. Switching to Improvado reduced that time by over 80%, making reporting significantly more efficient and far less stressful.
Such drastic reductions in reporting overhead translate into faster insights and faster pivots when needed.
"Reports that used to take hours now only take about 30 minutes. We're reporting for significantly more clients, even though it is only being handled by a single person. That's been huge for us.”

Scale Your Reporting Efforts Effortlessly
As your business grows, so does the complexity of your advertising. You may launch more campaigns, target new audiences, or expand to new platforms. Manual reporting simply cannot keep up.
An automated system scales with you. It can handle increasing data volumes and additional data sources without requiring more manual effort, ensuring your reporting capabilities grow alongside your marketing activities.
Core Components of an Effective Automated Reporting System
Not all automated reporting solutions are created equal. A truly effective system is built on a foundation of robust data integration, powerful visualization, and intelligent features that simplify the analytical process. When evaluating tools, look for these essential components to ensure you're investing in a platform that will meet your long-term needs.
Seamless Data Integration
The foundation of any automated reporting system is data integration. If data cannot be collected reliably and consistently, automation breaks before analysis begins. A robust system must provide a stable, pre-built connector to the Facebook Ads API, with scheduled refreshes and error monitoring.
Effective reporting also requires more than a single-source connection. Facebook Ads performance does not exist in isolation. A complete system integrates Google Ads, LinkedIn Ads, TikTok Ads, analytics platforms, CRM systems, and revenue data. Centralizing these sources is what enables cross-channel performance measurement instead of platform-by-platform reporting.
Improvado is built specifically for this aggregation layer. It connects your marketing ecosystem into a centralized data foundation and automates the heavy lifting that is hard to do manually.
Key features that support seamless integration and automated reporting include:
- 1,000+ native connectors that ingest data from Facebook Ads and all major marketing, analytics, and revenue platforms.
- Automated API refresh scheduling with monitoring and error handling to ensure continuity.
- Centralized data storage that houses raw and processed data for reporting and analysis.
- Schema standardization to unify campaign naming, metrics, and event definitions across sources.
- Identity and entity mapping to align audiences, campaigns, and products across systems.
- Automated transformations for consistent reporting-ready datasets in your warehouse or BI tool.
With these capabilities in place, reporting shifts from collecting data to interpreting it.
Customizable Dashboards and Visualizations
Raw data is not insight. An effective reporting system must turn unified data into clear, decision-ready views. Teams need dashboards that reflect their specific KPIs, business logic, and reporting cadences without relying on technical resources or manual report builds.
This is where Improvado AI Agent becomes the next step in reporting. The Agent connects directly to your governed marketing dataset and builds dashboards and reports from natural-language requests.
Teams describe the view they need in plain English. The Agent generates visualizations, applies the correct metric definitions, and delivers ready-to-use dashboards. These dashboards can be refined through follow-up prompts, saved for ongoing use, refreshed automatically, and shared with stakeholders.
Scheduled Reporting and Alerts
Automation should extend beyond data collection. The system should allow you to schedule reports to be sent automatically to key stakeholders via email or Slack. This ensures everyone stays informed without having to log into a dashboard.
Furthermore, intelligent alerting features can notify you of significant changes in performance, such as a sudden spike in CPA or a drop in conversion rate, enabling you to react quickly.
Data Transformation and Normalization
Marketing data is often messy and inconsistent. For example, campaign naming conventions can vary across platforms. A powerful automation platform includes tools to clean, transform, and normalize your data.
This process, often called ETL (Extract, Transform, Load), ensures that metrics are comparable across different channels, creating a clean and reliable dataset for analysis in your marketing data warehouse.
Key Facebook Ads Metrics You MUST Track
To get the most out of automated reporting, you need to track the right metrics.
A comprehensive automated dashboard should provide a multi-faceted view of performance, covering everything from initial audience engagement to final revenue generation.
Top-of-Funnel & Awareness Metrics
- Impressions: The total number of times your ad was displayed on screen.
- Reach: The number of unique people who saw your ads.
- Frequency: The average number of times each person saw your ad. Monitoring this helps prevent ad fatigue.
- Cost Per 1,000 Impressions (CPM): The cost to generate 1,000 impressions. A key metric for gauging the cost-efficiency of your reach.
Engagement & Consideration Metrics
- Link Clicks: The number of clicks on links within your ad that led to destinations on or off Facebook.
- Click-Through Rate (CTR): The percentage of impressions that resulted in a link click. A strong indicator of ad relevance and creative effectiveness.
- Cost Per Click (CPC): The average cost you pay for each link click. Crucial for managing budget efficiency.
- Engagement Rate: The percentage of people who saw your ad and engaged with it (likes, comments, shares, clicks).
Conversion & Performance Metrics
- Conversions: The number of desired actions completed (e.g., purchases, lead form submissions, sign-ups). This is the ultimate measure of campaign success.
- Conversion Rate (CVR): The percentage of ad clicks that resulted in a conversion. This metric measures the effectiveness of your landing page and offer.
- Cost Per Acquisition (CPA) / Cost Per Result: The average cost to acquire one conversion. A critical KPI for profitability.
- Lead Quality Score (for B2B): When integrated with CRM data, this metric helps you understand which campaigns are driving valuable leads. It requires robust attribution models to connect ad spend to sales outcomes.
Financial & ROI Metrics
- Ad Spend: The total amount of money spent on your campaigns during a specific period.
- Return on Ad Spend (ROAS): The total revenue generated for every dollar spent on advertising. This is one of the most important metrics for proving the value of your campaigns.
- Customer Lifetime Value (CLV): By connecting ad data with CRM data, you can track the long-term value of customers acquired through Facebook Ads.
- Average Order Value (AOV): For e-commerce, this metric shows the average revenue generated per order.
Setting Up Your First Automated Facebook Ads Report: A Step-by-Step Guide
Creating your first automated report can seem daunting, but breaking it down into manageable steps makes the process straightforward. The goal is to move from raw data to a clear, actionable dashboard that serves your strategic needs.
- Define your reporting goals: Before you connect any data, determine what you want to achieve. Are you trying to optimize for ROAS, lower your CPA, or understand creative performance? Clearly defining your objectives will guide every subsequent step.
- Choose your automation tool: Select a platform that fits your needs. This could be an all-in-one solution like Improvado, or a BI tool like Looker Studio combined with a data connector. Evaluate options based on ease of use, integration capabilities, and scalability.
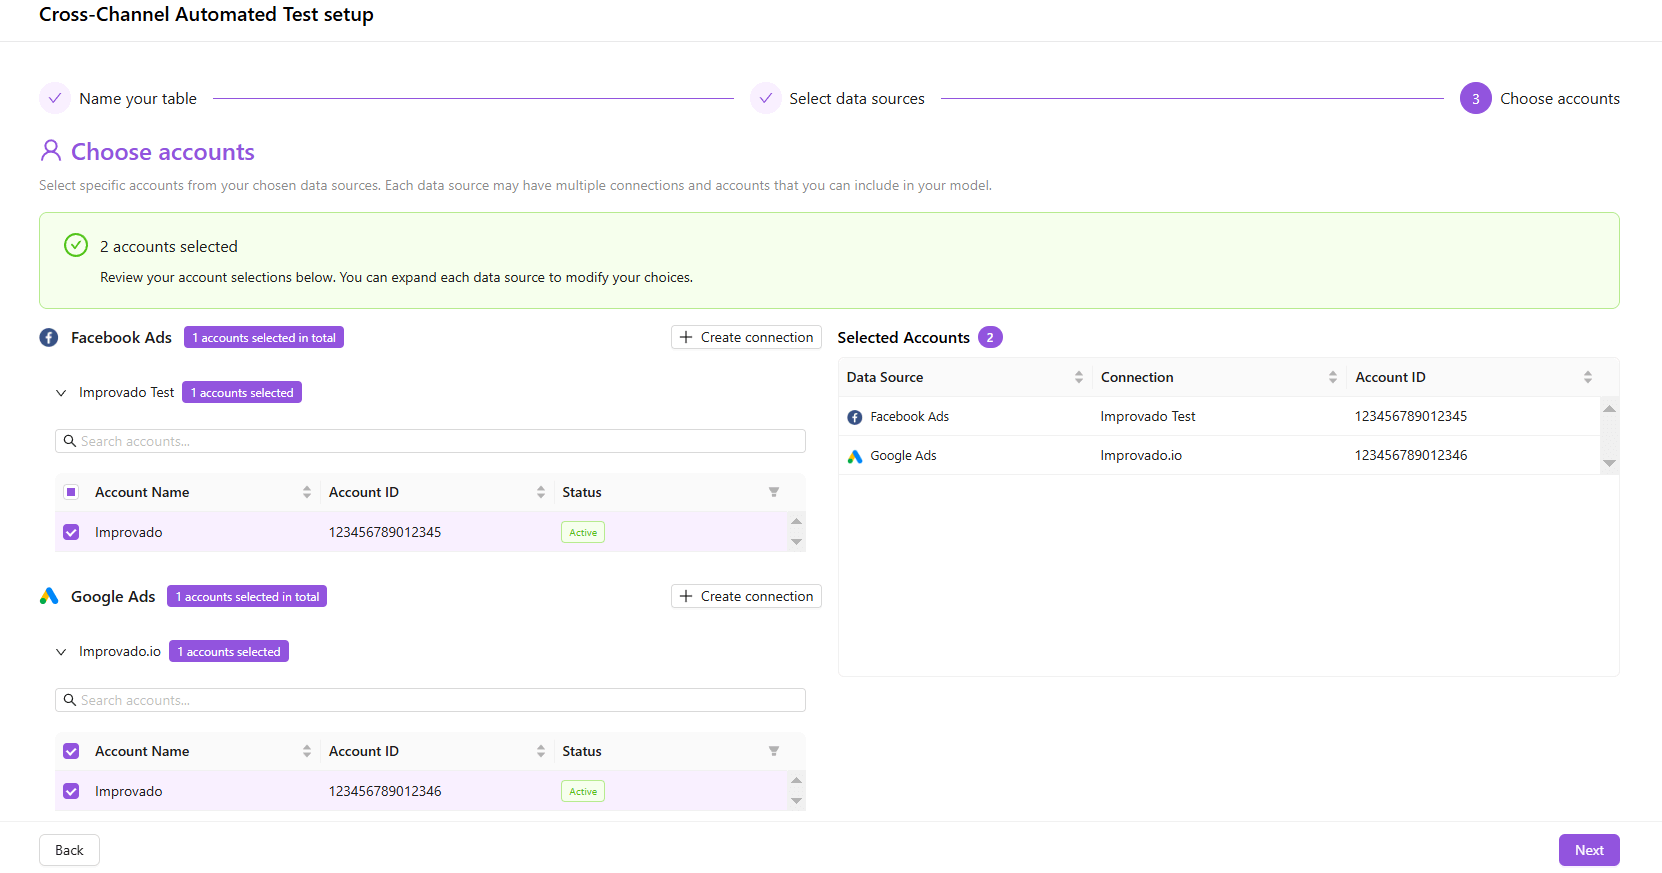
- Authorize and connect your data sources: The first step within your chosen tool is to connect your Facebook Ads account. This usually involves a simple OAuth process where you grant the platform permission to access your ad data via the API. Connect any other relevant sources, like Google Analytics or your CRM.
- Select your key metrics and dimensions: Based on your goals, choose the metrics (e.g., Spend, Clicks, Conversions) and dimensions (e.g., Campaign Name, Ad Set, Age, Gender, Placement) you want to analyze. Start simple and expand as you get more comfortable.
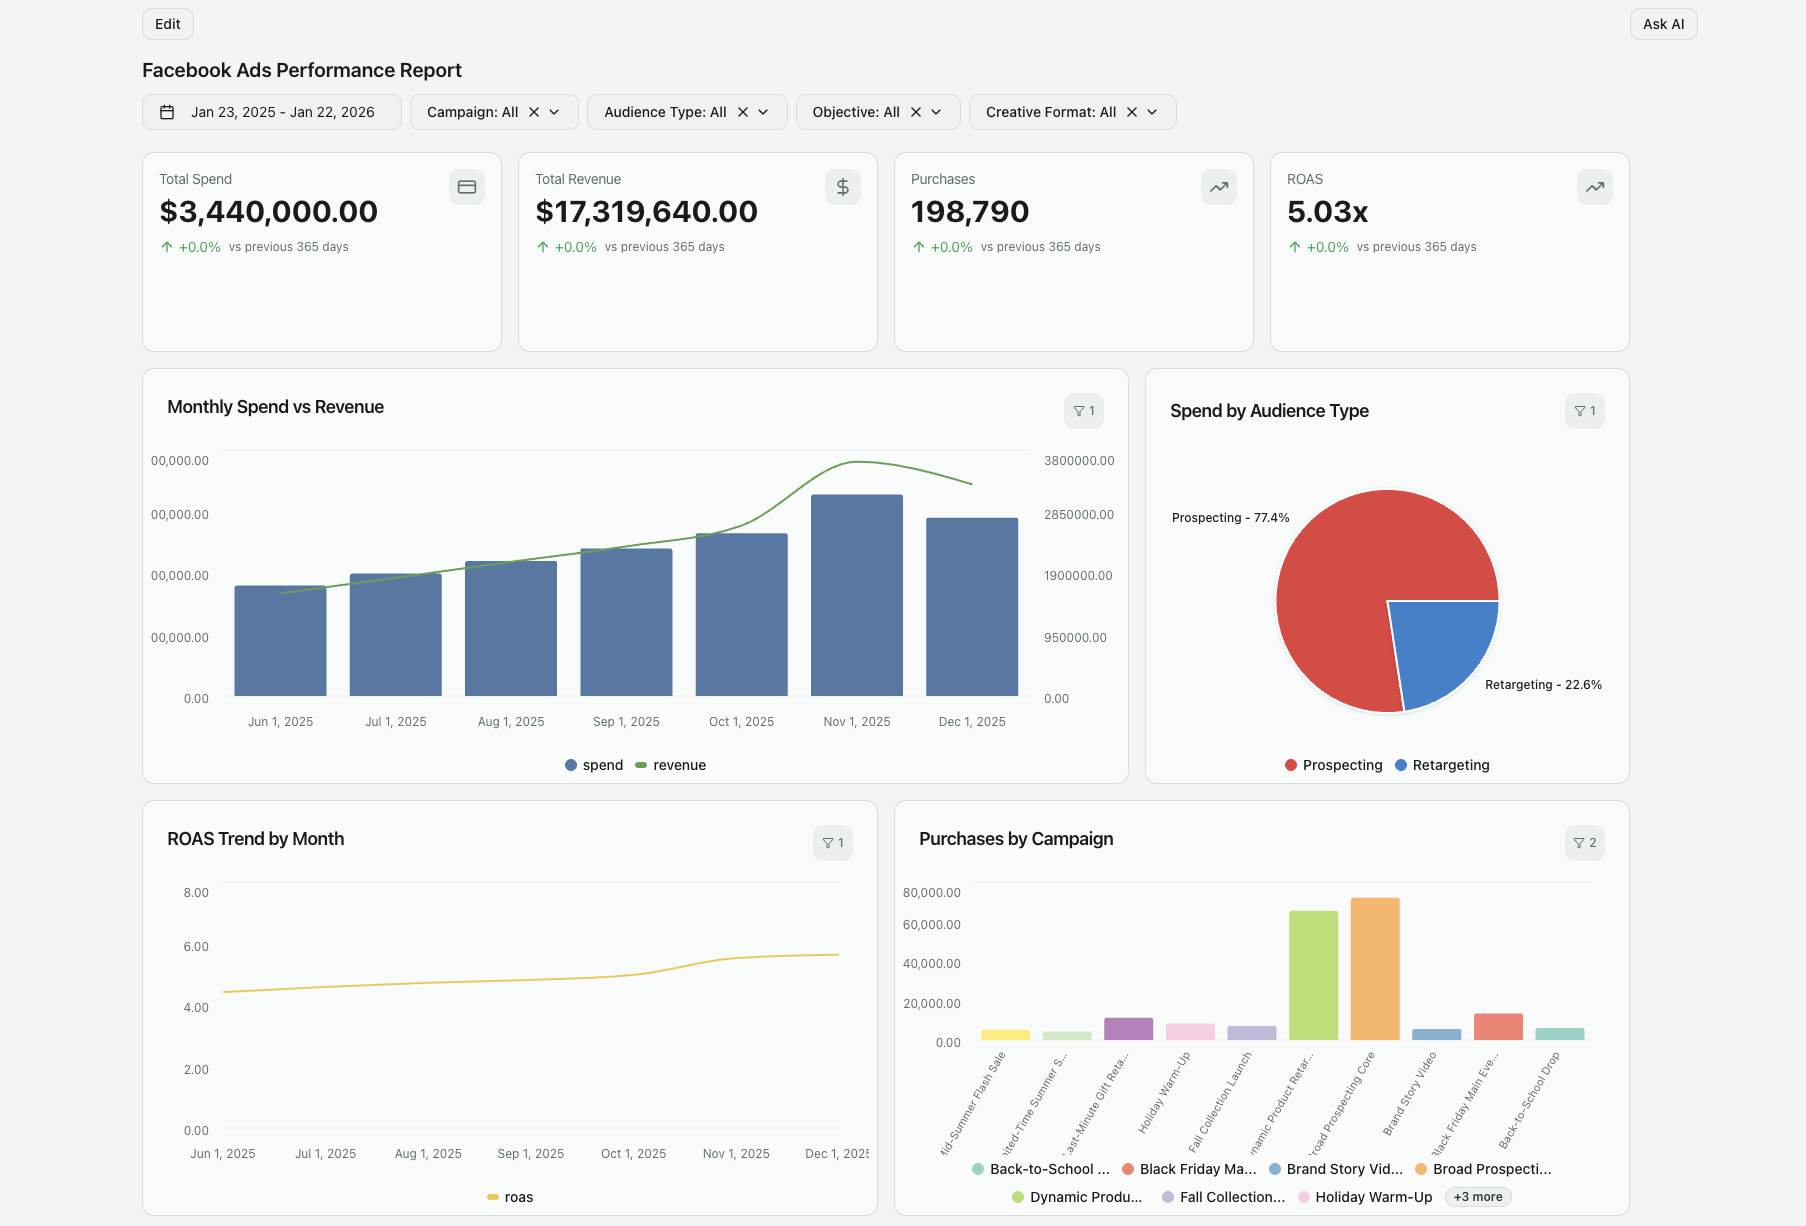
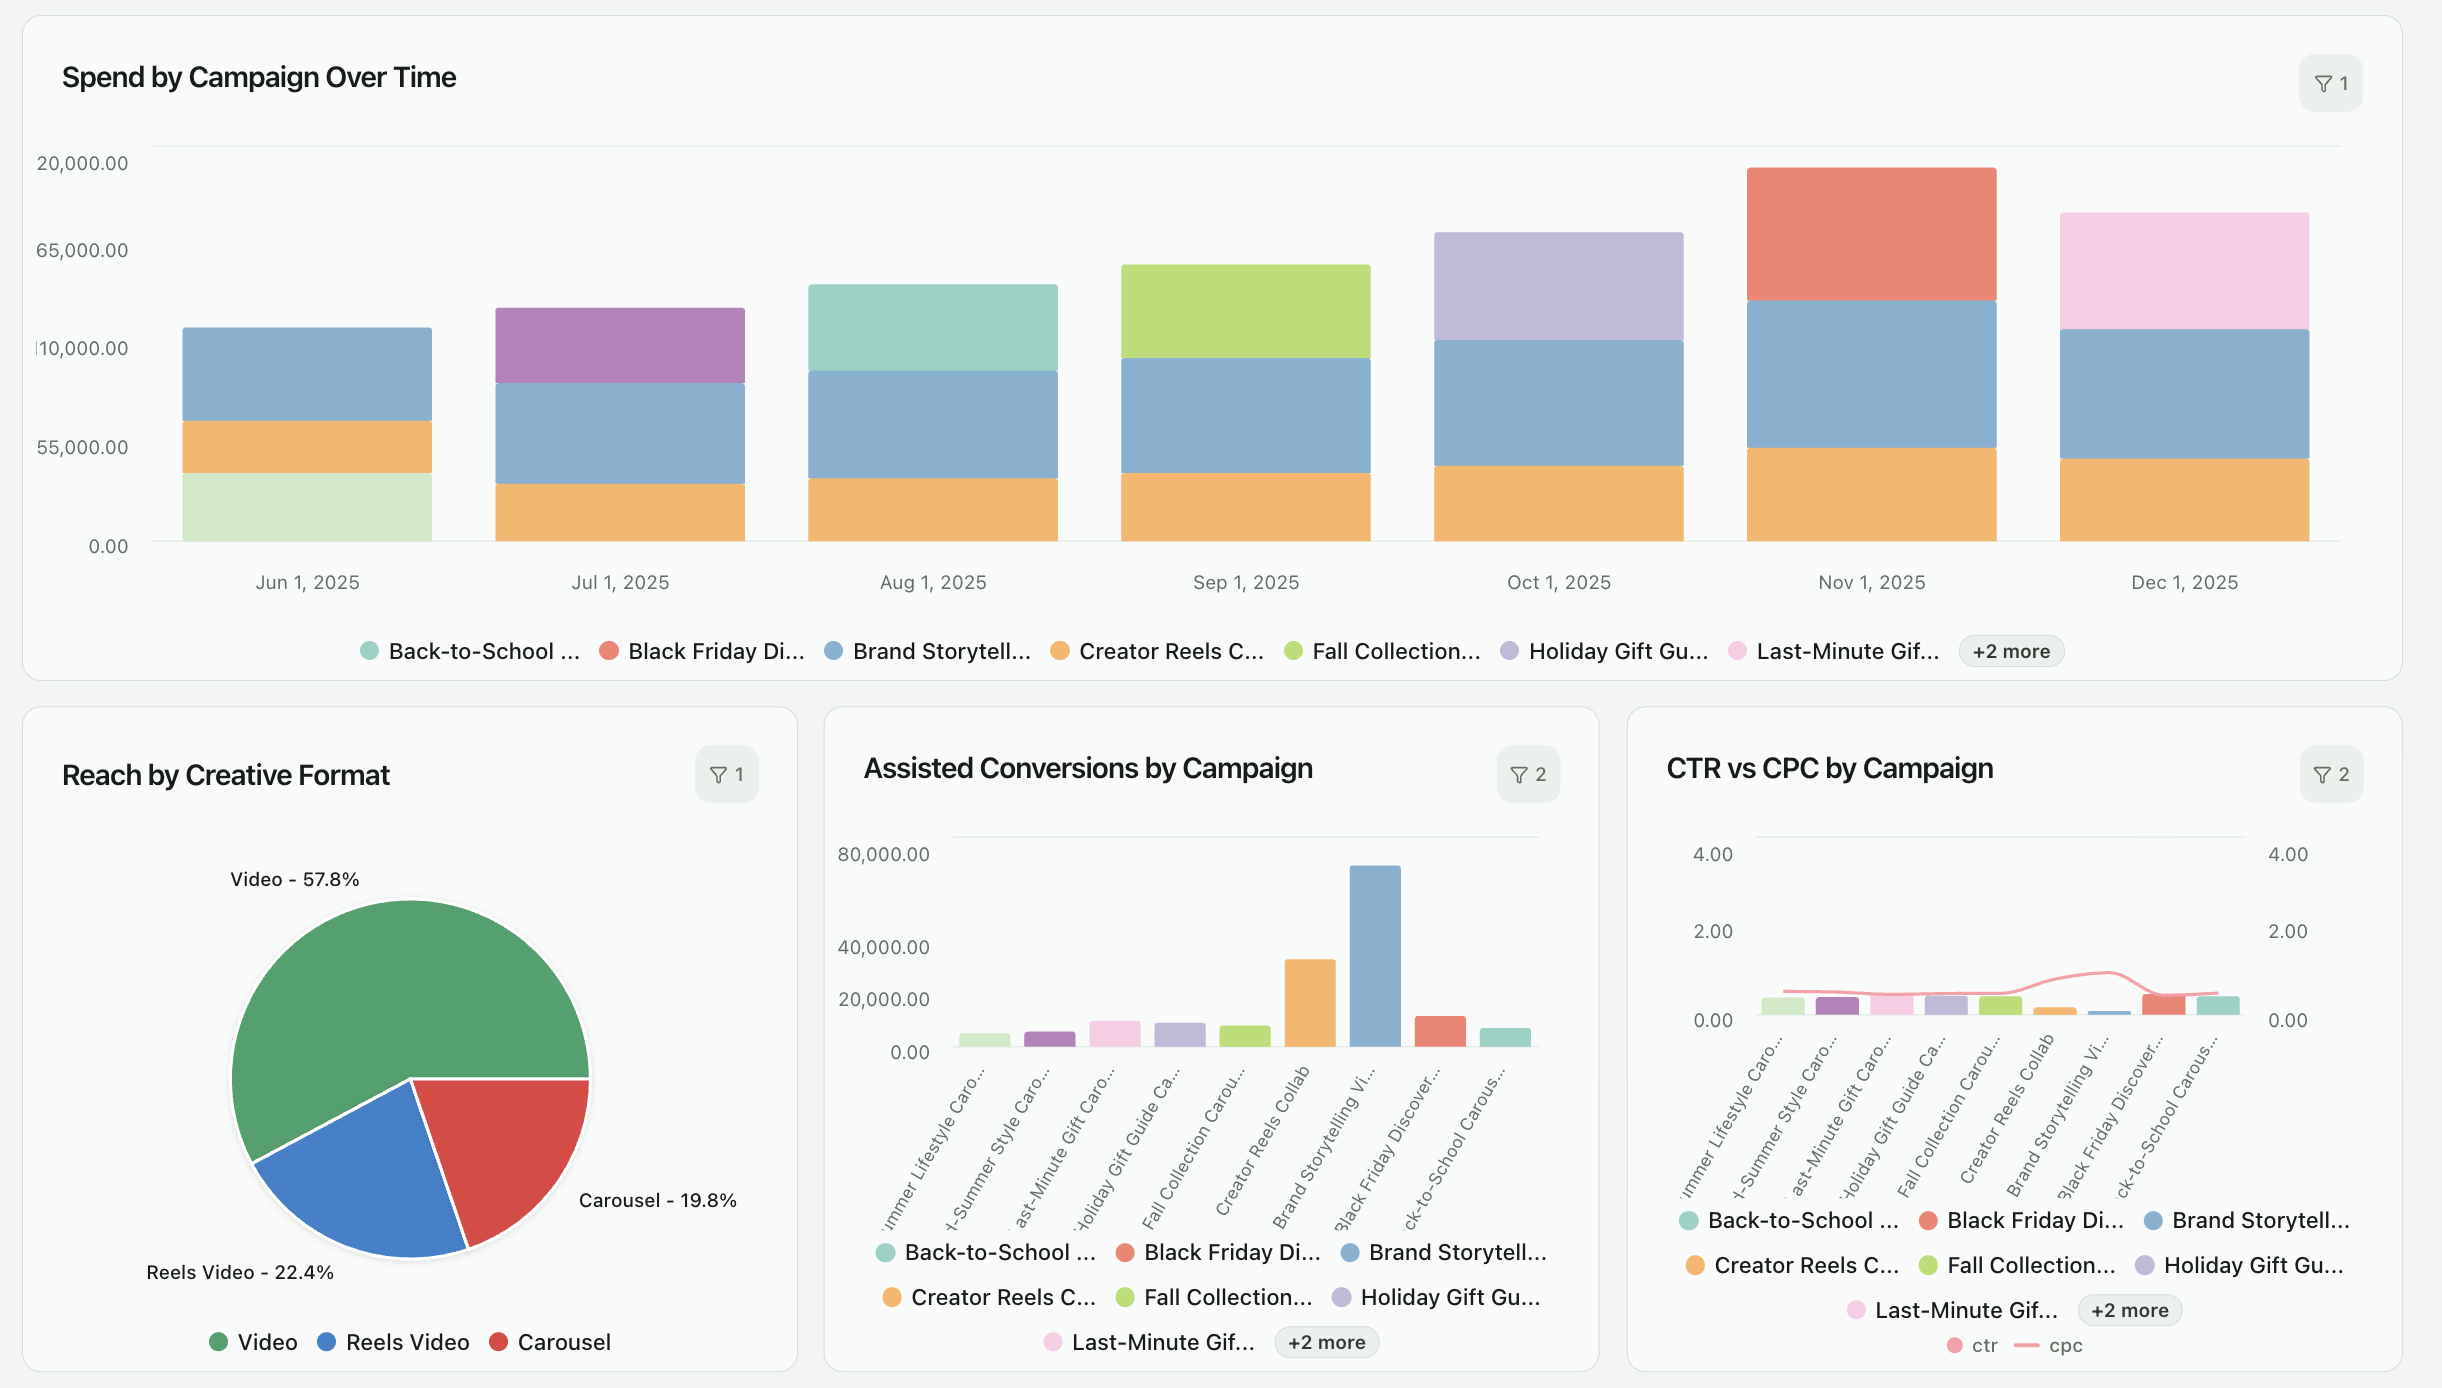
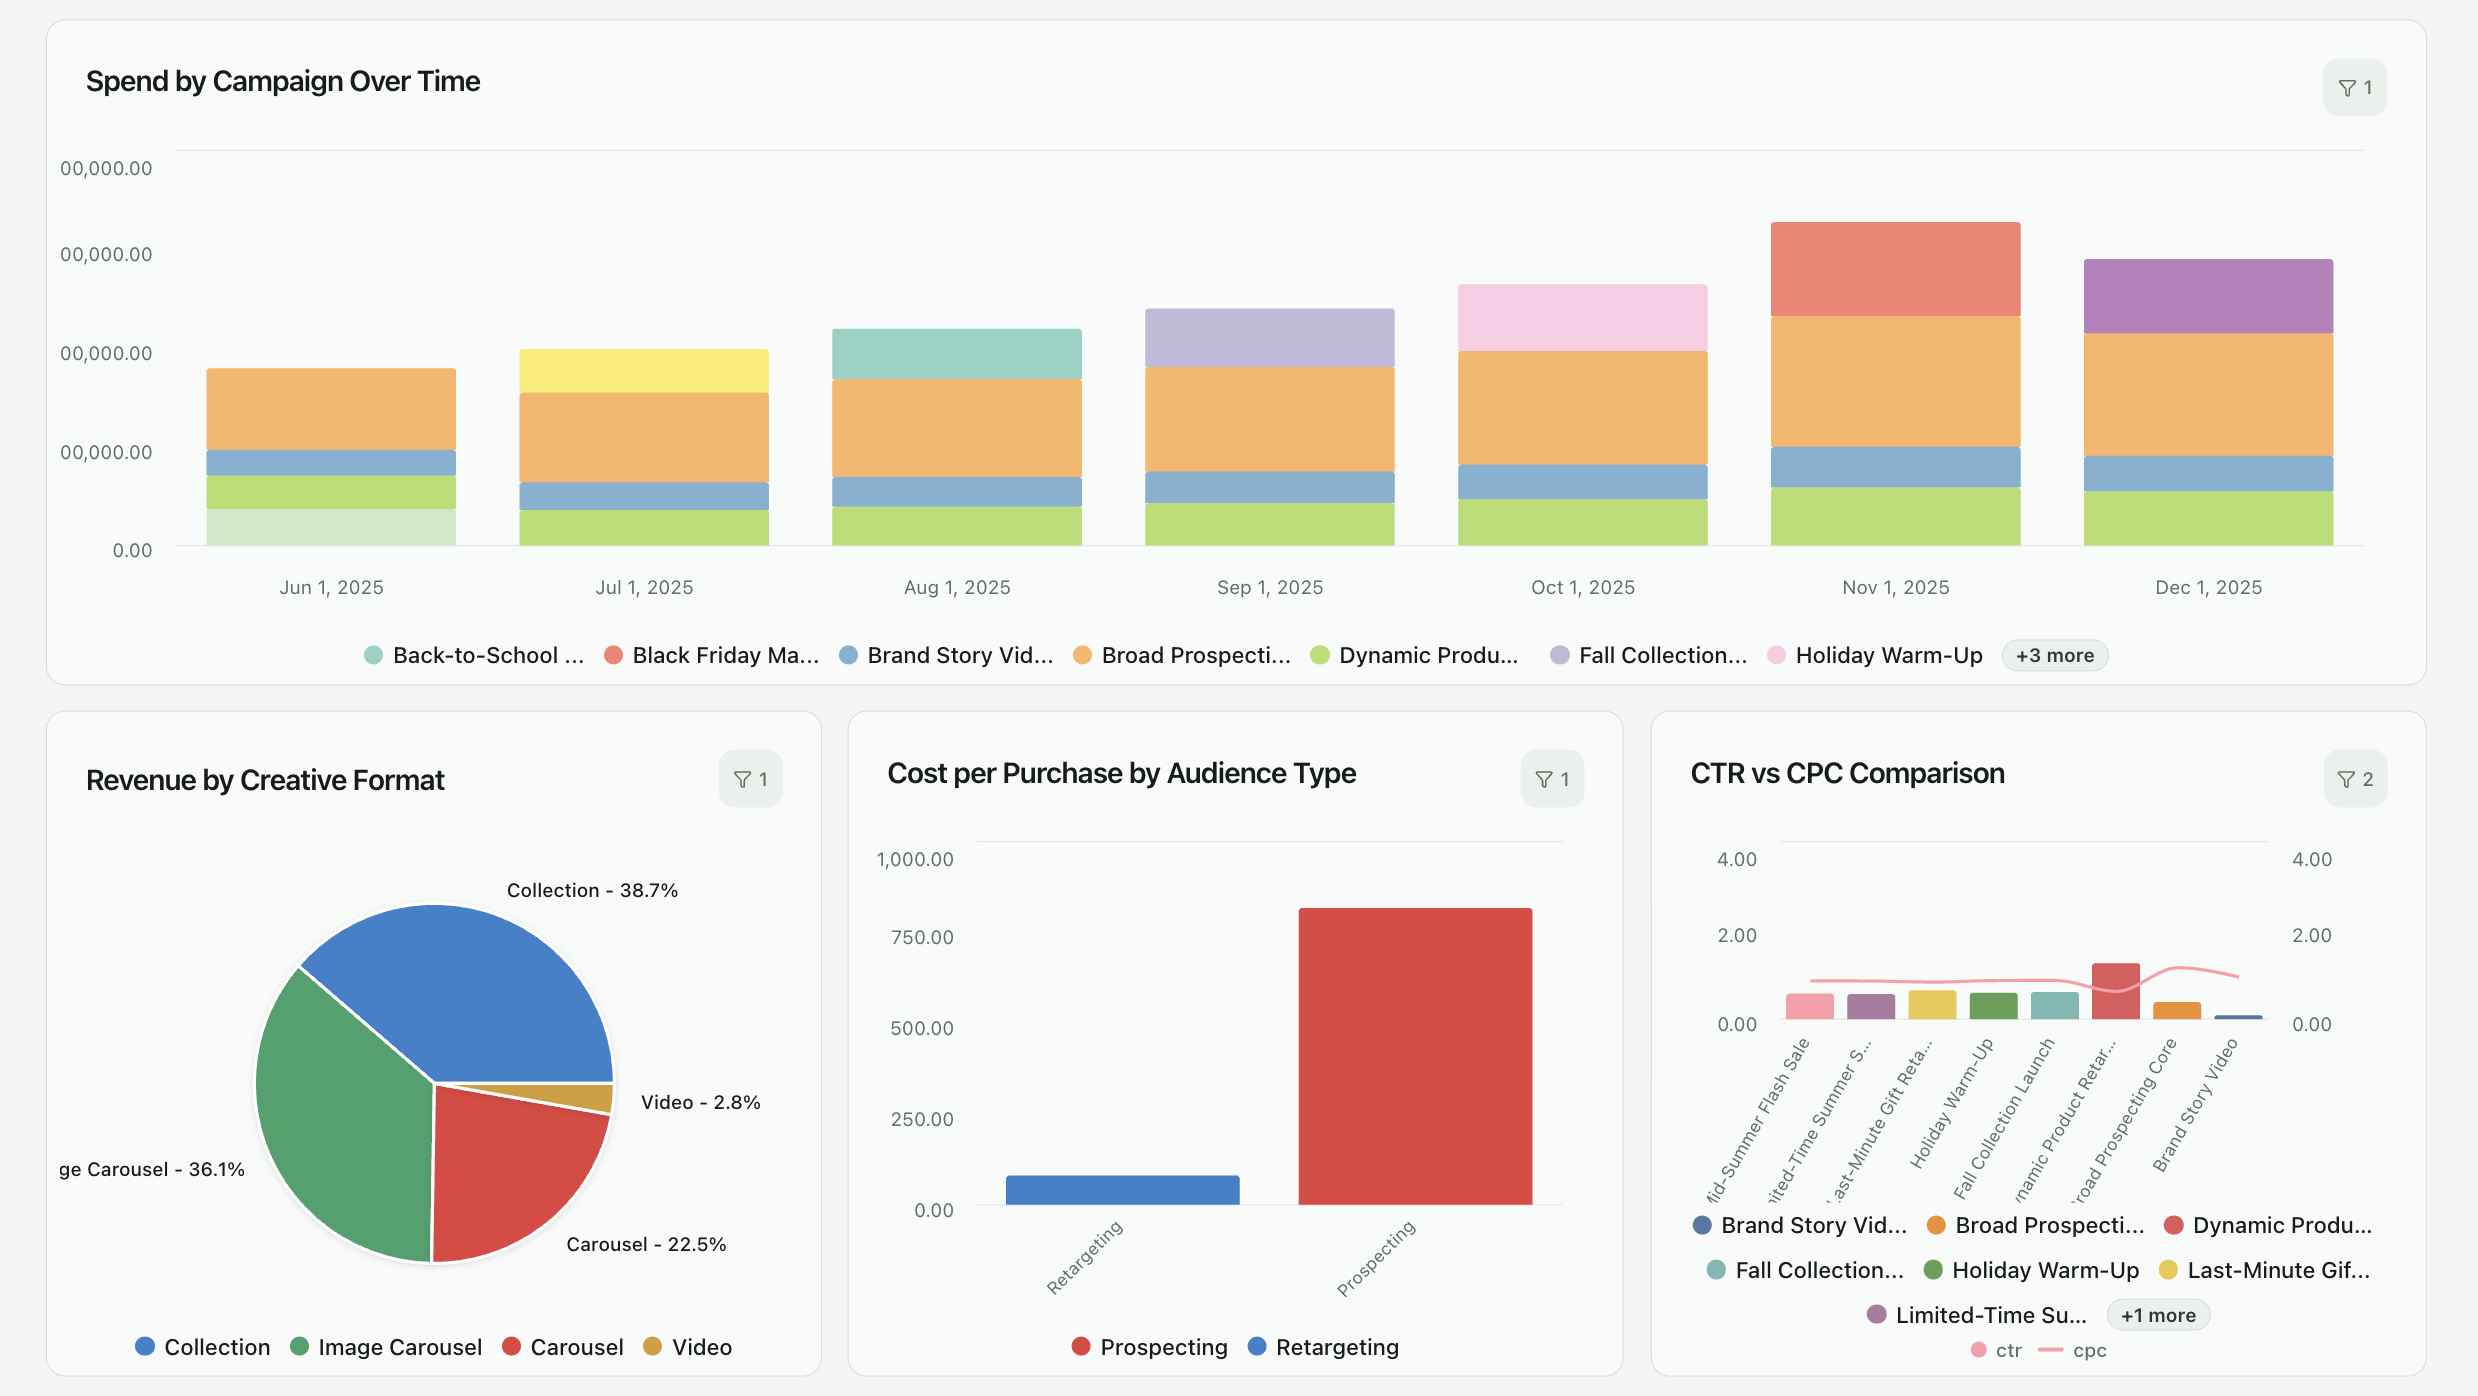
- Build your dashboard visualizations: Drag and drop your selected metrics and dimensions to create charts and tables.
- Use a time-series chart to track ROAS and Spend over time.
- Create a bar chart to compare the performance of different campaigns.
- Use a table to break down performance by creative assets.
- Build a pie chart to see the demographic split of your converting audience.
- Set up filters and date ranges: Add interactive filters to your dashboard. This will allow you and other users to easily drill down into the data by campaign, date range, or demographic segment without needing to edit the report structure.
- Schedule and share your report: Once you are happy with your dashboard, set up automated delivery. Schedule a PDF or a link to be emailed to your team every Monday morning. Integrate with Slack for real-time updates. This ensures insights are consistently shared and acted upon.
Advanced Strategies: Beyond Basic Performance Tracking
Once you have automated your core performance reports, you can move on to more advanced analytical strategies. These techniques unlock deeper insights into your audience, creative, and customer journey, providing a significant competitive advantage.
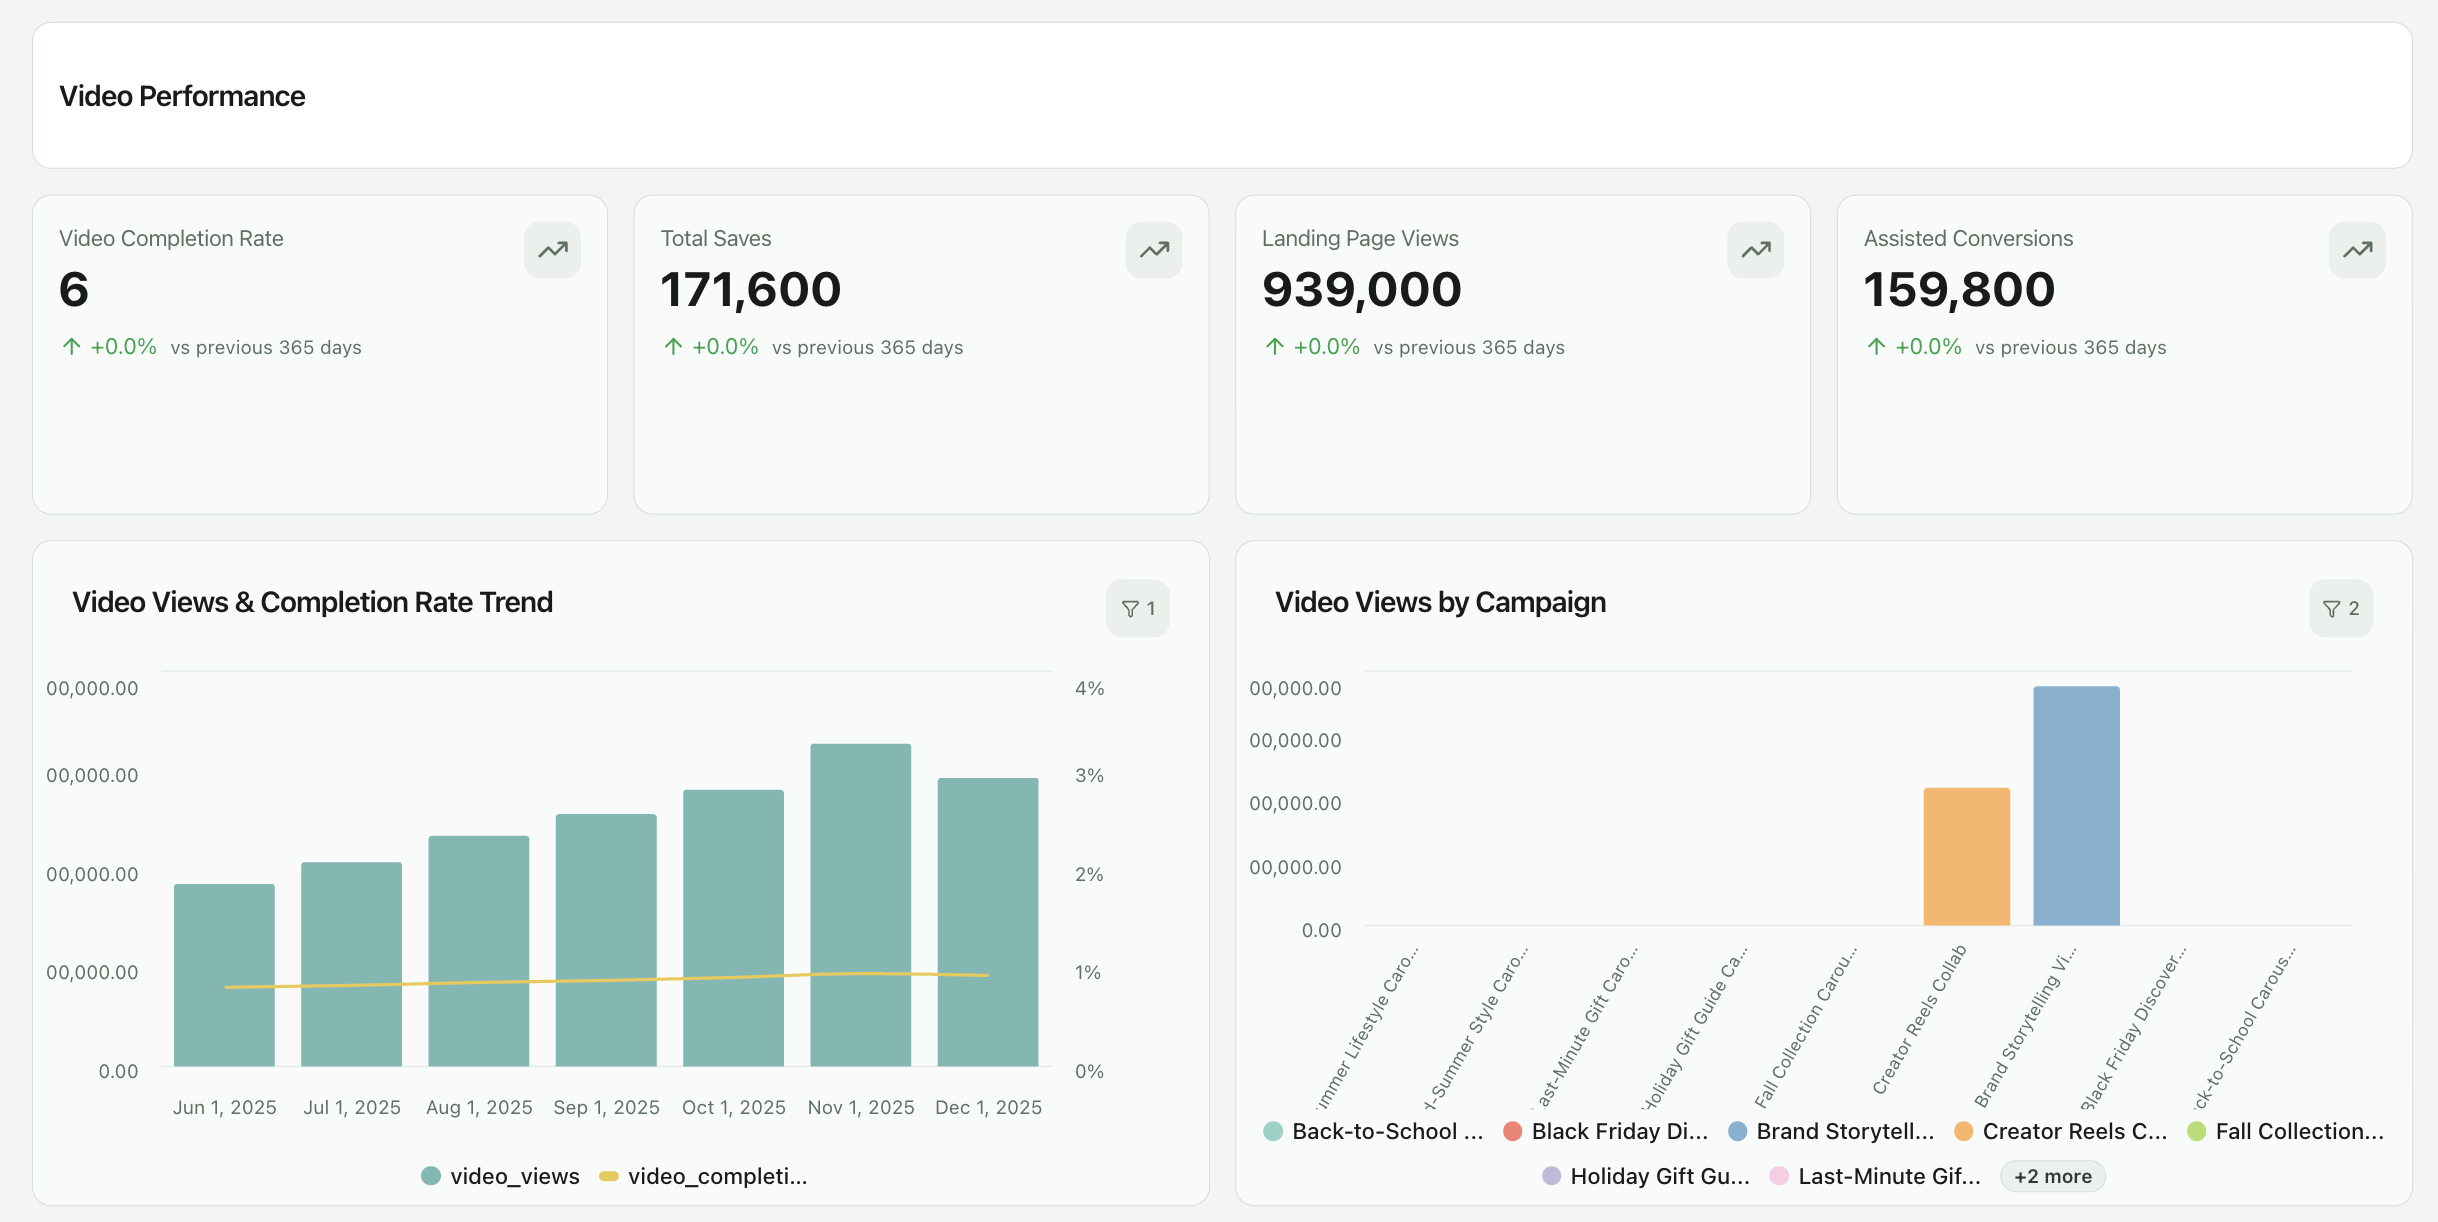
Automated Creative Analysis
Your ad creative is one of the most significant levers for performance. An automated report can help you systematically analyze which creative elements are driving results. Set up a dashboard that compares performance based on:
- Visuals: Compare images vs. videos, user-generated content vs. studio shots.
- Headlines & Copy: Test different value propositions, emotional appeals, or calls to action.
- Formats: Analyze the performance of Carousel ads vs. Collection ads vs. single image ads.
This allows you to quickly identify winning trends and apply them across all your campaigns. Strong marketing analytics practices are essential here.
Conversion Funnel Visualization
Automate the visualization of your entire conversion funnel, from initial ad impression to final purchase.
By combining Facebook Ads data with data from your website analytics (like Google Analytics), you can track how users move through each stage. This helps you identify bottlenecks.
For example, you might discover a high CTR but a low landing page conversion rate, indicating a problem with your page rather than your ad creative.
Audience Segmentation and Insights
Use your automated reporting platform to go beyond basic demographic reporting. Segment your audience performance by more granular attributes:
- Lookalike Audiences: Compare the performance of different lookalike percentages (e.g., 1% vs. 5%).
- Interest Targeting: Identify which interest groups are driving the highest ROAS.
- Custom Audiences: Analyze the performance of retargeting campaigns aimed at website visitors, email subscribers, or past purchasers.
This deep analysis helps you refine your targeting and allocate your budget more effectively. You might even discover new, profitable audience segments. For great insights, you need effective marketing KPIs to track.
How Automation Helps Prove and Maximize Marketing ROI
Marketing teams are under constant pressure to prove financial impact. The challenge is not lack of data. It is fragmented data, inconsistent definitions, and slow reporting cycles. When measurement is delayed or disputed, ROI discussions become opinion-driven instead of evidence-based.
Automation changes the economics of measurement. It provides the tools and data integrity needed to clearly connect ad spend to revenue.
Connecting Ad Spend to Revenue
True ROI measurement requires direct linkage between media spend and business outcomes. This means joining Facebook Ads data with ecommerce platforms, CRM systems, and revenue databases. When these sources remain disconnected, ROAS calculations are approximations.
Automated data pipelines solve this. Spend, conversions, and revenue events are collected, standardized, and joined in a single model. ROAS, CAC, and LTV can be calculated continuously, not retroactively. This creates a defensible link between advertising investment and financial results.
Optimizing Budget Allocation
Cross-channel performance is rarely visible inside platform-native dashboards. Each channel reports success differently. This hides underperformance and inflates perceived returns.
Automation centralizes channel data and applies consistent metric logic. Teams see which campaigns, audiences, and creatives actually drive revenue. Budget shifts become evidence-based actions, not reactive guesses. Optimization cycles compress from weeks to days.
Forecasting and Predictive Analytics
Once data is clean and historical depth is established, predictive analysis becomes viable. AI models detect performance trends, saturation signals, and diminishing returns before they appear in headline KPIs.
Forecasting tools use historical response curves to project spend efficiency under different budget scenarios. This supports realistic target setting and proactive budget planning. Marketing moves from reacting to reports to anticipating outcomes.
Comparing Reporting Solutions: Native Tools vs. Third-Party Platforms
Marketers have several options for reporting, ranging from Facebook's built-in tools to sophisticated third-party analytics platforms. Understanding the pros and cons of each approach is crucial for choosing the right solution for your business.
Ultimately, the best choice depends on your team's size, technical expertise, and cross-channel reporting needs.
| Aspect | Facebook Ads Manager | Looker Studio + Connector | Improvado (All-in-One Platform) |
|---|---|---|---|
| Core Function | Campaign management and basic reporting within the Facebook ecosystem. | Data visualization and dashboarding. Requires a separate tool to pull and prepare data. | End-to-end data pipeline: extraction, transformation, and visualization in any BI tool. |
| Data Sources | Facebook and Instagram data only. No external sources. | Connects to many sources via third-party connectors, but each connection adds cost and complexity. | 1,000+ pre-built marketing connectors. A unified solution for all channels. |
| Automation Level | Limited. Basic scheduled email reports of preset dashboards. No data integration automation. | High visualization automation. Data pipeline automation depends entirely on the connector tool used. | Fully automated. Data is extracted, cleaned, and loaded into dashboards or a warehouse in real time. |
| Customization | Low. Limited to pre-defined columns and basic chart options. | High. Fully customizable dashboards and extensive visualization options. | Extremely high. Data is transformed to fit any schema, enabling unlimited custom reporting in any BI tool. |
| Ease of Use | Easy for basic reports but becomes complex for deep analysis. | Moderate learning curve for Looker Studio. Technical setup required for data connectors. | Managed service. Improvado handles the entire data pipeline setup and maintenance. Easy to use for end-users. |
| Cross-Channel View | None. Siloed view of Facebook and Instagram performance. | Possible, but requires managing multiple connectors and manually blending data sources. | Built-in. Data is automatically normalized for seamless cross-channel analysis. |
| Best For | Small businesses or advertisers focused exclusively on Facebook. | Analysts who are comfortable managing data pipelines and want a free, powerful visualization tool. | Marketing teams and agencies needing a scalable, reliable, and automated solution for multi-channel reporting. |
Choosing the Right Automated Facebook Ads Reporting Tool
The market for marketing analytics tools is crowded. Selecting the right platform is a critical decision that will impact your team's efficiency and capabilities for years to come. It's helpful to think about tools in different categories, as each serves a distinct purpose.
Tool Types and Their Primary Use Cases
Understanding the different types of tools available helps clarify which solution aligns with your company's specific needs, technical resources, and long-term goals. From simple connectors to comprehensive data platforms, each option offers a different balance of power, flexibility, and ease of use.
| Tool Type | Core Function | Best For | Technical Skill Required | Cross-Channel Capability |
|---|---|---|---|---|
| Data Connectors | Pulling data from a source (Facebook) into a destination (BI tool or spreadsheet). | Teams with existing BI tools and the technical ability to manage data schemas. | Moderate to High | Limited. Requires managing separate connectors and data models for each channel. |
| Dashboarding Tools | Visualizing pre-connected data. They do not extract or transform data themselves. | Presenting data that is already clean and consolidated. | Low to Moderate | Depends entirely on the upstream data source provided. |
| ETL and ELT Platforms | Extracting, transforming, and loading data from sources into a data warehouse. | Companies with a data engineering team and a dedicated marketing data warehouse. | High | High. Designed for integrating many data sources. |
| All-in-One Platforms (like Improvado) | Managing the entire pipeline: extraction, transformation, storage, and visualization. | Marketing teams that need a complete, managed solution without technical overhead. | Low | Very High. Purpose-built for unified, cross-channel marketing analytics. |
Overcoming Common Challenges in Automated Facebook Ads Reporting
While automation solves many problems, the transition is not without its potential hurdles.
Being aware of these common challenges can help you plan ahead and ensure a smooth implementation process.
Maintaining UTM and Campaign Naming Consistency
Inconsistent UTM parameters and campaign naming conventions can wreak havoc on your automated reports. If campaigns are not tagged correctly, your platform won't be able to properly attribute conversions or segment data.
The solution is to establish and enforce a strict naming convention across all teams and platforms. Some advanced tools, like Improvado, offer AI-powered modules to automatically audit and clean up your naming conventions, ensuring data integrity. Perfecting your UTM tracking best practices is non-negotiable.
Handling Data Discrepancies
You may sometimes notice small discrepancies between the data in Facebook Ads Manager and your third-party reporting tool. This can be due to differences in attribution windows, time zones, or API data refresh rates.
It's important to understand the cause of these discrepancies and to establish one platform as your "source of truth" for reporting to ensure consistency in decision-making.
Navigating API Limitations and Changes
Marketing platforms occasionally update their APIs, which can temporarily affect data connections. A good automation provider will proactively manage these changes, updating their connectors to ensure uninterrupted data flow.
When choosing a tool, ask about their process for handling API updates and their level of customer support. This is a key benefit of using a managed service over building your own connections.
The Future of Facebook Ads Reporting: AI and Predictive Analytics
Automated reporting is the foundation, but the future lies in making that data more intelligent.
The next evolution of marketing analytics is already here, driven by artificial intelligence and machine learning. These technologies are moving reporting from a backward-looking activity to a forward-looking, predictive function.
AI-Powered Anomaly Detection
Instead of manually searching for issues, AI algorithms can monitor your data streams 24/7. They can automatically detect anomalies–such as a sudden drop in CTR or an unexpected spike in CPA–and alert you immediately. This allows your team to address problems before they significantly impact the campaign budget or performance.
Generative Insights and Natural Language Queries
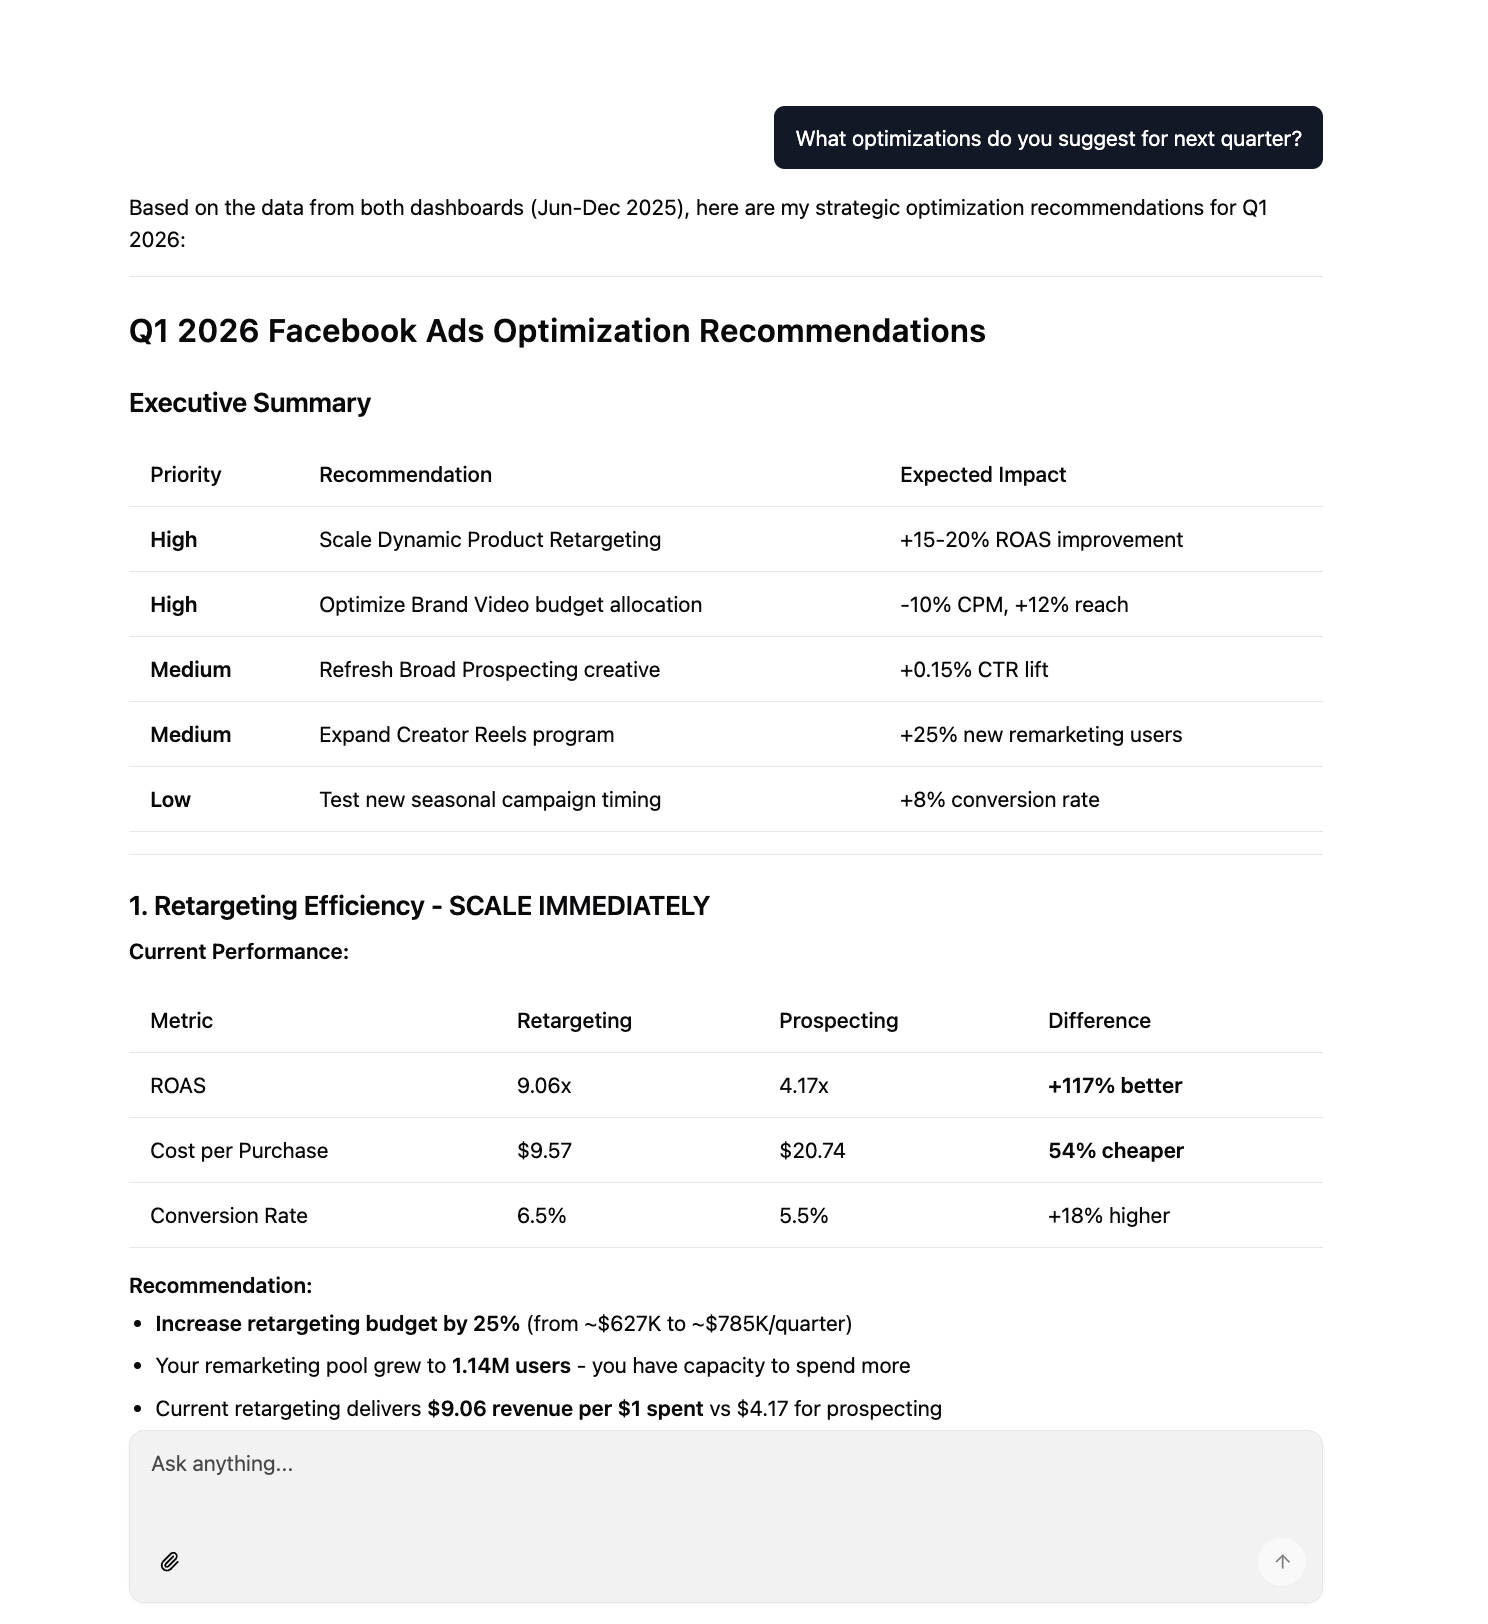
The next generation of reporting tools replaces manual analysis with conversational access to data. Instead of building charts or writing queries, teams ask questions in plain English. For example, “What was our best-performing Facebook creative for women aged 25–34 last month?” The system returns the answer with visualizations and written interpretation.
Improvado AI Agent operationalizes this capability on top of unified and governed marketing data. The Agent understands metric definitions, campaign hierarchies, and naming conventions already standardized in your dataset. This ensures answers are accurate, consistent, and audit-ready rather than based on fragmented platform views.
Beyond answering questions, the Agent generates dashboards and reports from natural-language requests. Teams can refine views through follow-up prompts, save them for recurring use, and share them across stakeholders. This turns dashboard creation into a conversational workflow and makes advanced analysis accessible without technical expertise.
Predictive Budgeting and Forecasting
By analyzing historical data, AI models can forecast future campaign performance with a surprising degree of accuracy. They can recommend budget allocations across different campaigns and channels to maximize your overall ROI. This technology helps you build more accurate marketing plans and set achievable targets based on data, not guesswork.
Conclusion
The shift from manual to automated Facebook Ads reporting is an essential step for any modern marketing team. It's about reclaiming valuable time, ensuring data accuracy, and unlocking the strategic insights needed to drive growth. By eliminating tedious manual work, you empower your team to focus on optimization, strategy, and innovation.
Building a robust automated system allows you to see your performance in real time, connect ad spend directly to revenue, and make agile decisions that boost your marketing ROI.
Whether you start with a simple dashboard or implement a comprehensive, all-in-one platform like Improvado, the principle is the same: let technology handle the data so you can handle the strategy.
Related reading: Scaling Facebook Brand Awareness Campaigns (2026 Guide)