In 2019 and 2020, TikTok may have ignited a brand-new social media revolution by becoming one of the most popular apps in the world. The platform caught fire during the global pandemic and became a household name seemingly overnight. Initially, people used TikTok for memes and dancing videos, but today it’s become one of the largest social media platforms with the highest engagement rates among competitors.
Marketers still trying to figure out Facebook ads when TikTok hit likely felt overwhelmed. Another social media account to manage? The feeling is valid, but TikTok is a whole new dimension for your company’s marketing stack.
Running ads on TikTok can be especially beneficial, and if you choose to do so, you’ll need a TikTok ads dashboard to measure your success. This article will teach you the basics of TikTok ad analytics and how to build your custom dashboard.
Introducing TikTok Ads
TikTok has a colorful history and a flourishing user base. The app boasts over 1 billion monthly active users (as of the last quarter of 2022), many of whom are younger Millennials and Generation Z. For brands trying to target those demographics, TikTok is the place to be.
TikTok ads work in much the same way as other social media platforms. Short-form video content is all that TikTok displays on their users’ feeds, so you can create TikTok ads in that format and sponsor them to reach your target audience. Running TikTok ad campaigns is an excellent way to extend your current reach. Many brands, especially those aiming to connect with TikTok's younger demographic, often seek the expertise of a TikTok ads agency to navigate this vibrant platform effectively.
Many social platforms allow you to tailor your ad campaigns to specific audiences, and TikTok is no exception, though they do have a surprisingly robust offering in this department. You can target viewers based on interests, demographics, and behaviors.
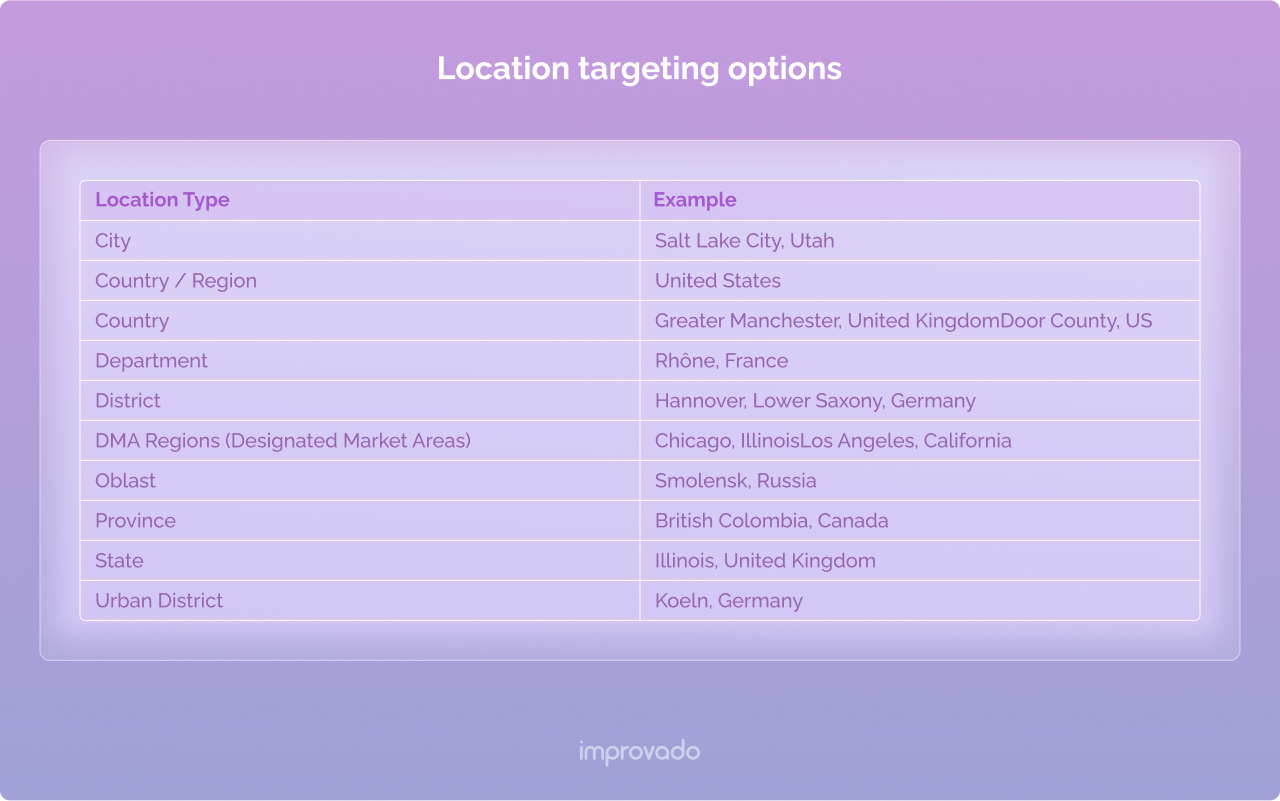
From there, you can present your ad in viewers’ “For You” feed, which is the curated selection of videos TikTok’s algorithm displays to users continuously.
What Kinds of Ads Can You Run on TikTok?
TikTok offers different types of paid advertising. The three main options are:
In-feed ads
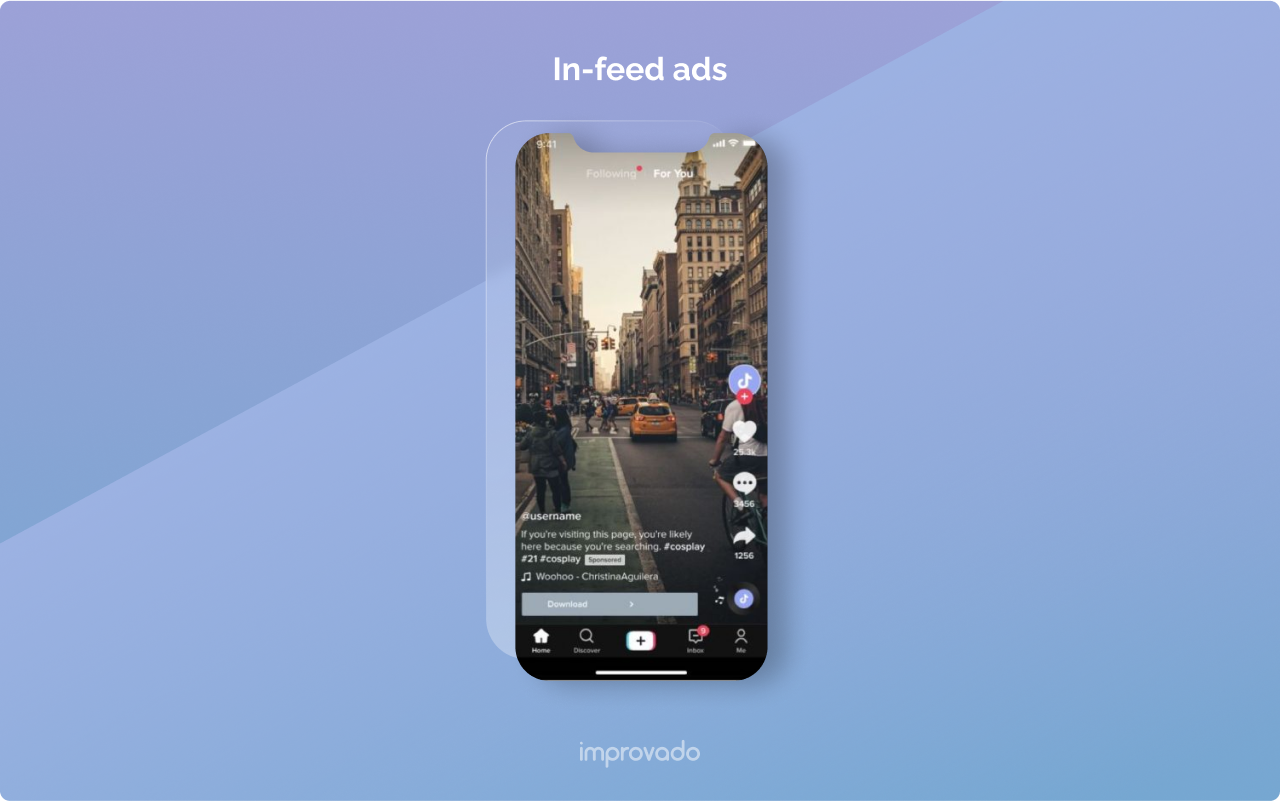
This 9–15 second vertical ad on users’ “For You” page can also include a call to action (CTA). In-feed ads are the most common type of ad on TikTok. With the help of a clickable CTA button you can drive traffic towards external landing pages, app download pages, or to your organization’s TikTok account.
In-feed ads are a great opportunity to grab prospects’ attention. 68% of users find Ads on TikTok unique and different from any other platform. Plus, these ads are undistinguishable from regular TikTok content, with a CTA being the only difference between two types of content. So, you have a chance to advertise your product or tell a story about your brand without users recognizing that it was an actual ad.
However, if your ad creative isn’t engaging enough or is overly salesy, users will most likely skip it immediately. That’s why you have to follow TikTok trends and fit into the feed with the right content to ensure the campaign’s success.
Brand takeover ads
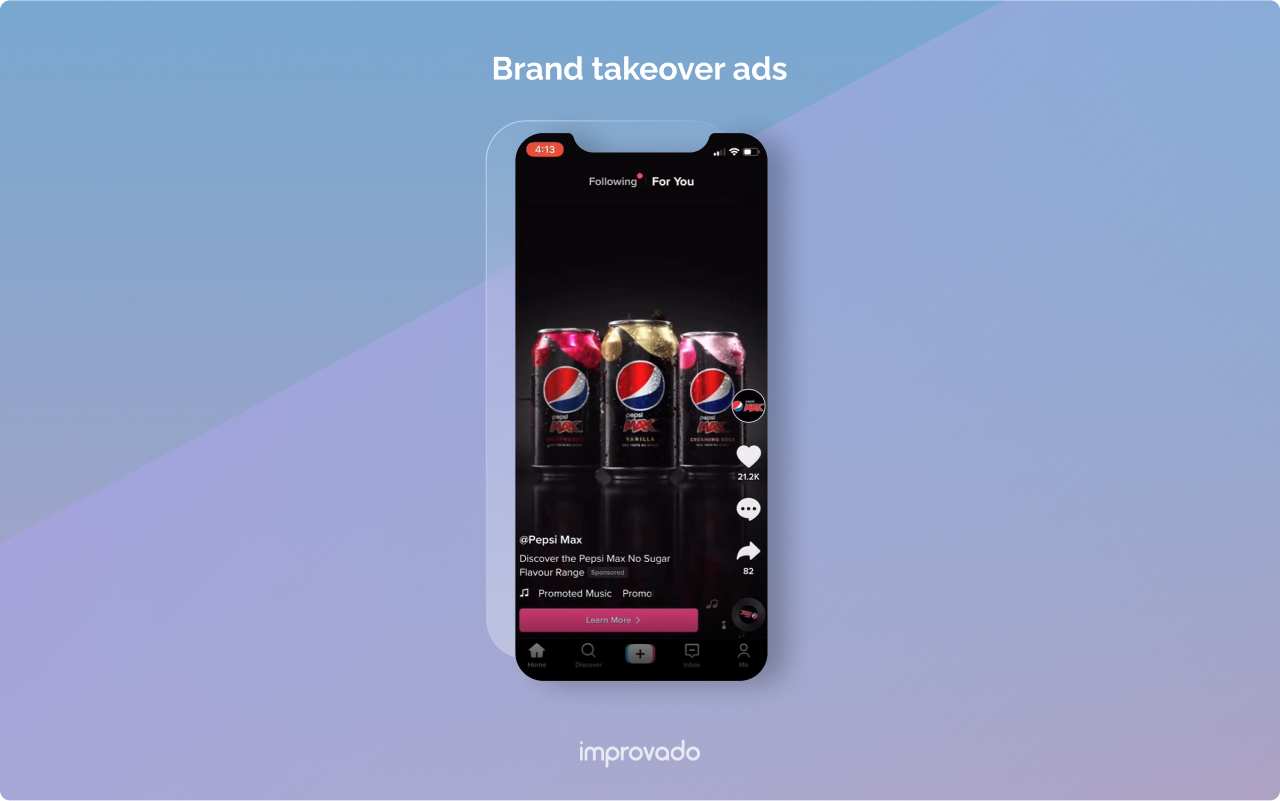
With these ads, your video plays when a targeted user opens the app. If interested in your offering, they can click the ad, which will take them to your landing page. TikTok ensures users see only one brand takeover ad daily, limiting these positions.
While brand takeover ads are certainly effective for raising awareness of your brand, product, or event, they might not be the best choice for TikTok Ads first timers because of their high price.
Hashtag challenges

Branded hashtag challenges are an advertising opportunity unique to TikTok, which makes your ads more exciting and engaging. These challenges prompt users to create videos showing themselves performing a specific action. This type of ad allows you to harness the power of User-Generated Content (UGC) and drive more awareness, leads, or credibility for your brand.
The main advantage of the branded hashtag challenge is the potential scale and reach of your campaign. If executed properly, millions of users can catch the trend and create content that benefits your brand. It’s impossible to achieve with regular influencer campaigns for example. This type of ad also boasts of 17 times higher engagement rates compared to regular campaigns across other platforms.
TikTok does offer some additional options, but these three are the most commonly used.
How Much Do TikTok Ads Cost?
The cost of these ads will vary depending on the ad type, budget, targeting, and other factors. However, due to the nature and popularity of the app, it’s often more expensive than other social platforms like Facebook or Instagram.
For example, regular in-feed ads start at 10$ per CPM. Besides, you have to spend at least $500 per campaign to advertise on TikTok.
As per other ad types, TikTok hasn’t been very transparent about the cost of advertising. However, marketers and influencers claim that a brand takeover campaign that ensures 5 mln+ impressions starts from $50,000 per day. The hashtag challenge might cost you $150,000 per week.
What Is a TikTok Ads Dashboard?
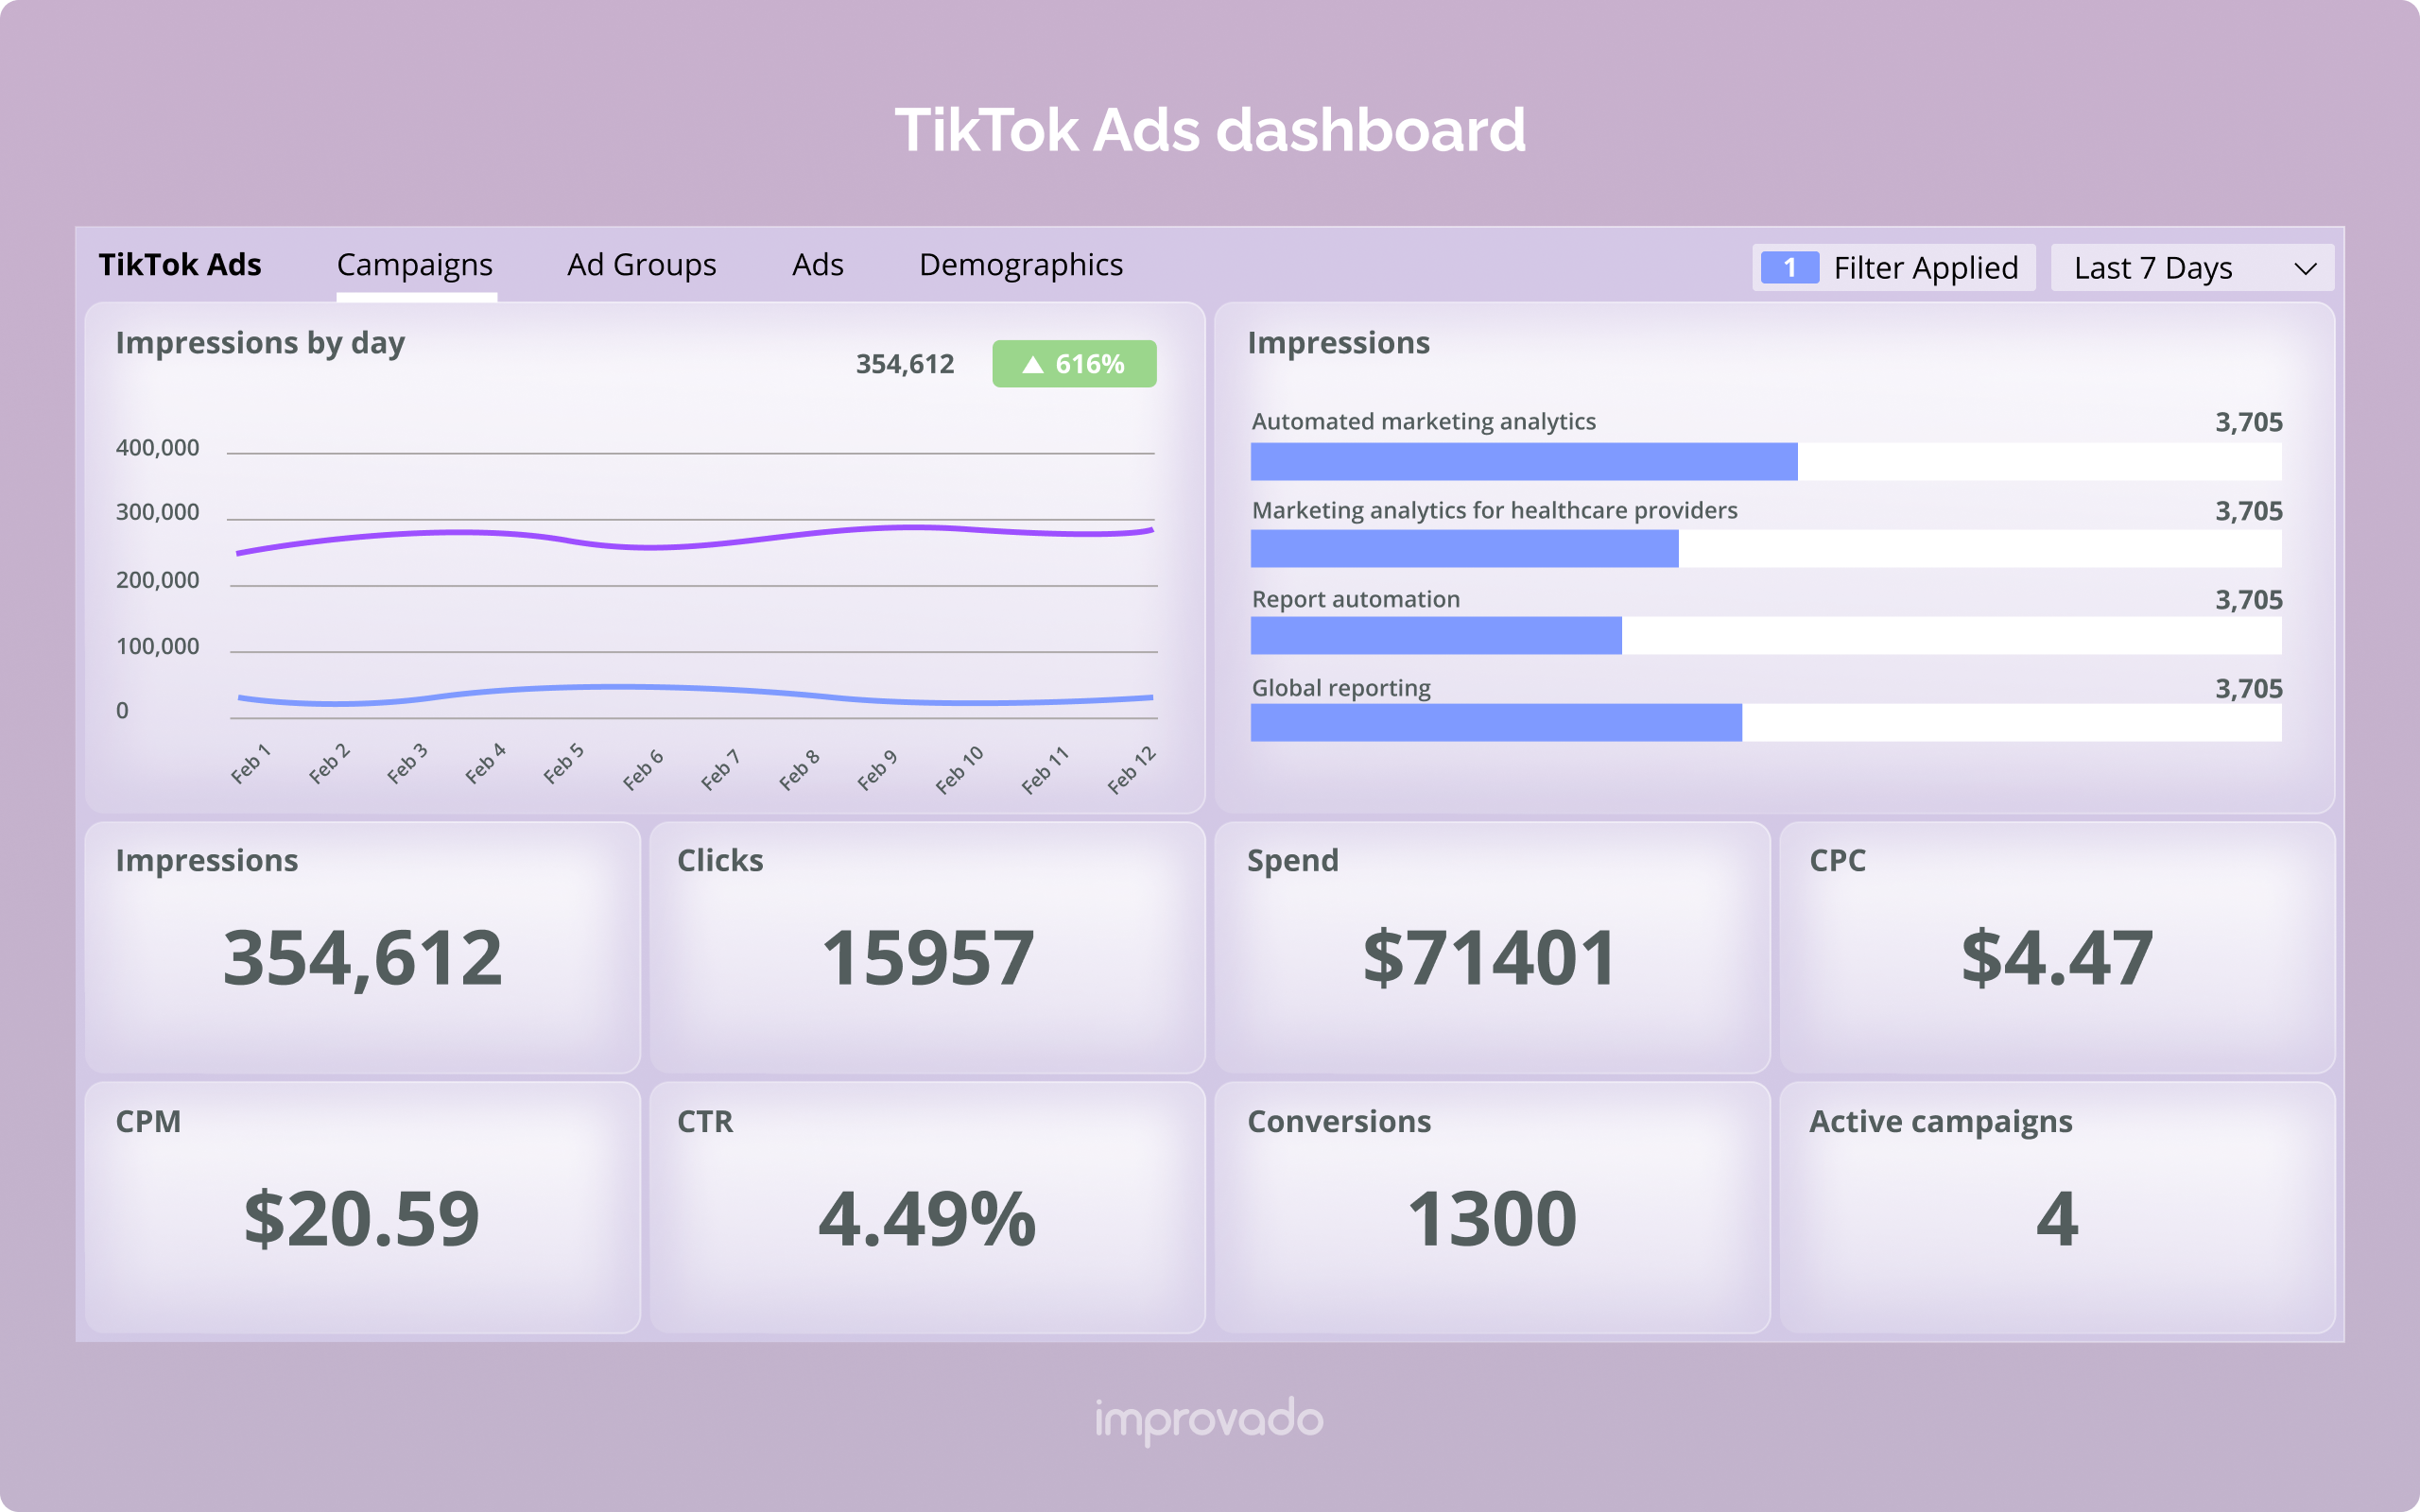
Reporting is an integral part of advertising on TikTok. Whether you need to measure the impact of your finished campaigns or optimize some of the ongoing ones, you always need to dive into performance metrics first.
Typically, reporting isn’t on the marketer’s high-priority list of tasks. They often copypaste metrics in a spreadsheet to get a high-level overview of the campaign’s performance. Then, everything is pretty straightforward. If the campaign’s ROAS is positive, the team launches it again. If the ROAS is negative, they ditch the campaign and come up with something new.
However, a coherent reporting is crucial for TikTok Ads for several reasons:
- TikTok ad performance is harder to measure compared to regular display ads. For example, UGC campaigns usually take more time to deliver results, so marketers have to keep sharp eye on metrics and don’t jump to conclusions.
- Large-scale TikTok campaigns are expensive, so teams have to take them responsibly and keep track of their marketing dollars.
That’s where a TikTok ads dashboard comes in. Picture this: A single source of truth for performance data across all campaignsthat displays all KPIs in a visual, easily digestible format. Charts and graphs make it much easier to understand the results campaigns achieve and facilitate better communication.
TikTok In-App Analytics vs. Cross-Channel Dashboards
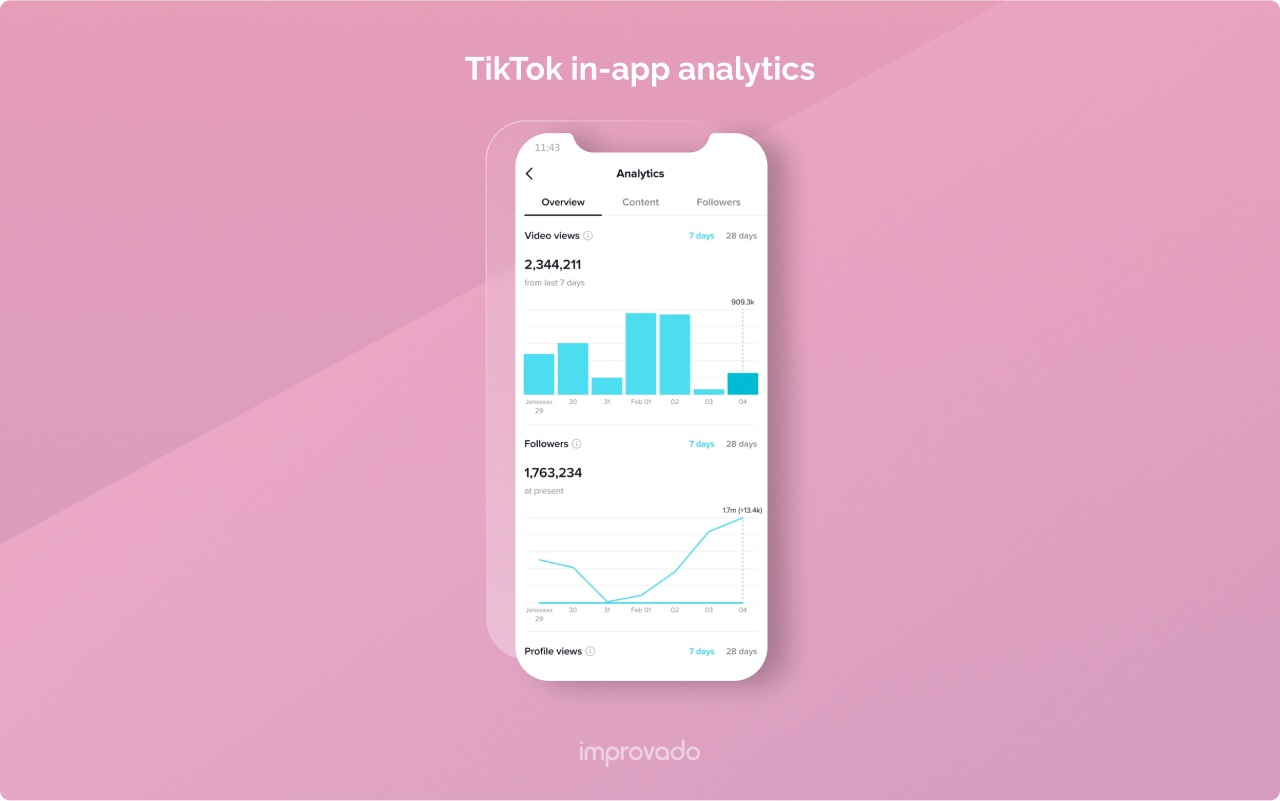
Naturally, many marketers rely on TikTok’s in-app dashboard. It’s an automatic report with real-time updates and fundamental insights into your account. For marketing teams that use TikTok as their primary acquisition channel, this report might be enough. It shows all the crucial metrics and provides shows you what’s working and what’s not with your TikTok campaigns.
However, things become much more complex when you have to report on performance across different ad platforms, website, paid search, and other channels.
For example, your TikTok campaign sends prospects to your website after they click on your ad. TikTok’s in-app dashboard will only record the number of clicks generated by the campaign. If you need to go further and know how many visitors from your TikTok campaign turned into customers, you’ll have to check this data in Google Analytics or any other web analytics tool you use.
In case you’re running ads across multiple platforms, you’ll have to use each platform’s dashboard and compare it with your web analytics data. Given that in-app dashboards often show metrics biased towards their platforms, the entire reporting process might turn into a nightmare.
A cross-channel dashboard can save you 90% of the time you spend on manual reporting and protect you from invalid data that often pops up while drawing up your report manually.
What Metrics to Include in a TikTok Ads Dashboard
Being strategic about the metrics you include in your dashboard is essential. Building a custom TikTok dashboard is more of an investment than using in-app analytics, so you want to extract maximum value from it.
Here are some essential TikTok metrics and KPIs to get you started.
Impressions
You should include this standard metric on every dashboard. Impressions measure the number of people to whom you’ve exposed your ad. Keep in mind that TikTok users often scroll endlessly, so they might see your ad several times, and each of these are counted as individual impressions.
Return On Ad Spend (ROAS)
Many brands forget to track their ROAS, but you shouldn’t overlook this crucial metric. You can consider it a more specific extension of your ROI, as it measures the value of your ad spend dollars.
Click-Through Rate (CTR)
Your click-through rate measures the number of users that clicked on an ad to your landing page or desired external link. It's important to track this metric to gauge the effectiveness of your ads in driving traffic to your target destination. Dashboards display this data as a line chart to visualize trends over time.
Cost Per Click (CPC)
CPC on TikTok works the same as it does on other platforms. How much are clicks costing you on the platform? This metric lets you know.
Conversion Rate (CR)
Tracking your conversion rate is essential on every single platform you use for marketing. It’s arguably the most critical metric since it tells you how many impressions you’ve converted into customers.
View Time
This one shows the total time users spend watching your ads. It's important because it indicates how engaging your ads are to your target audience. View time is usually presented using a line chart to track changes in view time over a period, which can help identify trends and potential areas for improvement.
Video Completion Rate (VCR)
VCR measures the percentage of users who watched the entire ad. This metric indicates the effectiveness of the ad in retaining viewers' attention. VCR can be displayed as a percentage on a bar chart to easily compare different ads' performance.
Engagement Rate
The total number of actions (likes, comments, shares) on your ad divided by the number of views. A high engagement rate indicates that the ad is resonating with the audience. You can present engagement rate as a percentage on a bar chart to compare the performance of various ads.
Cost per Engagement (CPE)
CPE is the average cost of each engagement (like, comment, share) on your ad. Monitoring CPE helps to ensure your ads are generating valuable interactions at an acceptable cost. A line chart is ideal for tracking CPE over time and identifying trends.
Bounce Rate
It’s not exactlyTikTok Ads metrics, but a crucial web analytics Bounce rate is the percentage of users who clicked on your ad but left your website after viewing only one page. A high bounce rate could indicate that the ad is not effectively targeting the right audience. Display bounce rate as a percentage on a bar chart to compare the performance of different ads.
Automate TikTok Ads Dashboards and Reports With Improvado
Manual reporting and data entry takes much of your team’s time and resources. While performance measurement is fundamental for every healthy marketing campaign, the time and effort it takes to draw up a report and keep it up to date make marketing analytics unsustainable.
Instead, you can automate the process and get insightful cross-channel dashboards with real-time data. Improvado can source data from 500+ sources (including a TikTok integration). Then, it cleans your data from duplicates and any redundant data entries that are common when exporting data via APIs.
After a quick setup you can choose one of Improvado’s dashboard templates that aligns with your marketing goals and analyze how your campaigns perform, which platforms drive the highest ROI, and what you can do to improve your cross-channel performance. Reach out to Improvado's team today to find out more.
.png)


.png)
