
Instagram is a central hub for sharing content, experiences, thoughts, and perspectives. In terms of engagement rate Instagram confidently holds second place after Tiktok. Even though Instagram's 0,6% is well away from TikTok's whopping 4,25%, it's still miles better than Facebook's 0,15% and Twitter's 0,05%.
Growing your presence on IG is a must for a D2C brand. However, advertising on Instagram without analyzing your marketing efforts may quickly drain your marketing budget. This guide will walk you through the essential metrics, tools, and best practices for Instagram analytics in 2026, providing a foundation for reliable, impactful social media marketing.
Quick answer
To use Instagram analytics, switch to a Business or Creator account to enable Instagram Insights. Navigate to the Insights tab from your profile menu, review Overview metrics (accounts reached, content interactions, followers) for the past 7 to 90 days, analyze content performance by sorting posts by impressions or engagement, study audience demographics including locations and active hours, and export data for deeper analysis using third-party platforms.
How to use Instagram analytics?
Instagram analytics helps marketers track engagement rates, follower growth, and content performance through Instagram Insights or third-party tools. According to Hootsuite, 90% of Instagram users follow at least one business account, making analytics essential for optimization. Native Instagram Insights provides demographic data, reach metrics, and interaction tracking for business accounts.
- Switch to a Business or Creator account – Access Settings > Account > Switch to Professional Account to enable Instagram Insights
- Navigate to the Insights tab – Tap the menu icon on your profile and select Insights to view performance data
- Review Overview metrics – Check accounts reached, content interactions, and total followers for the past 7-90 days
- Analyze Content performance – Sort posts, stories, and reels by impressions, reach, or engagement to identify top performers
- Study Audience demographics – Examine follower locations, age ranges, gender split, and most active hours for targeting
- Export data for deeper analysis – Use platforms like Improvado to consolidate Instagram metrics with other marketing channels for unified reporting
- Set benchmarks and track progress – Document baseline metrics monthly and measure growth against industry averages (2-3% engagement rate standard)
How to read instagram dashboard?
Reading an Instagram dashboard requires understanding metric hierarchies and identifying performance patterns across engagement, reach, and conversion data points. Start by examining top-level KPIs like follower growth rate and engagement rate, then drill into post-specific metrics. According to Sprout Social, 71% of marketers struggle to interpret Instagram analytics without a structured approach. Focus on trend analysis rather than isolated metrics to identify content strategies that drive measurable business outcomes.
- Check account overview metrics first: Review follower count changes, profile visits, and website clicks from the past 7-30 days
- Analyze engagement rate patterns: Calculate (likes + comments + saves) ÷ reach × 100 for each post type
- Examine audience demographics: Identify top locations, age ranges, and peak activity hours for content scheduling
- Compare content performance: Sort posts by engagement rate to identify top-performing formats (Reels, carousels, static posts)
- Track Stories metrics separately: Monitor completion rates, tap-forwards, and link clicks for ephemeral content
- Review hashtag effectiveness: Measure impressions from hashtags versus home feed to optimize discovery strategies
- Connect metrics to revenue: Link Instagram-driven traffic to conversions using UTM parameters and attribution modeling
Does Instagram provide analytics?
Instagram provides built-in analytics through Instagram Insights for business and creator accounts, offering metrics on content performance, audience demographics, and engagement trends. According to Hootsuite, 90% of Instagram accounts follow at least one business, making native analytics essential for tracking reach and conversions. The platform's analytics dashboard displays data for the past 90 days across posts, stories, reels, and live videos.
| Analytics Feature | Metrics Available | Data Retention |
|---|---|---|
| Content Insights | Reach, impressions, saves, shares, comments | 90 days (2 years for individual posts) |
| Audience Demographics | Age ranges, gender, location, active hours | Rolling 30-day window |
| Stories Analytics | Exits, replies, link clicks, sticker taps | 14 days |
| Reels Performance | Plays, accounts reached, watch time, shares | 90 days |
| Profile Activity | Profile visits, website clicks, email taps | 30 days |
Key Takeaways
- Native vs. Third-Party Tools: While Instagram's built-in 'Insights' offers free, basic analytics for professional accounts, third-party tools provide deeper metrics, competitor analysis, historical data retention, and cross-platform reporting.
- Essential Metrics: To effectively measure performance, focus on key metrics like engagement rate, accounts reached, follower growth, audience demographics (top locations, age, active times), and content-specific performance for Posts, Stories, and Reels.
- Strategic Benefits: Leveraging a robust Instagram analytics dashboard allows marketing professionals to centralize data, monitor campaigns in real-time, save time on manual reporting, and make data-driven decisions to improve social media strategy and ROI.
- Choosing the Right Tool: The best tool depends on your goals. For basic tracking, native Insights is sufficient. For in-depth analysis, competitive benchmarking, and integration with other marketing data, a dedicated analytics platform is necessary.
Free Download: Cross-Channel Social Media Dashboard Blueprint
A step-by-step guide to unifying Instagram, TikTok, Meta Ads and GA4 into one source of truth — with KPI mapping, data architecture diagrams, and a ready-to-use dashboard wireframe.
Download the BlueprintWhy Instagram Analytics Matter

Which one of your recent posts got the most engagement in the past two weeks?
How about last month?
Which hashtags are the most valuable for your audience?
Which ones are you using most frequently?
These are important questions that require answers if you want to achieve more with your marketing campaigns, creatives, or messaging. Tracking your Instagram metrics will help you find those answers.
With all the data about your Instagram efforts, you can diagnose what isn’t working—and adjust your strategy accordingly. A insights-driven strategy considers all past mistakes and failures. This guarantees more cost-efficient and scalable campaigns.
Why You Should Use an Instagram Analytics Dashboard

An Instagram analytics dashboard centralizes key metrics, offering a streamlined, comprehensive view of your Instagram performance. It’s the mission control center for your social media strategy, allowing you to monitor trends, track progress against KPIs, and quickly identify opportunities for optimization.
An Instagram dashboard centralizes key metrics, offering a streamlined, comprehensive view of your Instagram performance, including:
- Centralized data visualization: An Instagram dashboard aggregates data from various Instagram metrics into one accessible location. This centralization simplifies the process of monitoring multiple aspects of your activity, including follower growth, engagement rates, and content performance.
- Time efficiency: The dashboard automates the process, rapidly generating insights that allow marketers to focus on strategic planning and creative development, rather than on data aggregation tasks.
- Real-time monitoring: With an Instagram dashboard, marketers can immediately gauge the impact of their content and campaigns, enabling swift adjustments to optimize performance and audience engagement.
- Campaign tracking: For campaigns spanning multiple posts or involving diverse content types, a dashboard simplifies tracking overall campaign effectiveness. It allows for the evaluation of individual posts and the aggregate impact, aiding in understanding what resonates with the audience.
- Reporting simplification: Creating reports for stakeholders or team members is made easier with a dashboard. Customizable report features enable the extraction of relevant data in a presentable format, facilitating clear communication of Instagram performance and strategy efficacy.
How to Access Instagram Analytics: Native vs. Third-Party Tools

There are two primary ways for a marketer to monitor Instagram analytics and visualize performance data. The path you choose depends on the depth of insight your brand requires.
Using Instagram's Native Analytics (Instagram Insights)
Instagram's built-in analytics tool, known as "Insights," is a free and useful resource for any creator or business account. It provides a solid foundation for understanding your account's performance.
How to Access Your Professional Dashboard
To view Instagram Insights, you must have a Professional (Business or Creator) account. You can access it directly from your profile page by tapping the Professional dashboard button located under your bio.
Key Metrics Available in Instagram Insights
Instagram Insights is organized into three main categories:
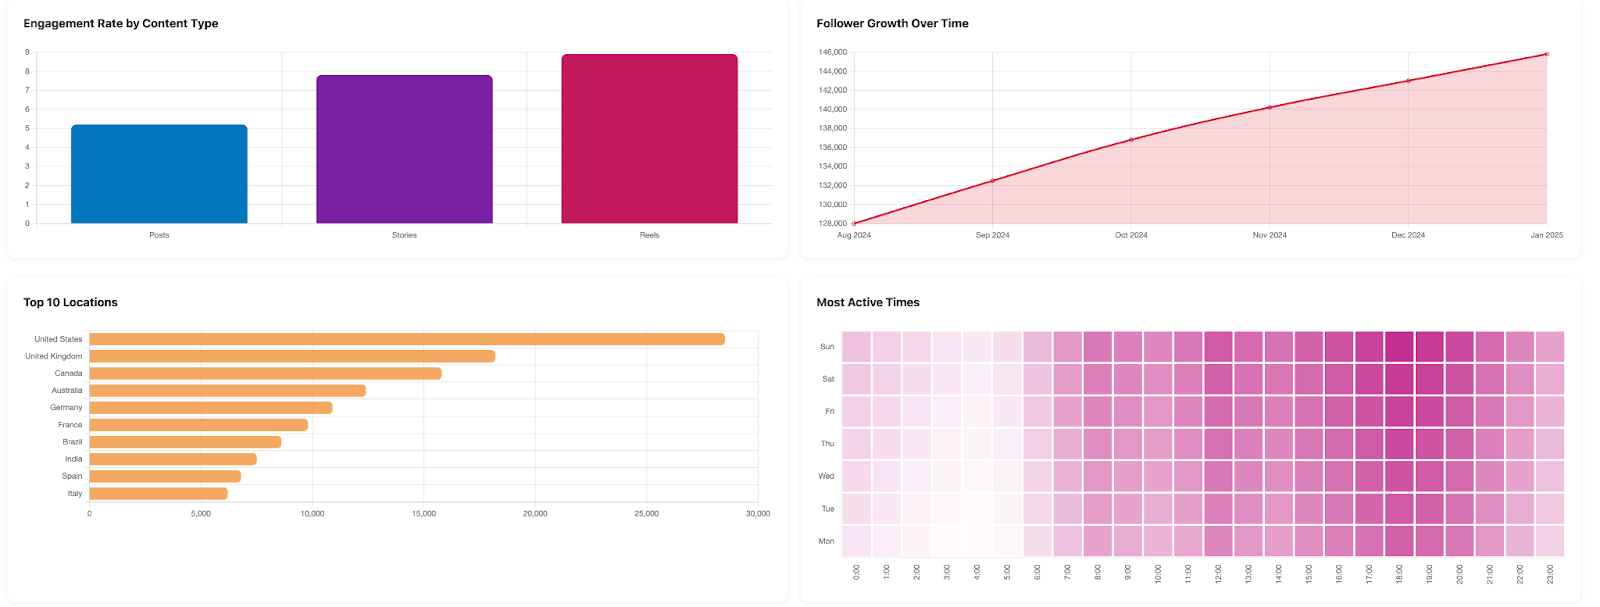
- Overview: This section shows top-level metrics like Accounts Reached, Accounts Engaged, and Total Followers over the last 7, 14, 30, or 90 days.
- Audience: Here you’ll find data on your follower growth, top locations, age range, gender, and most active times.
- Content: This area provides performance data for individual Posts, Stories, and Reels, allowing you to see what content resonates most with your audience.
The Limitations of Native IG Analytics
While convenient, Instagram Insights has significant limitations for serious marketing professionals. Its data retention is capped at 90 days, making long-term trend analysis impossible.
The biggest drawback of in-app analytics is that it lacks depth in user behavior analysis, customer journey tracking, and cross-platform performance comparison, which are crucial for a holistic view of marketing efforts and their cost-effectiveness.
Instagram's in-app analytics operate in isolation and don't integrate with other digital platforms or offline channels, making it difficult to analyze the overall effectiveness of omnichannel marketing strategies.
The Advantages of Third-Party Instagram Analytics Tools
A third-party analytics tool is essential for marketing professionals who need to move beyond basic metrics. These platforms are designed to overcome the limitations of the native app and provide more strategic value.
Deeper Performance Insights
Third-party tools offer more granular metrics, such as hashtag performance analysis, optimal posting time recommendations based on historical data, and more sophisticated engagement rate calculations. This allows for a more in-depth analysis of your content strategy.
Historical Data Retention
Unlike Instagram's 90-day window, most third-party platforms offer extended, and sometimes unlimited, access to your historical data. This is crucial for tracking year-over-year growth, identifying long-term trends, and understanding seasonal patterns in audience behavior.
Competitor Analysis and Benchmarking
One of the most significant advantages of third-party tools is the ability to monitor your competitors. You can track their follower growth, engagement rates, and top-performing content, providing valuable benchmarks to measure your own performance against the industry standard.
Cross-Channel Reporting

While many analytics tools show data from multiple social platforms, they often fail to connect it with your broader marketing efforts. For enterprise brands, the real challenge is integrating Instagram data with metrics from paid search, programmatic ads, and CRM systems.
An AI-powered marketing analytics platform like Improvado automates this process, connecting data from over 500 sources to provide a unified view of your entire marketing performance, not just social media.
Key Instagram Metrics to Track in Your Dashboard
To get a complete picture of your performance, your Instagram analytics dashboard should include a mix of metrics covering reach, engagement, audience growth, and content effectiveness.
- Impressions and Reach: Measure total visibility and unique audience exposure to understand how effectively your content is expanding brand awareness.
- Engagement Rate: Track the ratio of likes, comments, shares, and saves to total reach. A high engagement rate signals content resonance and community interaction.
- Follower Growth: Monitor how your audience base evolves over time to evaluate the effectiveness of content strategy, campaign frequency, and organic growth.
- Video Views and Watch Time: Assess how long users are engaging with Reels and videos to identify high-performing creative formats that sustain attention.
- Click-Through Rate (CTR): Evaluate the percentage of viewers who clicked on your bio link, ad CTA, or tagged products to determine content’s ability to drive traffic and intent.
- Conversion Rate: Link Instagram engagement to measurable outcomes like purchases, form submissions, or app installs to gauge true ROI.
- Cost per Result (CPR) / Cost per Acquisition (CPA): Compare advertising spend against the desired outcome to measure campaign efficiency and profitability.
- Ad Frequency: Track how often the same user sees your ad to prevent fatigue and maintain campaign performance.
- Saves and Shares: Identify content that resonates deeply with your audience — posts that users save or share indicate long-term value and virality potential.
- Story Completion Rate: Measure the percentage of users who viewed an entire Story sequence to evaluate storytelling effectiveness.
- Engaged Audience Demographics: Analyze audience age, location, and interests to fine-tune targeting and creative personalization.
- Hashtag and Keyword Performance: Understand which hashtags or keywords drive discovery and engagement to optimize content reach organically.
- Post Timing and Frequency Metrics: Identify when your audience is most active and how posting cadence affects engagement and reach.
- Top Performing Creatives: Highlight visuals, captions, and CTAs that deliver above-average results to inform future campaign optimization.

Free Instagram Analytics Tools (2026)
Not every marketer needs enterprise-grade dashboards to track Instagram performance. A growing range of free or freemium analytics tools now provide impressive functionality, covering audience growth, engagement, and content optimization.
These solutions are ideal for individual creators, small businesses, and early-stage agencies testing data-driven strategies without heavy software costs.
1. HypeAuditor – Free Influencer Audit
Best for: Brands and agencies vetting influencer authenticity
HypeAuditor offers one of the most accurate free influencer audits available. It evaluates any public Instagram account across 35+ metrics, including audience demographics, engagement rate, and follower quality.
- Detects fake or bot followers automatically.
- Generates an Audience Quality Score (AQS) and growth history.
- Provides a free engagement rate calculator.
2. Iconosquare – Free Audit and Professional Insights
Best for: Agencies and social media managers
Iconosquare delivers a free Instagram audit evaluating your profile health and engagement on the last 30 posts. Its paid suite expands into scheduling, competitor benchmarking, and automated reporting, making it a hybrid analytics and publishing powerhouse.
3. InstaFollow – Mobile Follower Tracker
Best for: Influencers and small business owners
This mobile app focuses on follower dynamics – showing who follows, unfollows, or engages least. It’s simple yet effective for tracking community churn, spotting inactive followers, and understanding how campaigns affect audience retention.
4. Combin – Growth and Basic Analytics
Best for: Small agencies managing multiple accounts
Combin merges light analytics (growth tracking, engagement stats) with manual audience targeting. Users can discover potential followers by hashtag or location and engage directly within the dashboard. Its free plan covers one profile and basic daily actions.
5. Instagram Insights – The Native Standard
Best for: All Business and Creator accounts
Built into the app, Instagram Insights provides the most accurate metrics directly from Meta’s API, covering reach, impressions, engagement, and audience demographics. While it lacks export and competitor views, it remains essential for foundational analytics.
6. Pixlee TurnTo – Free UGC and Influencer Insights
Best for: E-commerce brands leveraging community content
Pixlee’s free weekly reports measure follower growth, engagement, and hashtag performance while identifying brand ambassadors and UGC contributors. It helps quantify the ROI of user-generated content and spot micro-influencers already promoting your brand.
7. Squarelovin – Content and Influencer Dashboard
Best for: E-commerce and influencer marketers
Squarelovin visualizes engagement trends, follower growth, and optimal posting times. It doubles as a lightweight influencer CRM, letting brands track creator performance and manage UGC libraries, all from a clean interface.
8. Wolf Global – Peer Benchmarking
Best for: Influencers in engagement networks
Born from the largest Instagram engagement pod community, Wolf Global provides free analytics that compare your engagement rate and activity against industry averages. While valuable for benchmarking, results can be inflated by pod-based engagement.
9. TrendHERO – Freemium Influencer Analytics
Best for: Micro-influencers and small agencies
TrendHERO audits Instagram profiles across 90+ metrics, highlighting audience authenticity and fake followers. The free plan offers one full report for accounts under 10K followers, while paid tiers unlock unlimited analysis and influencer discovery.
Paid Instagram Analytics Tools (2026)
For marketers managing multiple profiles, teams, or clients, paid Instagram analytics platforms provide advanced features: unlimited data history, competitor benchmarking, automated reports, ROI measurement, and multi-user collaboration. These tools transform raw metrics into business intelligence.
1. HypeAuditor – Full Influencer Marketing Suite
Best for: Agencies managing influencer programs
HypeAuditor’s paid version expands far beyond audits. Users gain access to a database of 68M+ influencers, AI-powered fraud detection, audience interest mapping, and cross-platform analytics (Instagram, TikTok, YouTube). Campaign dashboards calculate reach, engagement, and ROI in real time.
Pricing: Custom enterprise plans.
2. Iconosquare – Professional Analytics & Scheduling
Best for: Agencies and multi-brand marketing teams
Iconosquare’s paid plans add multi-account management, competitor tracking, and detailed hashtag performance reports. Team features include shared calendars, permissions, and white-labeled client reports.
Pricing: From ~$49/month per bundle of social profiles.
3. Kicksta – Growth Analytics and Audience Targeting
Best for: Creators seeking organic follower growth
Kicksta automates likes to attract real followers, showing results through an in-platform growth analytics dashboard. Features include AI-based targeting, blacklist filters, and engagement rate tracking.
Pricing: $49–$99/month with a 14-day refund policy.
4. Tailwind – Scheduler with Built-In Analytics
Best for: Small businesses and content creators
Tailwind merges scheduling, content design, and analytics for Instagram and Pinterest. Its SmartSchedule AI suggests optimal posting times and hashtags, while the dashboard tracks likes, comments, and saves per post.
Pricing: $12–$30/month (Pro–Advanced plans).
5. Sprout Social – Enterprise Social Intelligence
Best for: Large brands and agencies managing multiple networks
Sprout Social consolidates analytics across Instagram, Facebook, X, LinkedIn, and TikTok. Features include competitor benchmarking, Stories analytics retention, social listening, and branded PDF reporting. It’s among the most comprehensive all-in-one solutions.
Pricing: From ~$249/month per user.
6. Pixlee TurnTo – UGC ROI Measurement
Best for: Brands leveraging user-generated content
Pixlee’s enterprise suite ties UGC engagement metrics to measurable outcomes, revealing which customer photos or influencer posts drive conversions. It also streamlines ambassador identification and UGC rights management.
Pricing: Custom, with a free analytics tier available.
7. Squarelovin – Influencer Campaign Performance
Best for: E-commerce brands running influencer programs
Squarelovin’s premium version adds ROI tracking, influencer attribution, and UGC management. Brands can analyze sales impact from influencer partnerships directly alongside Instagram performance.
Pricing: Basic plan free; enterprise custom pricing.
Comparison: Paid Instagram Analytics Platforms
| Attribute | HypeAuditor | Iconosquare | Kicksta | Tailwind | Sprout Social | Pixlee TurnTo | Squarelovin |
|---|---|---|---|---|---|---|---|
| Notable Strengths | Influencer discovery and fraud detection | All-in-one analytics, scheduling | Automated organic growth tracking | Smart scheduling + hashtag data | Enterprise-grade cross-channel suite | UGC and community ROI analytics | Influencer ROI and content performance |
| Key Features | 68M+ profiles, campaign ROI tracking | Competitor tracking, white-labeled reports | AI targeting, engagement analytics | AI post timing, visual planner | Competitor benchmarking, listening, CRM | Influencer discovery, UGC tracking | UGC library, campaign attribution |
| Starting Price | Custom | $49/mo | $49–$99/mo | $12–$30/mo | $249+/mo | Custom | Custom |
| Ideal For | Agencies, enterprise influencer teams | Social media teams | Creators and SMBs | Bloggers and small businesses | Agencies and large brands | Brand and e-commerce marketers | E-commerce teams |
3 Best Practices For Building Your Instagram Dashboard

Once you have your tool, follow these best practices to get the most out of your Instagram data.
1. Combine Data to See the Big Picture
Your Instagram performance doesn't exist in a vacuum. Combining Instagram data with your other marketing channels is critical for understanding the full customer journey. Manually exporting and merging data is prone to errors and wastes valuable time.
This is where a solution like Improvado becomes essential for marketing leaders. It automatically aggregates all your data into a single source of truth, allowing you to see how Instagram campaigns influence website conversions, sales pipeline, and overall marketing ROI without any manual work.
2. Automate When Possible
The best analytics strategy is one you can stick with consistently. Don’t waste your time with DIY solutions that require manual data collection. Opt for a solution that automatically sources data from Instagram and other platforms to generate actionable insights, freeing your team to focus on analysis and strategy.
3. Use Data Storytelling and Visualizations
Data is only useful if it can be understood. Use your Instagram dashboard to create clear visualizations that show how each metric relates to the next. A good dashboard tells a story, highlighting trends, celebrating wins, and flagging areas for improvement in a way that is easy for anyone on your team to understand.
Conclusion
Most marketers still evaluate Instagram performance in isolation, focusing on likes, reach, and follower growth. But real impact comes from understanding how Instagram contributes to the full marketing funnel.
How do Instagram Ads assist conversions driven by Google or Meta?
Does engagement on Reels correlate with higher brand searches or site traffic?
Without integrating Instagram analytics into your broader marketing data stack, it’s nearly impossible to answer these questions with confidence or allocate budget effectively.
Improvado solves this by unifying Instagram data with every other marketing and advertising source in a single governed pipeline. It automatically normalizes metrics, connects paid and organic performance, and makes it easy to analyze Instagram’s contribution to awareness, engagement, and ROI alongside all other channels. Ready to see how unified marketing analytics can transform your decision-making?
Book a demo with Improvado and uncover how Instagram truly drives growth across your campaigns.

