Marketing and analytics teams today face an overwhelming volume of fragmented data. KPIs that drive strategic decisions lose their impact without a precise and reliable way to communicate them.
Static dashboards and outdated BI stacks often create bottlenecks, slowing down decisions and masking insights behind cluttered or incomplete visuals.
This article explores the 23 most effective data visualization tools of 2025, covering platforms that go beyond basic charting to deliver scalability, automation, and integration across complex marketing data pipelines.
TL;DR
We’ve broken the tools into three groups to make comparison easier:
- Business intelligence and analytics platforms built for robust, enterprise dashboards,
- Developer and open-source tools, for teams that need maximum flexibility and control
- Specialized and lightweight tools, designed for quick visualizations, infographics, and simple use cases.
| Tool | Best For | Pricing |
|---|---|---|
| Improvado | Marketing data aggregation and BI-ready insights delivery | Custom |
| Tableau | Enterprise-grade visual analytics and dashboards | Starting at $70/user/month |
| Power BI | Microsoft-integrated BI for analysts and teams | Starting at $20/user/month |
| Looker | Semantic modeling with embedded analytics | Custom |
| Looker Studio | Free dashboards linked to Google ecosystem | Free |
| Qlik Sense | Associative data exploration for large datasets | Custom |
| MicroStrategy | Enterprise BI with mobile and embedded insights | Custom |
| Sisense | Single-stack BI with in-chip analytics | Custom |
| Domo | All-in-one cloud data-to-dashboard platform | Custom |
| Yellowfin BI | Embedded storytelling and collaboration dashboards | Custom |
| Zoho Analytics | Self-service analytics for small to mid-size teams | Starting at $24/user/month |
| D3.js | Custom, interactive visualizations for developers | Free |
| Chart.js | Simple, lightweight charts for web developers | Free |
| Grafana | Real-time monitoring dashboards (time series) | Free (open source) |
| Plotly | Scientific and technical charting (Python, JS) | Free for OSS; paid for enterprise |
| Highcharts | Commercial JS charting with polished visuals | Custom (Licensing) |
| FusionCharts | Rich JS charts with enterprise features | Custom (Licensing) |
| Chartist.js | Responsive charts with minimalist design | Free |
| Polymaps | Tile-based geographic visualizations | Free |
| Infogram | Quick infographics and visual content | Starting at $19/month |
| Datawrapper | Publish-ready charts for editors and analysts | Free tier; paid plans start ~$49/month |
| ChartBlocks | Simple online chart builder for non-technical users | Free tier; paid starts ~$24/month |
| RAWGraphs | Open-source for complex, unconventional visual models | Free |
Now, let’s explore 23 of the best data visualization tools in 2025, organized by category and use case.
Business Intelligence & Marketing Analytics Platforms
This section reviews full-stack platforms that combine business intelligence and marketing analytics in a single environment. They bring together data integration, modeling, and visualization under one roof, reducing the need for multiple tools.
Most include drag-and-drop dashboard builders, semantic layers for consistent metric definitions, and governance controls to manage access and versioning across large teams.
1. Improvado
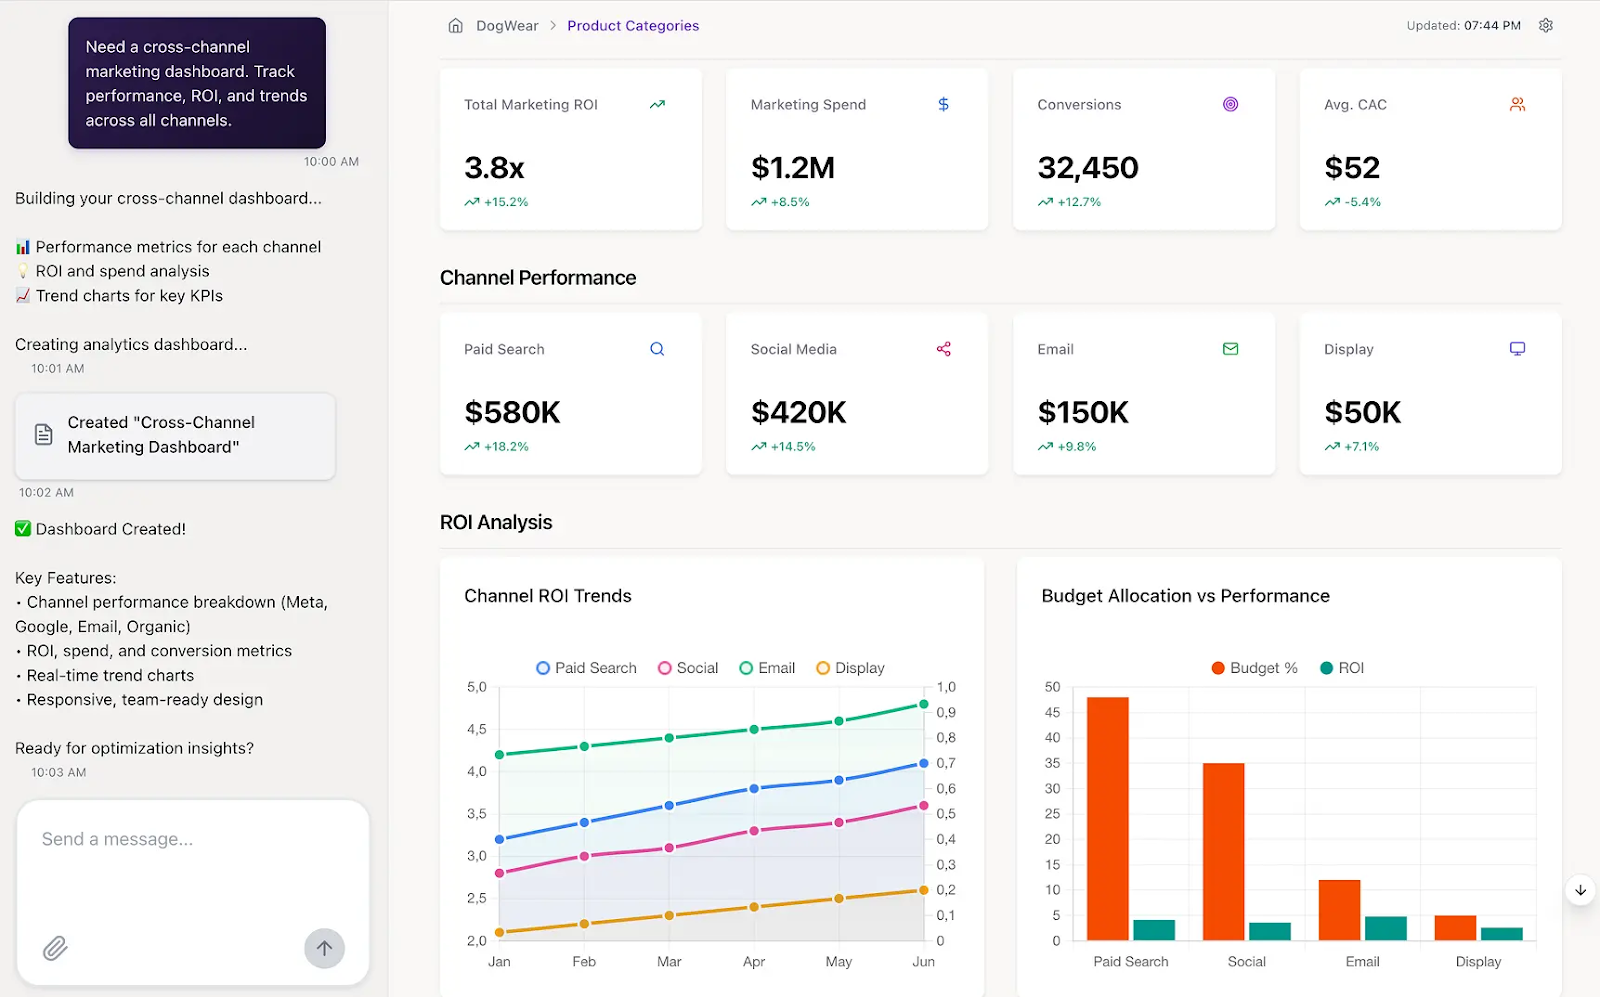
Improvado is a unified, AI-powered marketing analytics and intelligence platform that consolidates enterprise marketing data infrastructure. It replaces fragmented ETL, BI, and attribution tools with a single end-to-end solution that automates the entire pipeline.
Key capabilities:
- Data Extraction & Loading: Access over 500 pre-built connectors with unlimited account integrations. Improvado automates extraction from ad platforms, CRMs, and analytics tools, ensuring raw marketing data is always up-to-date and reliable.
- Data Transformation Engine: A no-code environment for modeling and harmonization with 15+ pre-built data models for common marketing use cases and full customization options. Complex attribution rules, normalization, and custom KPIs are handled without writing SQL, making transformation scalable and repeatable.
- Marketing Data Governance: Enforce 250+ automated campaign rules and naming conventions module powered by AI. This module eliminates human error, ensures consistency in taxonomy across platforms, and alerts on metric drops.
- Business Intelligence Enablement: Push clean, governed data directly into BI tools or leverage Improvado’s visualization layer. Pre-built dashboards are available for common use cases, and generative AI dashboards allow analysts to create new visualizations on demand.
- Attribution & Analytics Suite: Run multi-touch attribution (MTA), marketing mix modeling (MMM), and cross-channel performance analysis. This suite provides the foundation for measuring incremental impact and proving ROI across digital and offline channels.
- AI Agent: A natural language analytics assistant that generates dashboards and visualizations from plain-language prompts. Beyond reactive querying, the Agent delivers proactive insights, alerts, and performance summaries, turning data into decisions faster.
Improvado Pricing
Improvado operates on a quote-based pricing model tailored to each client’s data volume and needs.
All plans include access to 500+ connectors and allow unlimited accounts per data source, without restricting sources or users. Each tier also includes customization credits and professional services for a tailored setup.
Implementation support, managed services, and compliance features (SOC 2, HIPAA, GDPR) scale with plan level, while AI-enabled capabilities—like the AI Agent and marketing data governance—are available through configurable add-ons across all packages.
Book a demo call to discuss your data needs and business objectives and get a custom quote.
2. Tableau
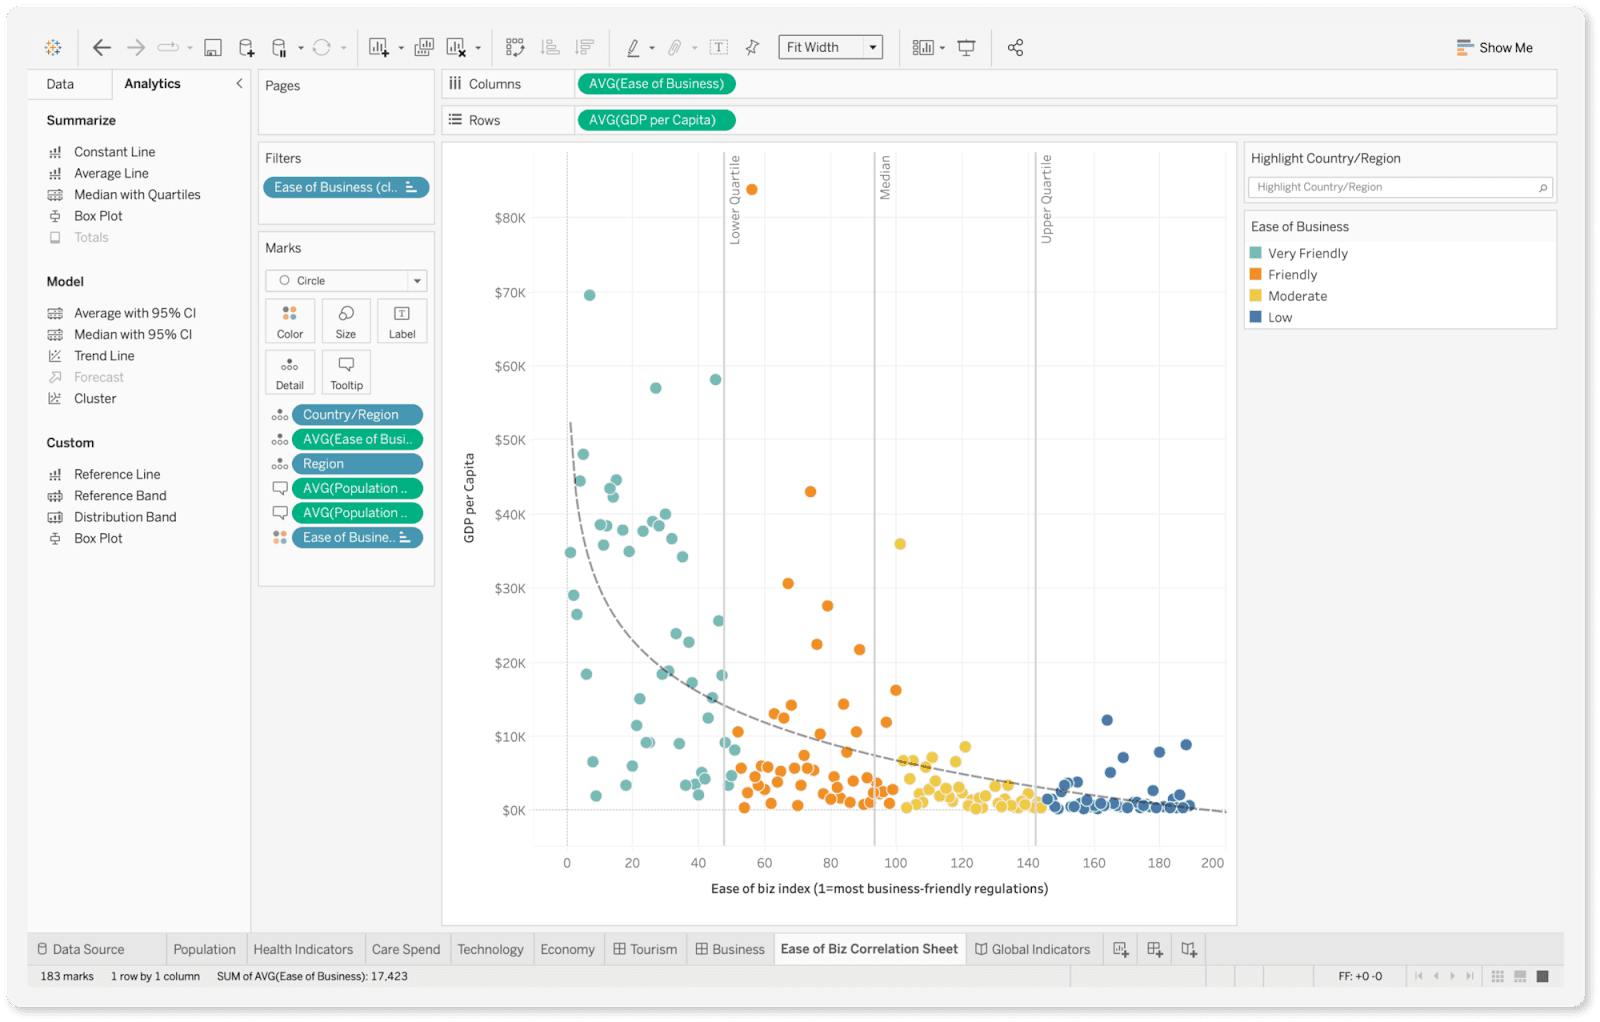
Tableau is one of the most popular BI and data visualization tools.
Known for its easy-to-use drag-and-drop interface and powerful analytical capabilities, Tableau enables users to create interactive dashboards, reports, and charts without coding. It supports a broad range of data sources, from spreadsheets to cloud databases.
Key capabilities:
- Rich Visualizations: Tableau provides interactive, highly customizable, and shareable visuals, from simple bar and line charts to advanced geospatial maps, scatter plots, and heat maps. Its drag-and-drop interface reduces the technical barrier to creating complex dashboards.
- Data Connectivity: Tableau connects natively to dozens of data sources, including Microsoft Excel, SQL databases, cloud warehouses, and big data platforms such as Hadoop and Apache Spark. It also integrates with enterprise systems such as SAP and Salesforce, and supports real-time connections for continuously updated datasets.
- Advanced Analytics Integration: Users can enrich dashboards with predictive models, clustering, trend lines, and statistical calculations directly in Tableau. It also integrates with R and Python for advanced analytics, machine learning, and custom statistical modeling.
- Enterprise & Cloud Options: Tableau offers flexible deployment, including Desktop, Server for on-premise enterprises, and Online for fully managed cloud analytics.
- Collaboration & Sharing: Dashboards can be published, shared, and embedded across teams. Tableau Server and Tableau Online allow governed, role-based access to ensure data security while still enabling collaboration and self-service analytics.
Tableau Pricing
Tableau pricing is role-based , rather than a single flat fee.
Costs depend on the type of user license—Creator, Explorer, or Viewer—with each tier granting different levels of functionality, from full data preparation and dashboard building down to read-only access.
Pricing also varies by deployment model: Tableau Cloud (hosted by Salesforce) or Tableau Server (self-hosted on-premise or private cloud).
For enterprises, pricing is determined by the mix of license types, number of users, and chosen deployment model, with volume discounts and enterprise agreements often available.
3. Microsoft Power BI
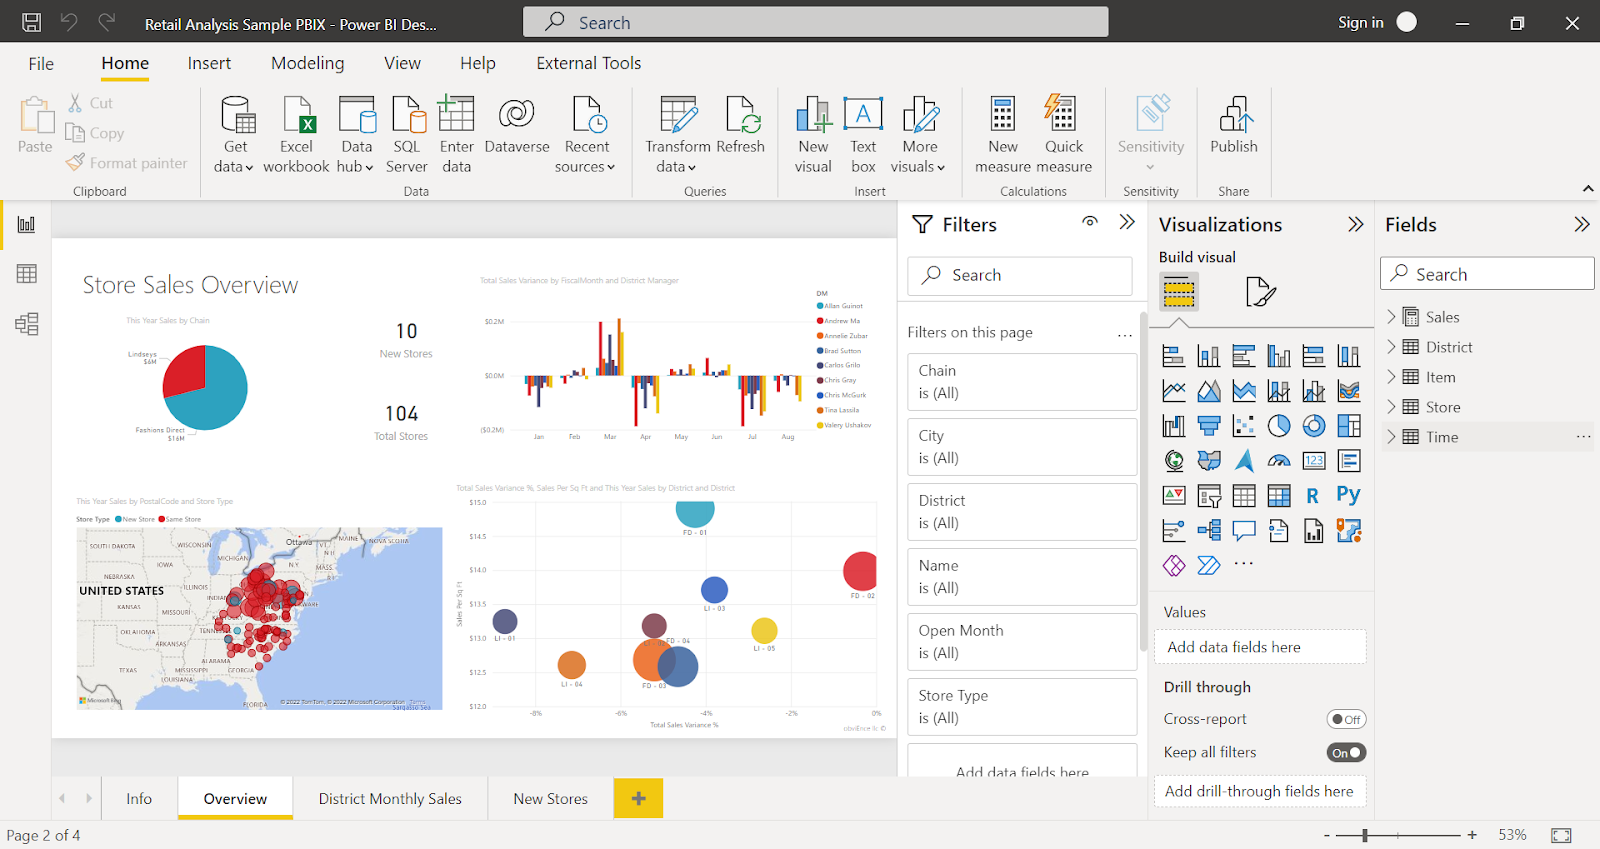
Power BI is Microsoft’s flagship business analytics tool, offering a suite for data visualization and reporting. It seamlessly integrates with the Microsoft ecosystem (Excel, Azure, SQL Server, and other products and platforms), making it a convenient option for organizations already using Microsoft products.
Key capabilities:
- Data Connectivity & Integration: Connects to hundreds of data sources, including Excel, SQL Server, Azure, Salesforce, Google Analytics, and major cloud data warehouses. Strong integration with the Microsoft ecosystem (Azure Synapse, Dynamics 365, Office 365) makes it a natural choice for enterprises already on the Microsoft stack.
- Data Modeling & Transformation: Built-in Power Query enables ETL-style transformations with a user-friendly interface. Analysts can clean, shape, and join datasets, or use DAX (Data Analysis Expressions) for advanced modeling and calculated measures.
- Rich Visualizations & Dashboards: Power BI offers interactive dashboards and a wide range of visualizations, with access to custom visuals through the AppSource marketplace. Visuals are dynamic, supporting drill-downs and cross-filtering for deeper insights.
- AI & Advanced Analytics: Native AI capabilities include anomaly detection, natural language Q&A, automated insights, and integration with Azure Machine Learning. This allows predictive modeling and advanced analytics directly within dashboards.
- Collaboration & Sharing: Dashboards and reports can be published to the Power BI Service for web and mobile access. Seamless integration with Microsoft Teams and SharePoint facilitates easier collaboration across enterprise teams.
Power BI Pricing
Power BI pricing is tiered based on functionality and deployment needs. The entry-level option provides individual users with basic dashboarding and reporting capabilities. Organizations that need collaboration, sharing, and enterprise-scale usage move to per-user licenses with more advanced features.
For large enterprises, Power BI Premium is offered either per user or per capacity, providing dedicated cloud compute, larger dataset sizes, advanced AI features, and on-premises deployment via Power BI Report Server.
4. Looker
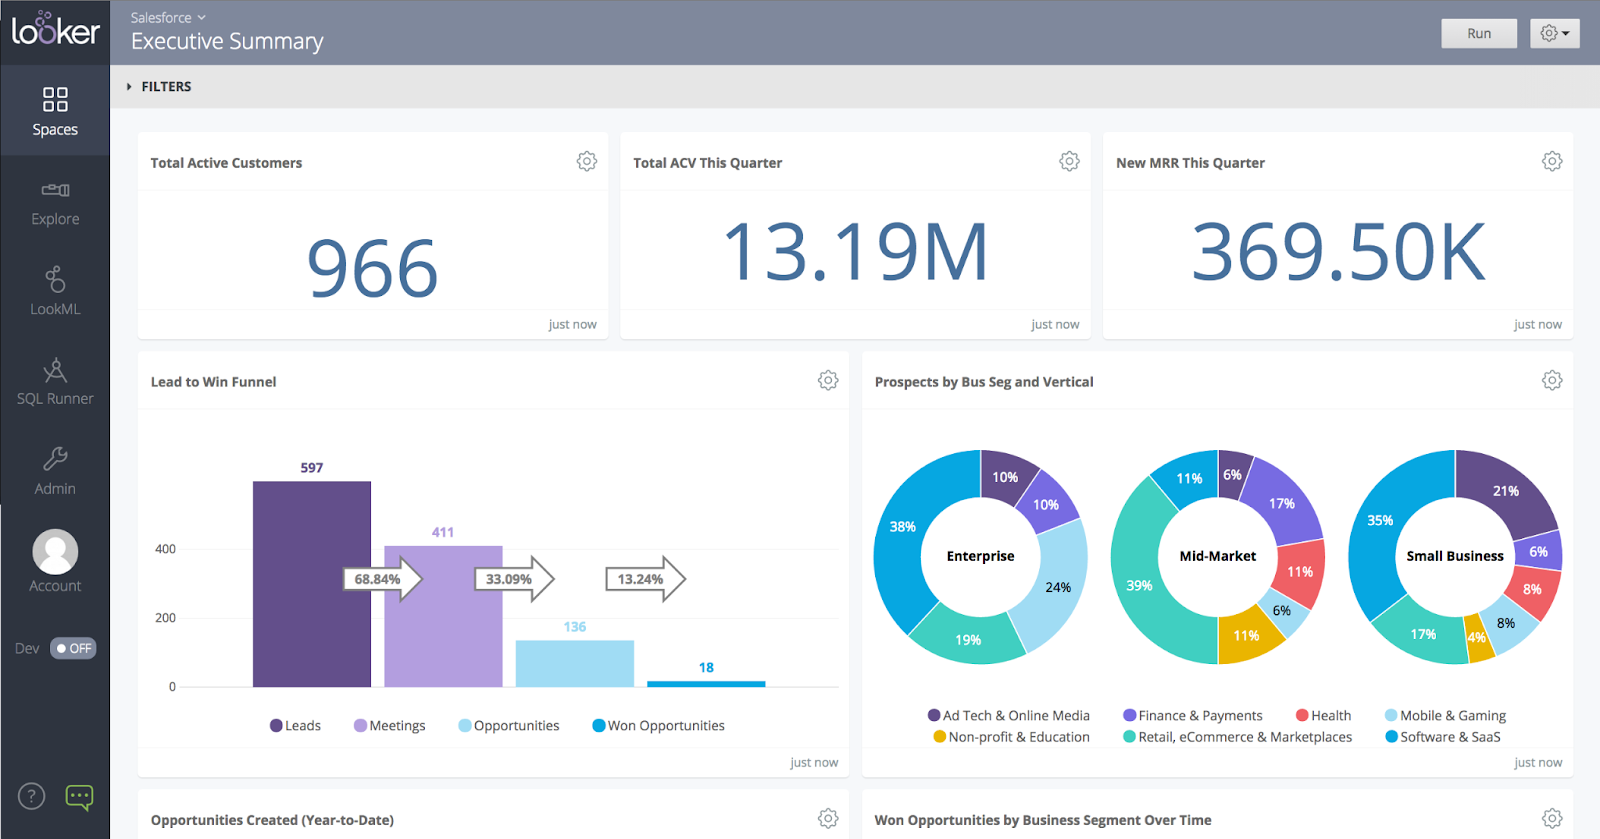
Looker is a cloud-based data visualization and analytics platform known for its unique modeling layer (LookML). Unlike drag-and-drop tools, Looker emphasizes a central data model that defines business metrics consistently, which then can be explored via visualizations.
Key capabilities:
- Centralized Data Modeling: LookML defines business logic, KPIs, and metrics once, ensuring consistent definitions across dashboards and teams.
- Seamless Data Connectivity: Connects natively to leading cloud data warehouses (BigQuery, Snowflake, Redshift, Databricks) and queries data in place without extracts.
- Interactive Dashboards & Visualizations: Offers customizable dashboards, drill-down exploration, and the ability to embed analytics in web portals and applications.
- Advanced Analytics & Extensions: Supports SQL-based exploration, custom visualizations, and integrates with tools like Python, R, and TensorFlow for advanced analysis.
- Collaboration & Workflow Integration: Delivers scheduled reports, alerts, and embeds directly into Slack, Gmail, or custom workflows.
- Governance & Security: Provides role-based access control, versioning for LookML, and integration with enterprise security protocols.
Looker Pricing
Looker pricing is custom and usage-based, rather than flat per-user tiers. Costs typically depend on several factors:
- Number and type of users: developers, viewers, or embedded analytics users.
- Deployment scale: data volume, queries processed, and concurrency needs.
- Features required such as embedded analytics, API access, or advanced governance.
- Support level and enterprise agreements.
Because of this, Looker doesn’t publish standard pricing.
5. Looker Studio (Former Google Data Studio)

Looker Studio, formerly known as Google Data Studio, is Google’s free web-based data visualization tool.
It allows anyone with a Google account to create shareable reports and dashboards by connecting to various data sources, including many Google products and external sources.
Key capabilities:
- Free Data Visualization Tool: Offers a user-friendly, no-cost option for creating dashboards and reports.
- Native Google Integrations: Connects seamlessly to Google products, including Google Analytics, Google Ads, BigQuery, and Sheets, making it especially useful for marketing data analysis.
- Custom Data Connectivity: Supports third-party connectors for non-Google platforms (for example, Facebook Ads, LinkedIn), although many advanced connectors are available only through paid partnerships.
- Interactive Dashboards: Offers drag-and-drop functionality for building charts, tables, and filters. Users can share live, interactive dashboards with role-based permissions.
- Collaboration Features: Built on Google Drive, it enables multiple users to collaborate in real-time and share dashboards as easily as Google Docs.
6. Qlik Sense
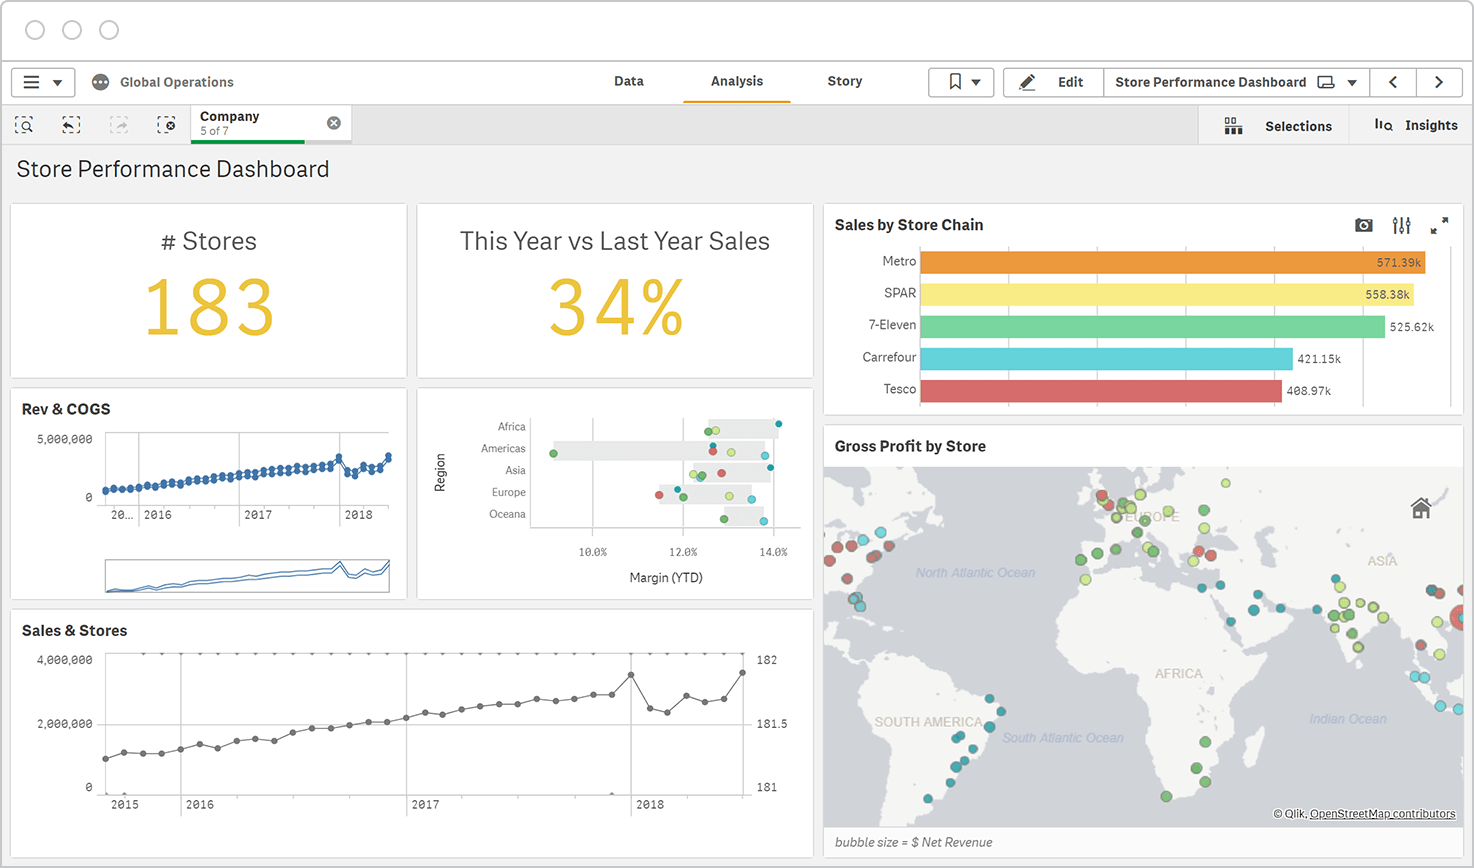
Qlik Sense is a modern data analytics platform from Qlik that enables interactive data exploration and visualization, allowing users to slice and dice data without losing context.
Key capabilities:
- Interactive Dashboards: Qlik Sense provides drag-and-drop functionality for creating highly customizable dashboards. Users can drill down, filter, and explore data in real time with governed access controls.
- Associative Data Engine: Unlike traditional query-based tools, Qlik’s associative engine lets users explore data relationships across multiple sources without being restricted to predefined queries.
- Advanced Analytics Integration: Connects with R, Python, and other machine learning frameworks to extend dashboards with predictive analytics and statistical models.
- Data Connectivity & Integration: Supports a wide range of data sources, including cloud warehouses, on-prem databases, big data platforms, and APIs, with both live and in-memory connections.
- AI-Powered Insights: Features augmented analytics with natural language search, automated insights, and smart visualizations to guide users toward patterns and anomalies.
- Collaboration & Sharing: Dashboards and reports can be shared across teams, embedded into apps, or integrated with other enterprise systems.
- Enterprise Scalability & Security: Provides enterprise-grade governance, security, and multi-cloud deployment (SaaS, on-prem, hybrid), making it adaptable to large-scale rollouts.
Qlik Sense Pricing
Qlik Sense follows a subscription, role-based pricing model
- Professional user licenses: Full access to create, share, and manage dashboards and applications.
- Analyzer user licenses: For users who primarily explore, filter, and interact with existing dashboards.
- Capacity-based options: For enterprises, pricing can also be based on usage capacity (data volume, compute resources) rather than per user.
For enterprises, pricing can also be capacity-based, reflecting data volume and compute needs. Costs vary by deployment (SaaS, on-prem, or hybrid) and are typically customized for large-scale rollouts.
7. MicroStrategy
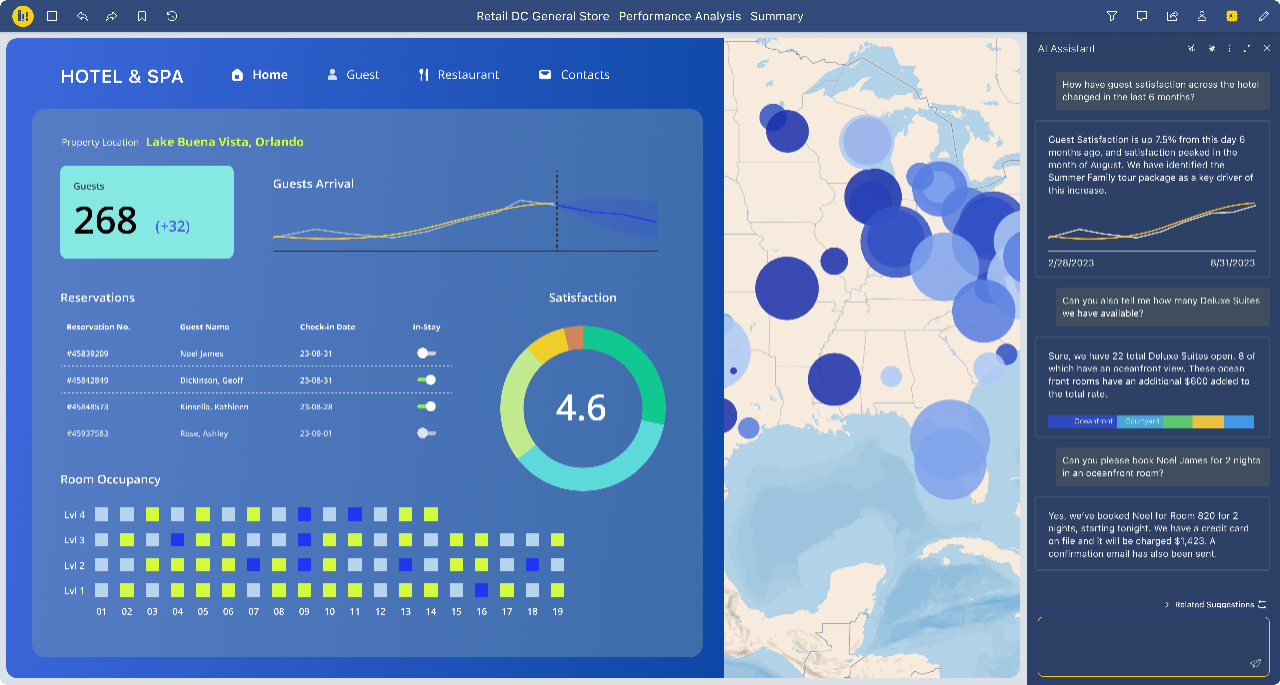
MicroStrategy is a long-established enterprise BI platform known for its strong analytical depth and enterprise features. It provides tools for data visualization, advanced analytics, and even mobile app deployment. MicroStrategy is used by large organizations that need scalability and strong security/governance.
Key capabilities:
- Enterprise-grade business intelligence: MicroStrategy provides scalable BI capabilities designed for large organizations, enabling consistent reporting and analytics across complex data environments.
- Data Connectivity and Integration: It connects to a wide range of sources—cloud warehouses, relational databases, APIs, and flat files, so teams can unify insights from fragmented systems.
- Advanced Data Visualization: Users can build interactive dashboards with drill-downs, filters, and responsive layouts tailored for both executive overviews and deep-dive analysis.
- HyperIntelligence: A unique feature that surfaces contextual data instantly inside everyday applications like email, CRM, or browsers, reducing time spent switching between tools.
- Self-Service Analytics: Business users can create dashboards and reports without heavy IT reliance, accelerating access to insights while maintaining governance.
- Predictive and Augmented Analytics: The platform integrates with machine learning and AI models to deliver predictive forecasts, anomaly detection, and natural language querying.
- Mobile BI: Native mobile apps deliver dashboards, alerts, and offline analysis, ensuring leaders can access insights on the go.
- Embedded Analytics: Organizations can embed analytics directly into applications, portals, or workflows, enabling insights at the point of decision.
MicroStrategy Pricing
MicroStrategy's pricing is not publicly available, contact the team to get a quote.
8. Sisense
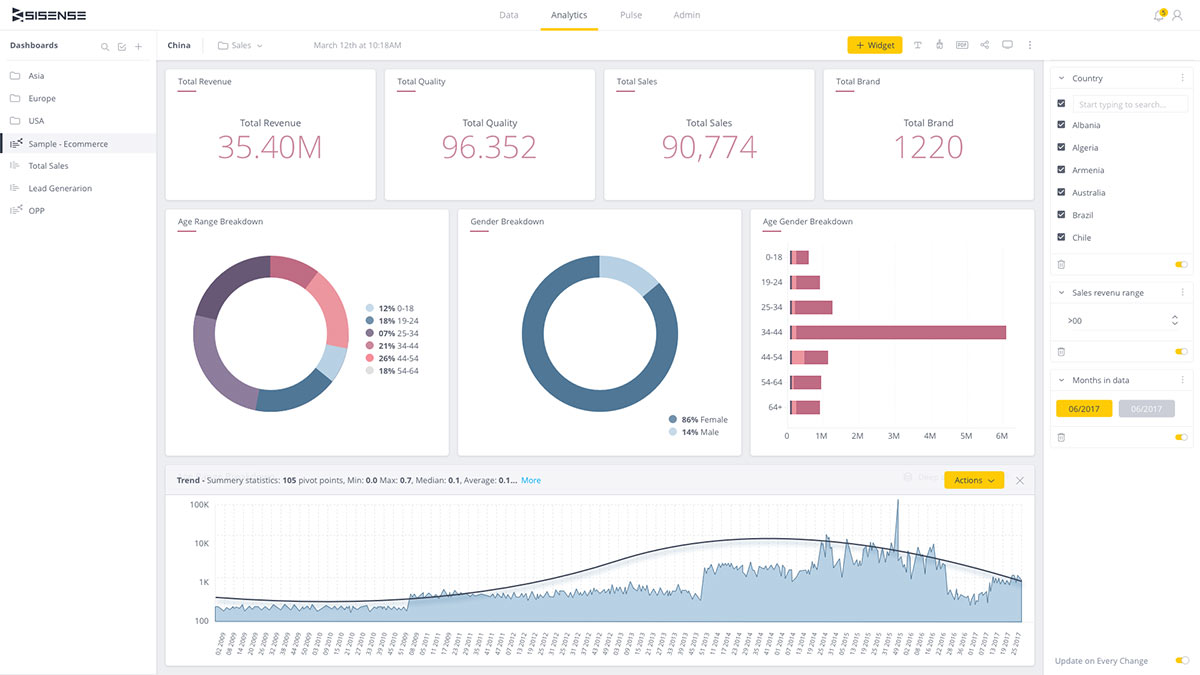
Sisense is an end-to-end BI platform that allows businesses to integrate data from multiple sources and create interactive dashboards. Sisense is known for its embedded analytics capabilities – allowing companies to infuse dashboards and analytics into their own products or internal portals with ease.
Key capabilities:
- Single-Stack Architecture: Sisense includes its own database engine (touted for speed with in-chip technology) and a front-end for visualization, meaning you don’t necessarily need a separate data warehouse or ETL tools for moderate data volumes. It can mash up data on the fly from many sources.
- Embedded Analytics: A highlight is the ability to white-label Sisense dashboards or integrate them seamlessly into other software via APIs and SDKs. If you want to provide analytics to your clients within your product, Sisense is a strong contender.
- AI and NLQ: Sisense also offers AI-driven features like natural language query (NLQ) – users can ask questions in plain English and get charts as answers.
- Extensible APIs and SDKs: Developers can embed dashboards, customize functionality, and integrate Sisense into broader applications or workflows via robust APIs and developer toolkits.
- AI and Predictive Analytics: Sisense integrates machine learning models and natural language querying to support advanced analytics use cases, including anomaly detection and predictive forecasts.
- Self-Service BI: Non-technical users can explore data, create dashboards, and run ad hoc queries through a drag-and-drop interface, while still maintaining governance and control.
Sisense Pricing
Similar to some other data visualization tools, Sisense doesn’t publicly disclose its pricing information.
9. Domo
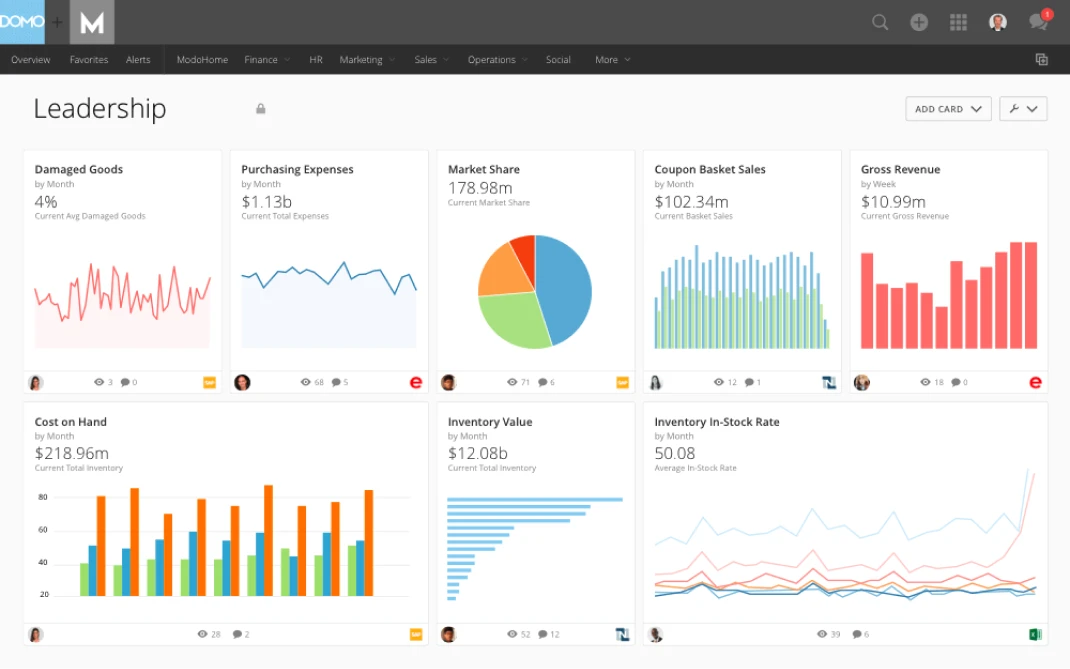
Domo is a cloud-based business intelligence platform that combines data integration, visualization, and even social collaboration features.
Domo positions itself as a user-friendly tool where even executives can build their own dashboards, while also providing IT with control over data pipelines.
Key capabilities:
- All-in-One Cloud Platform: Domo provides connectors to hundreds of data sources (cloud services, databases, spreadsheets), a cloud data warehouse to store and transform data, and a visual dashboard layer, all in one platform.
- Collaboration & Alerts: Domo has built-in chat and annotation features on dashboards, making it easy for teams to discuss insights within the platform. It also supports alerts when data hits certain thresholds, which is useful for real-time monitoring of marketing campaigns or sales metrics.
Apps and Flexibility: Users can create custom apps within Domo or use pre-built templates (for common needs like marketing spend tracking). The platform is quite extensible, supporting SQL, R, and Python for data science workflows as well. - Real-Time Dashboards: Interactive dashboards update automatically as data flows in, providing near real-time visibility into KPIs across the business. Executives and teams can monitor performance without waiting for manual refreshes.
- Collaboration Features: Domo embeds chat, annotations, and sharing within dashboards, making it easier for teams to collaborate on insights and act directly in the platform.
Domo Pricing
Domo doesn't disclose any pricing details on the website, only stating that the price depends on the usage of the platform and parameters like data storage, data refresh rates, the volume of data queries, and the number of users.
10. Yellowfin BI
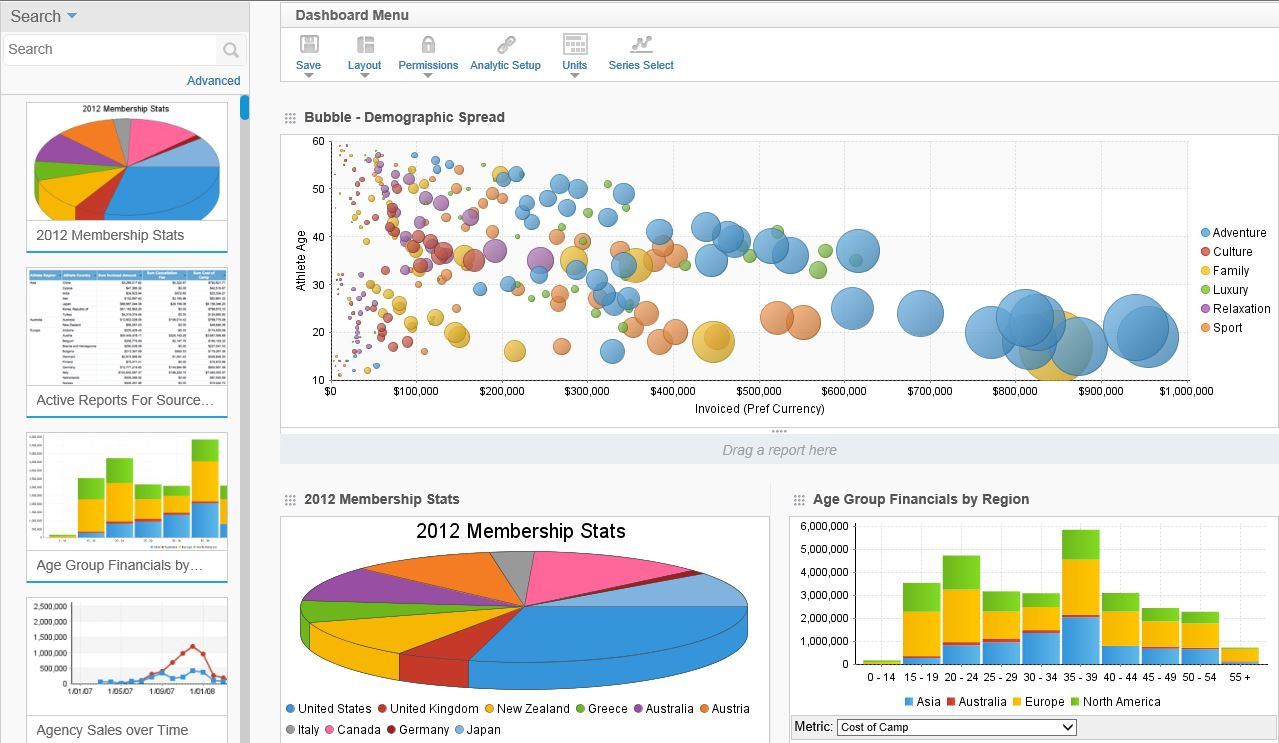
Yellowfin is a BI and dashboarding platform that differentiates itself with strong data storytelling and collaboration features. It allows users to create presentations and narratives around their charts, making analytics more consumable within organizations.
Key capabilities:
- Diverse Visualization Options: Yellowfin supports ~50 different chart types and extensive customization options, covering most needs from basic bar charts to advanced GIS maps.
Stories & Presentations: A unique feature is Yellowfin’s Storyboard, which lets you combine charts with rich text, images, and annotations – essentially crafting a data story or report that can be shared. This is great for marketing teams presenting a campaign wrap-up report, for example. - Signals & Alerts: Yellowfin has an automated insights feature (Signals) that will notify you of notable changes or outliers in your data without you having to look for them. This can surface, say, a sudden spike in web traffic or a drop in conversion rate for investigation.
- Embedded Analytics: Businesses can embed Yellowfin analytics into their own applications, portals, or customer-facing products, making insights part of existing workflows.
Yellowfin Pricing
Yellowfin provides two pricing options: Embedded analytics and Enterprise BI. For exact pricing, contact the sales team.
11. Zoho Analytics
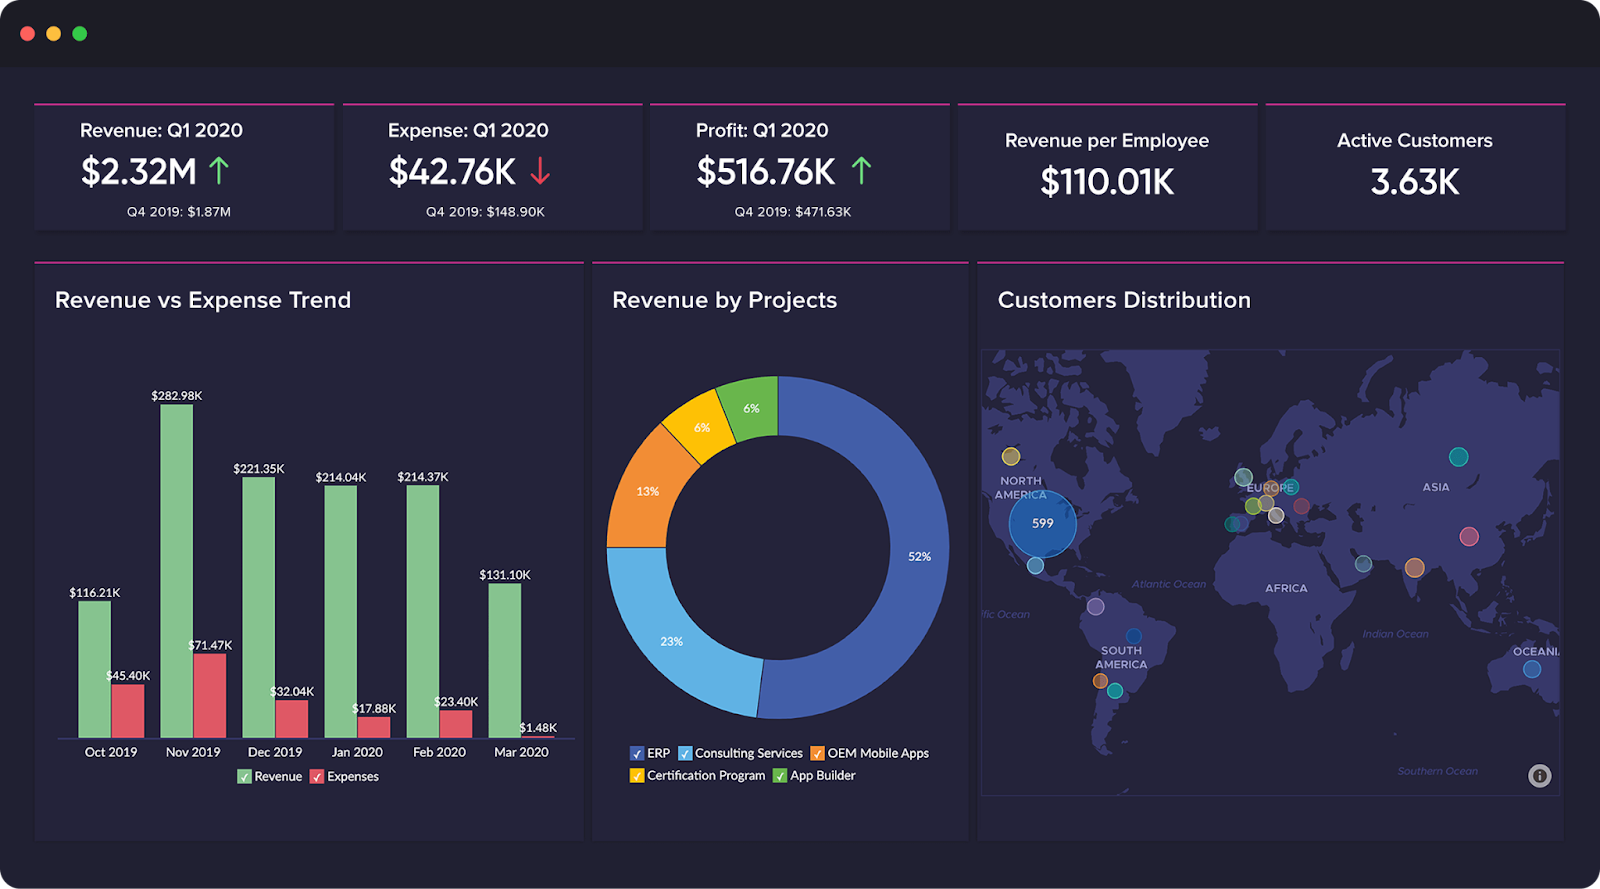
Zoho Analytics, formerly Zoho Reports, is part of the Zoho business software ecosystem. It’s a self-service BI tool that lets users create reports and dashboards, often praised for its affordability and ease of use, especially for small to mid-sized businesses.
Key capabilities:
- Ease for New Users: With a drag-and-drop interface and many pre-built connectors, non-technical users can get started quickly. Zoho Analytics also provides AI-assisted analysis through its Zia assistant, which can answer questions about your data in natural language.
- Data Blending: You can easily blend data from different sources. The tool offers an SQL query builder for advanced users, but many common transforms are doable through the UI.
- Zoho Ecosystem: If your company uses other Zoho products (CRM, Campaigns, Projects, etc.), Analytics ties in nicely, pulling data from them seamlessly. It also supports sending data to Zoho Analytics from external sources via their integration connectors or API.
- AI-Powered Assistant (Zia): Zia, Zoho’s AI assistant, enables natural language querying, automated insights, trend detection, and predictive analytics, helping business users uncover insights quickly.
Zoho Analytics Pricing
Zoho Analytics offers five pricing plans for cloud deployment, starting at $24 per month, billed annually. On-premise deployment for personal use is free. The price for professional cases depends on the destination: AWS, Docker, or Azure.
Developer & Open-Source Visualization Tools
Not all data visualization needs are met by out-of-the-box BI platforms.
For developers, data scientists, or those who need custom visualization capabilities, there are numerous libraries and open-source tools. These require some coding or technical setup, but offer maximum flexibility to create bespoke charts, interactive visuals, or integrate visualizations into applications.
12. D3.js
D3.js (Data-Driven Documents) is a JavaScript library for building custom data visualizations in web browsers. It’s open-source and extremely powerful, essentially the gold standard for low-level visualization work.
With D3, developers can bind data to DOM elements and apply data-driven transformations to generate any chart or graph imaginable.
Key capabilities:
- Ultimate Flexibility: D3 gives you fine-grained control over every aspect of a visualization. You’re not limited to pre-set chart types, you can create new types, interactive animations, or complex designs. It leverages web standards (SVG, HTML5, CSS), enabling creative freedom for unique visuals.
- Large Community & Extensions: Because it’s widely used in the data vis community, there are countless examples, plugins, and extensions for D3. Many higher-level chart libraries (like NVD3, Plotly, etc.) are built on D3’s core.
- Steep Learning Curve: Important to note that D3 is powerful but has a learning curve. It requires knowledge of JavaScript and understanding of DOM/SVG. This is a tool for developers or technically-inclined analysts.
D3.js Pricing
D3.js is a free, open-source JavaScript library. There is no cost to use D3; it is freely available for anyone to use, including for commercial projects.
13. Chart.js
Chart.js is an open-source JavaScript library that makes it easy to add simple charts to web pages. It offers a set of popular chart types (bar, line, pie, etc.) out of the box and is beloved for its simplicity and responsiveness.
Key capabilities:
- Simplicity & Ease: With just a few lines of code, you can create charts using Chart.js. It abstracts a lot of the complexity that D3 would require you to handle manually. This makes it great for beginners or for applications where you need standard charts quickly.
- Responsive Charts: Chart.js is built with HTML5 canvas and automatically renders charts that adapt to different screen sizes, making it suitable for mobile-friendly dashboards.
Customization: While it’s simpler than D3, Chart.js still offers decent customization – you can tweak colors, tooltips, legends, and even extend with plugins to add features like pattern fills or chart labels.
Chart.js Pricing
Chart.js is an open-source JavaScript charting library that is completely free to use.
14. Grafana
Grafana is an open-source platform for data visualization and monitoring, commonly used for time-series data. It’s widely adopted in the IT and DevOps world for visualizing metrics like server performance and application logs, but it can connect to many data sources and be used for business data as well.
Key capabilities:
- Time-Series Focus: Grafana excels at real-time monitoring dashboards. It connects natively with time-series databases like Prometheus, InfluxDB, Graphite, as well as SQL databases, and even cloud services. If you need to plot metrics over time (website visitors per minute, ad impressions per hour), Grafana is optimized for that.
Dashboard Templates: It provides a rich set of visualization panels (graphs, gauges, heatmaps, etc.) which you can arrange in custom dashboards. There’s also a community hub of pre-built dashboard templates for common data sources. - Alerts and Sharing: Grafana allows you to set threshold alerts on metrics (get notified if, say, conversion rate drops below X). You can also share dashboards or snapshot them publicly. It has user access control for team environments.
Grafana Pricing
Grafana offers a free tier with limited usage included.
The Pro tier costs $19 per month, which includes a set amount of host and container hours. Additional usage is billed on a pay-as-you-go basis. The Enterprise tier starts at a $25,000 annual spend commitment.
Other products, such as metrics, logs, traces, performance testing, and synthetic monitoring, have usage-based pricing, including $6.50 per 1,000 metric series, $0.50 per GB of ingested logs, and $5 or $50 per 10,000 API or browser synthetic test executions, respectively.
Overall, Grafana Cloud pricing is a mix of monthly platform/user fees plus usage-based charges depending on the services used.
15. Plotly (Plotly.js / Dash)
Plotly is both a JavaScript library (Plotly.js) for creating interactive charts and a company offering tools like Dash, a Python/R framework for building web-based analytical applications. Plotly’s open-source libraries power interactive graphs in several languages (JavaScript, Python, R, Julia).
Key capabilities:
- Rich Chart Types: Plotly supports a wide variety of charts: from basic ones to advanced types like 3D surfaces, maps, sankey diagrams, and more. Many complex visualizations that would be tough in raw D3 are simpler to implement with Plotly’s APIs.
Interactive and Publication-Quality: Charts made with Plotly are interactive by default (hover tooltips, zooming, etc.) and aesthetically pleasing. This makes them suitable for both exploratory analysis and embedding in presentations or reports. - Dash Framework: For Python or R users, Plotly’s Dash framework allows you to create full-fledged interactive dashboard applications purely in those languages (with Plotly for the visuals). This is powerful for data science teams that want to deploy interactive reports without needing front-end development.
Plotly Pricing
Plotly offers both free, open-source tools and premium, enterprise-level products, with custom pricing typically starting in the thousands of dollars annually for Dash Enterprise.
16. Highcharts
Highcharts is a commercial JavaScript charting library that offers a wide range of chart types and is known for its polished look and thorough documentation. It’s free for personal use, but requires a license for commercial use on websites or applications.
Key capabilities:
- Variety & Quality: Highcharts comes with 100+ chart types and variations, covering everything from basic line and column charts to advanced polar charts and tree maps. The visuals are high quality and customizable.
- Interactivity & Exporting: Charts are interactive (tooltips, zoom, toggling series) and also support exporting to images or PDF for reports. It handles rendering well across browsers (including older ones via SVG/VML fallback).
- Extensions: There are modules for specialized charts (Highstock for financial time-series, Highmaps for geospatial charts, Highcharts Gantt for project timelines). This ecosystem allows you to maintain a consistent approach for all visualization needs.
Highcharts Pricing
The Non-commercial license is free for personal projects, non-profits, schools, or personal websites.
For commercial use, pricing varies by license type, including Internal, SaaS, SaaS+, Perpetual, and OEM licenses.
Prices for the core Highcharts products start at approximately $397 for an Annual Internal License and range up to $1,997 for a Perpetual SaaS+ License.
17. FusionCharts
FusionCharts is another veteran commercial JavaScript charting library that provides a large collection of charts and widgets. It has been around for years and is often cited as a comprehensive toolkit for developers building dashboards.
Key capabilities:
- Comprehensive Library: FusionCharts boasts 100+ chart types and 2000+ maps out of the box. Whether it’s standard bar charts or complex gauges and heat maps, chances are FusionCharts has a ready component.
Developer-Friendly: It supports multiple programming languages and frameworks, including JavaScript, React, Angular, and others, and comes with extensive documentation and demos. Integration is straightforward – include the library and feed it data in JSON. - Themes and Branding: FusionCharts allows easy theming to match your brand’s look and feel. This is useful for companies incorporating charts into client reports or products, ensuring the visuals align with branding.
FusionCharts Pricing
FusionCharts pricing in 2025 is structured into several plans based on the number of developers and usage type. The Basic plan starts at $439 per developer per year, making it suitable for small internal apps or student projects. The Enterprise+ plan is custom-priced.
18. Chartist.js
Chartist.js is an open-source library for creating simple, responsive charts on webpages. It was created to provide a lightweight alternative to heavier charting libraries, focusing on SVG output and ease of use.
Key capabilities:
- Lightweight & Responsive: Chartist.js is only tens of kilobytes in size. It produces SVG charts that scale well on different devices, making it a good choice for mobile-friendly design.
- Simple API: The library has a straightforward API. You provide data and configuration, and Chartist renders the chart. It supports key chart types and some more, with the ability to customize via CSS and plugins.
- Framework Compatibility: Chartist plays nicely with modern front-end frameworks (there are wrappers for React, Angular, etc.). It’s also used in various projects as a dependency due to its simplicity.
Chartist.js Pricing
Chartist.js is a free, open-source JavaScript charting library.
19. Polymaps
Polymaps is a specialized open-source JavaScript library for creating interactive web maps. It was a collaboration between Stamen Design and SimpleGeo. Polymaps is geared towards visualizing geospatial data in the browser using SVG, and it can handle both image-based maps and vector tiled data.
Key capabilities:
- Tiled Maps & Overlays: Polymaps loads map tiles (from providers like OpenStreetMap, Bing, etc.) for backgrounds and can overlay data as SVG vectors. This means you can plot data points, regions, or heatmaps on top of standard maps seamlessly.
Smooth Zooming: It supports fluent zooming and panning interactions, important for a good map UX. As you zoom, it can fetch more detailed tiles or data for that zoom level. - Data Visualization: Because it leverages SVG, you can style map data (points, lines, polygons) with CSS rules. This makes it easier to create thematic maps (e.g., color regions by value, change marker sizes by magnitude) without deep diving into canvas drawing.
Polymaps Pricing
Polymaps is a free, open-source JavaScript library.
Specialized & Easy Visualization Tools
This category includes tools that are designed to be extremely user-friendly or serve specific visualization needs. They often require little to no coding and are great for quickly turning data into visuals, even for those without a technical background.
Many of these are used for things like infographics, simple charts for reports, or niche purposes.
20. Infogram
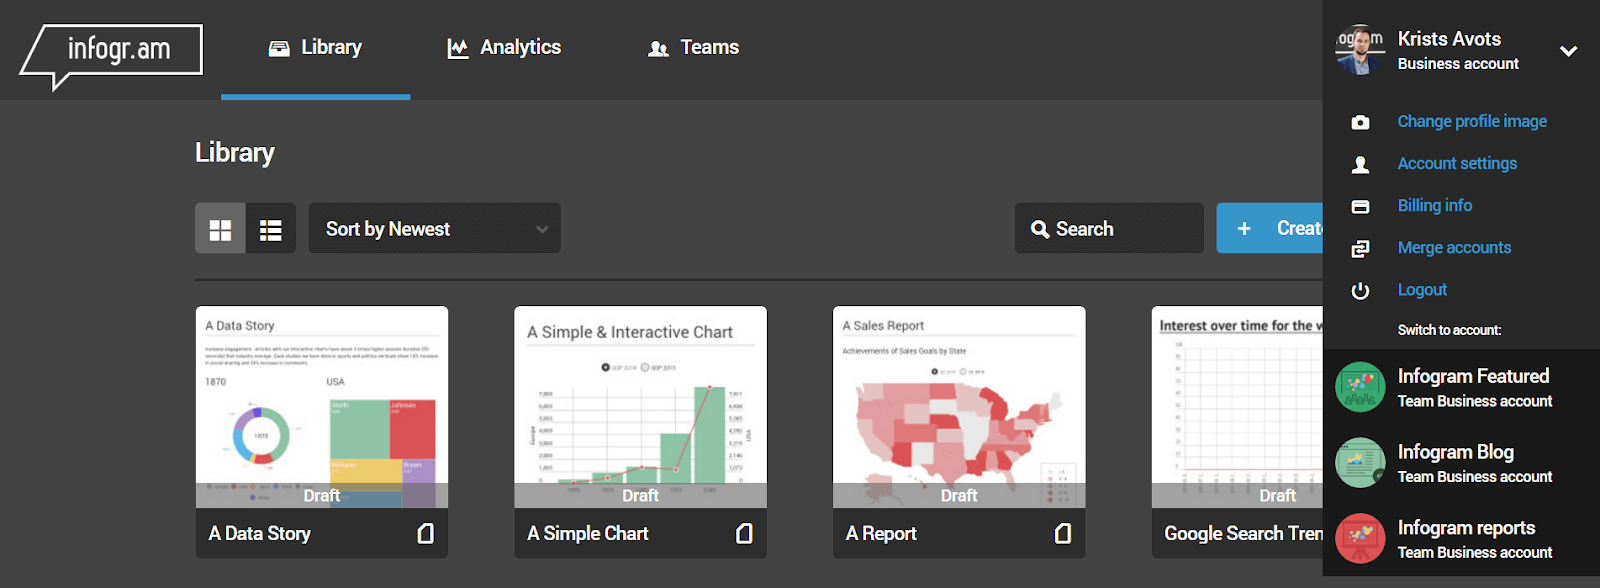
Infogram is a web-based tool for creating infographics, interactive charts, and social-media-ready visuals. It’s template-driven, meaning you can plug your data into pre-designed layouts and produce professional-looking visual content easily.
Key capabilities:
- Templates & Design: Infogram offers a vast library of templates for infographics, reports, dashboards, and more. These templates include combinations of charts, text, and media, so you can tell a data story without starting from scratch.
- No Coding Required: The interface is drag-and-drop. You can add different types of charts, maps, text blocks, images, and videos. Data for charts can be entered manually or imported from sources like CSV, Google Sheets, or cloud drives.
- Interactive & Embeddable: Charts and infographics made in Infogram can be interactive and are easily embeddable in websites or shareable via links. It also allows downloading in various formats (PNG, PDF, animated GIF, or others) for offline use.
Infogram Pricing
Infogram offers a free basic plan with limited features; paid plans start at $25 per month.
This plan provides users with access to features such as over 35 interactive chart types, 550+ maps, customizable templates, a drag-and-drop editor, data import from various sources, and the ability to publish content online.
21. Datawrapper
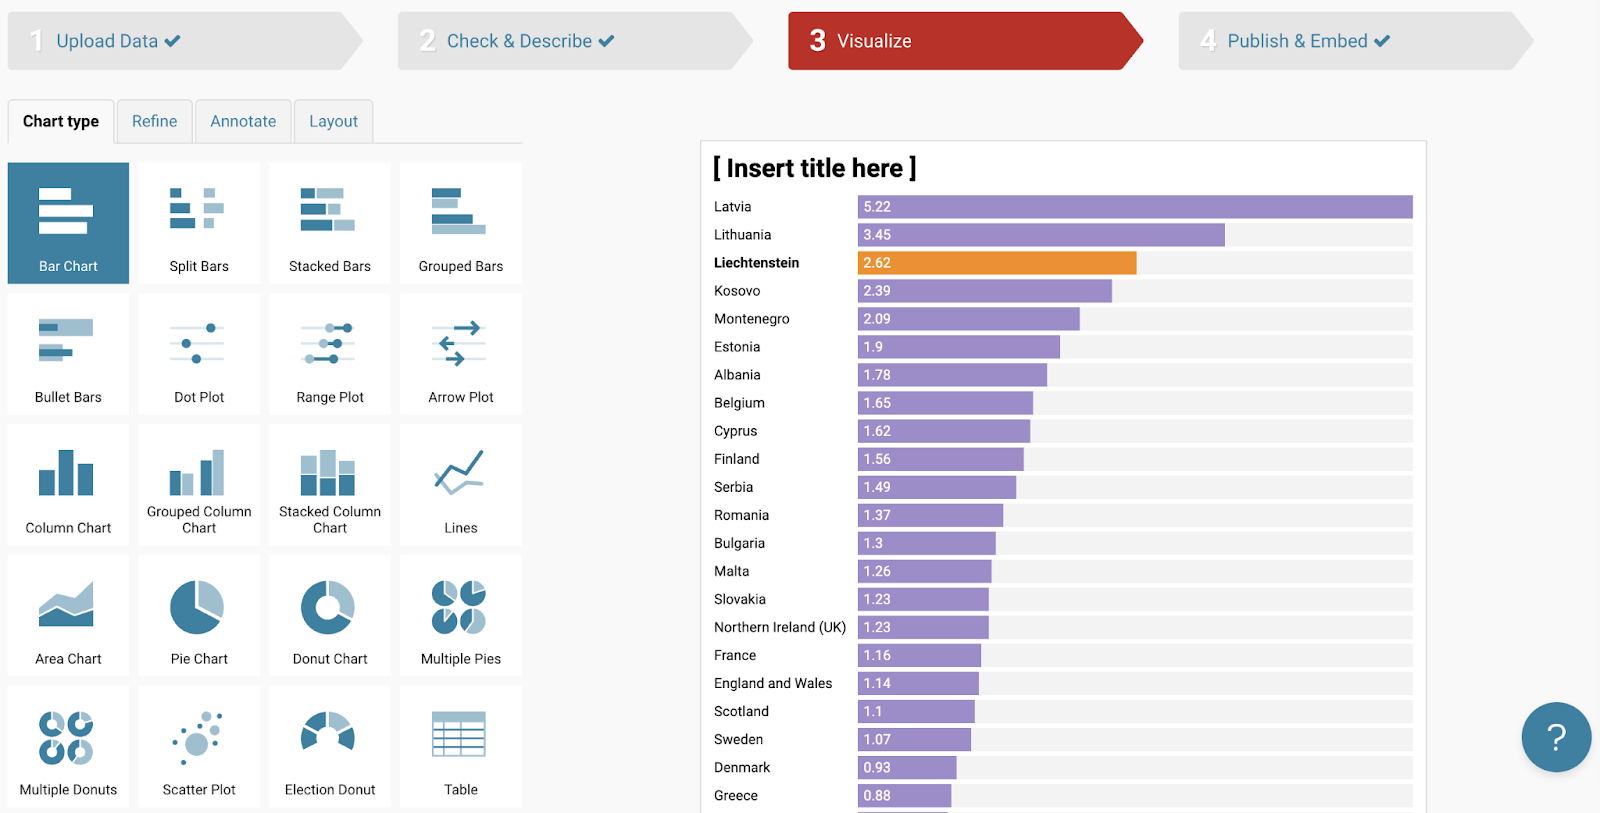
Datawrapper is an online visualization tool often used by newsrooms and publishers to create simple charts, maps, and tables for articles. It’s known for producing clean, elegant visuals that can be quickly embedded into webpages.
Key capabilities:
- Ease of Use: Datawrapper is extremely user-friendly. You upload your dataset (or copy-paste), choose a chart type (bar, line, map, etc.), and then customize the appearance. It’s designed so that even non-technical journalists can visualize data in minutes.
- Responsive Design: The charts are mobile-responsive by default, which is crucial for media sites. They also adhere to accessibility standards (e.g., colorblind-friendly palettes), which is a big plus for public-facing content.
- Maps and More: Datawrapper includes not just standard charts but also map visualization (choropleth maps, symbol maps) using built-in geography templates. This has made it a go-to for quick mapping needs – e.g., showing election results by region in a news article.
Datawrapper Pricing
Datawrapper offers a free plan with limited features. Paid plans start at $599 a month. The company also offers an enterprise plan with custom pricing that includes features such as self-hosting, on-premise installation, SSO, SLAs for support, and tailor-made options for large organizations.
22. ChartBlocks
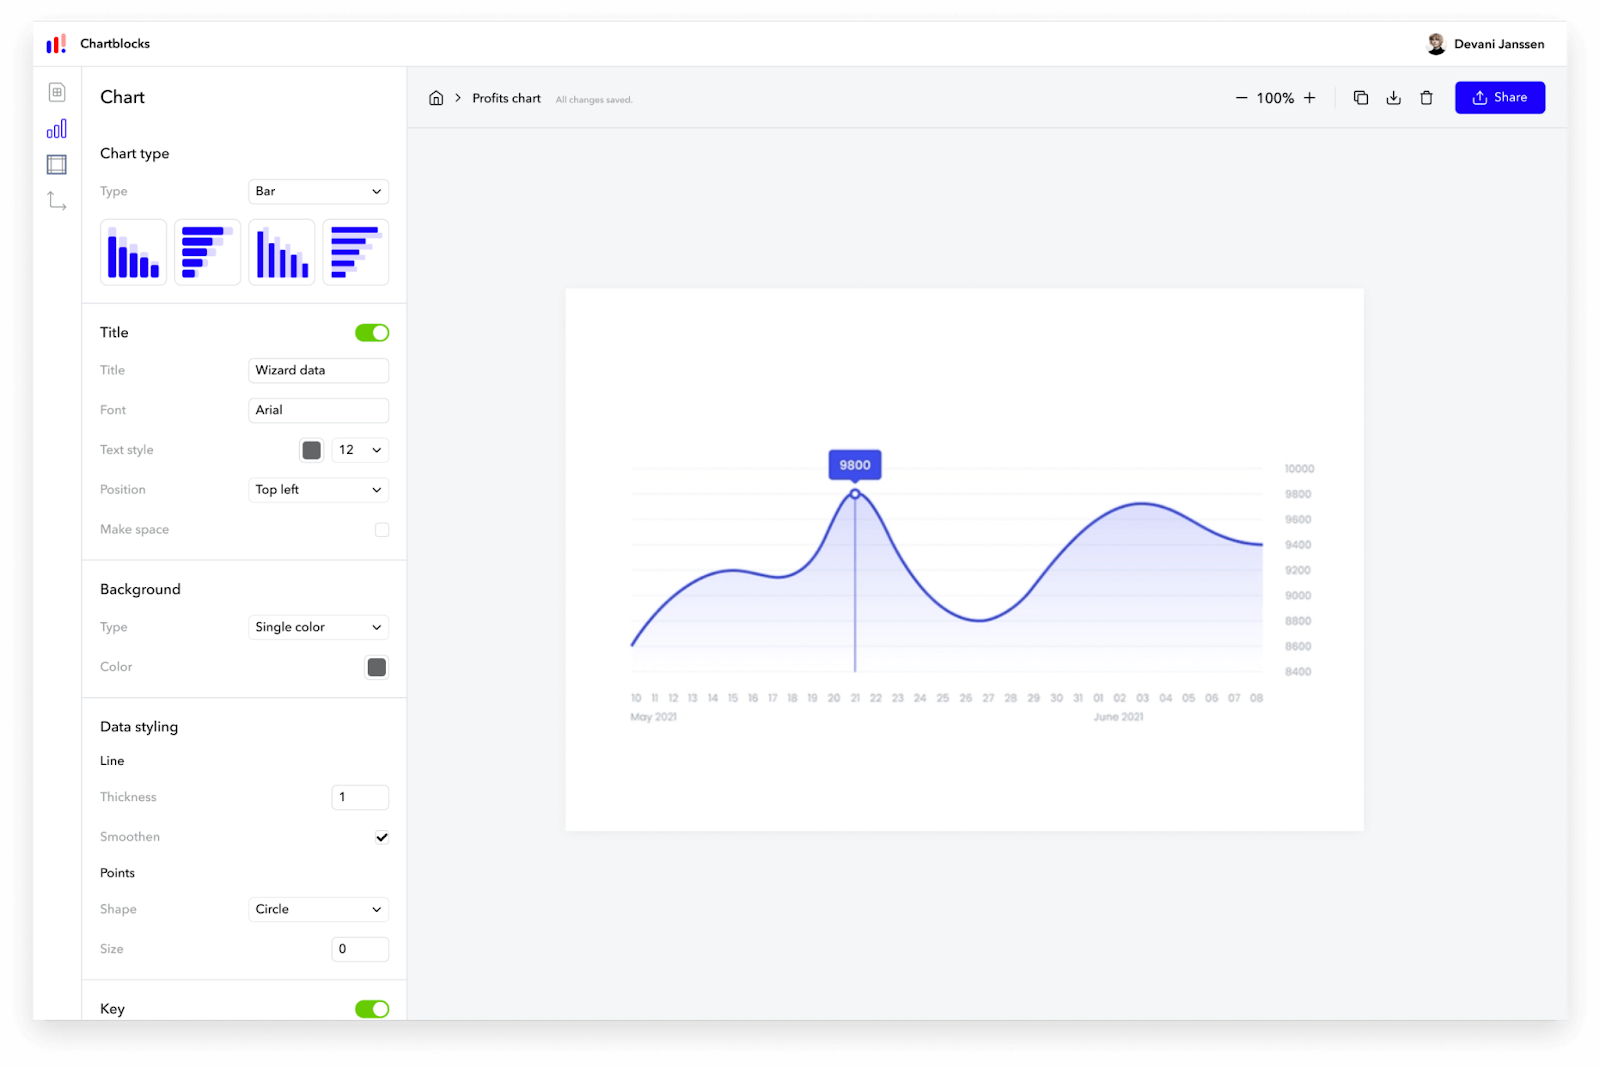
ChartBlocks is an online chart builder that lets you design charts in your browser and embed them or export them for use in documents. It prides itself on being very quick to get a chart up and running.
Key capabilities:
- Data Import: You can pull data into ChartBlocks from various sources – upload a CSV, link a spreadsheet, or even connect to certain APIs. It has a data grid interface that allows you to make minor edits or transformations to the data if needed.
- Chart Wizard: ChartBlocks guides users through chart creation with a wizard. You pick your chart type, select the data columns to use, then style the chart. It supports common types like bar, line, scatter, pie, and a few more specialized ones.
- Embedding & Exporting: After creating a chart, you can embed it using a snippet of code on any website. Charts are interactive and rendered in HTML5, so they work across devices. You can also export static images for inclusion in presentations or reports.
ChartBlocks Pricing
ChartBlocks offers multiple pricing options, including a free plan with limited functionality and monthly views.
23. RAWGraphs
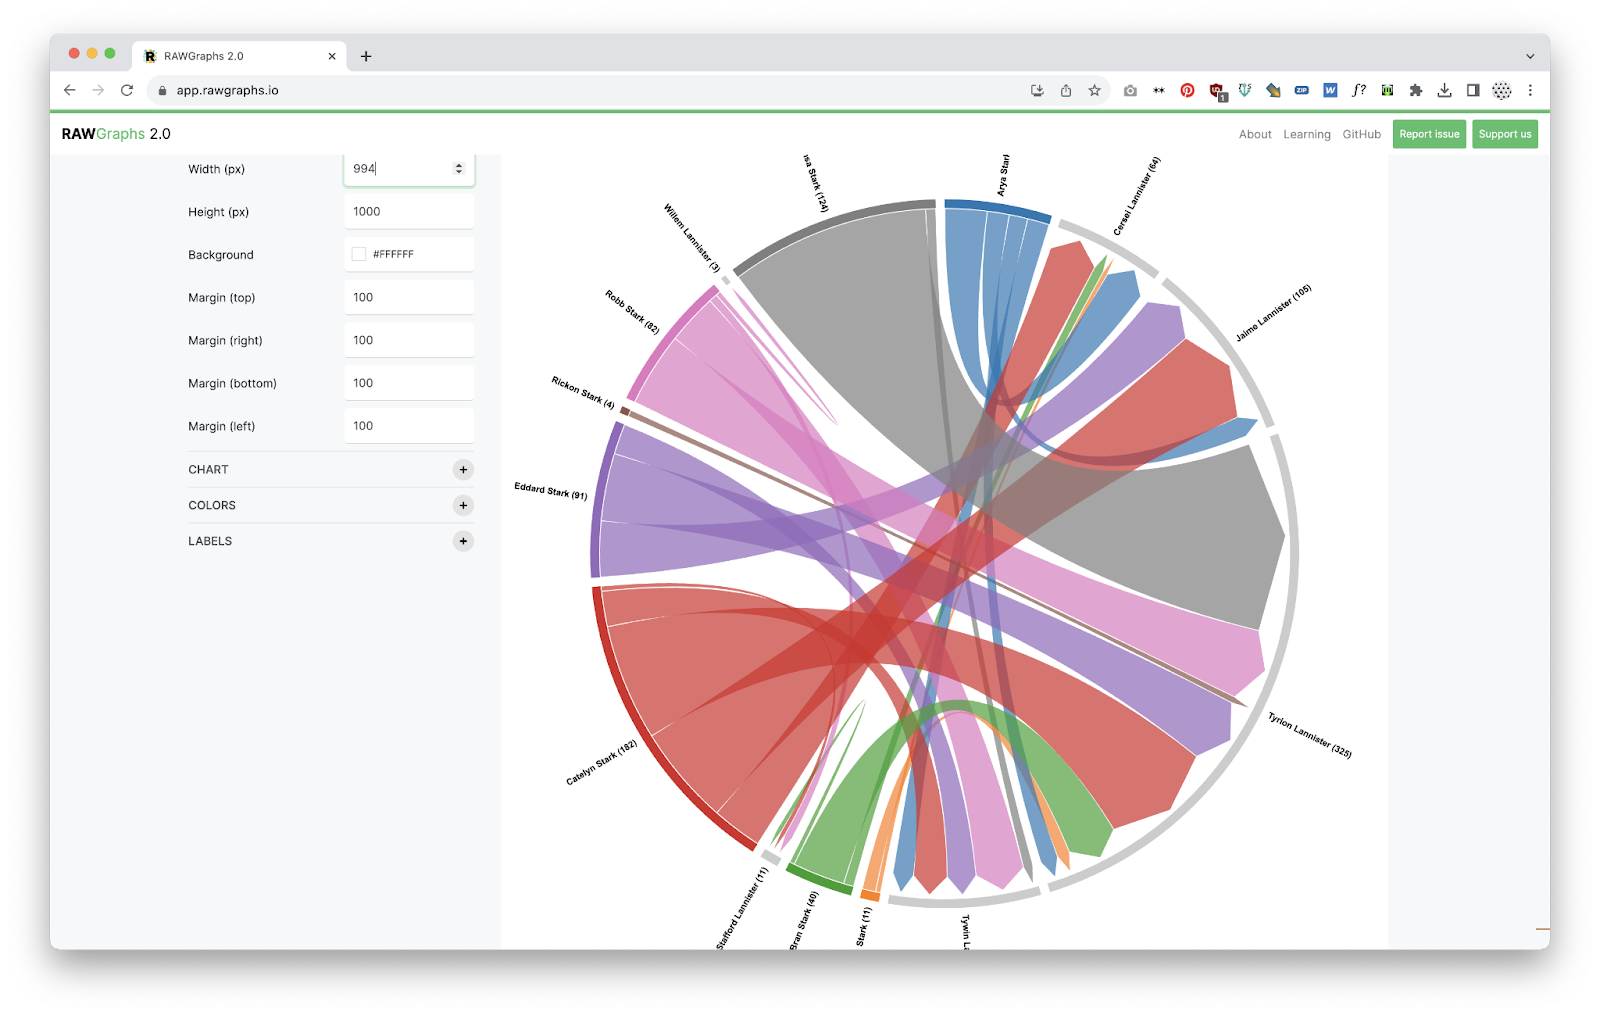
RAWGraphs is an open-source web application that helps you create unconventional or advanced visualizations from tabular data, all through a point-and-click interface. It’s often used by designers or data visualization enthusiasts to generate visuals that aren’t readily available in standard tools.
Key capabilities:
- Unique Chart Types: RAWGraphs shines in offering chart types that are “beyond the basics” – think alluvial diagrams, circular dendrograms, Voronoi tessellations, streamgraphs, etc. If your data needs a special representation, RAWGraphs likely has a template for it.
- Usage: You paste or upload data (like CSV or TSV), select one of the many chart options, then assign your data dimensions to the chart’s variables. As you adjust settings, the chart updates in real time. You can then export the result as an SVG or PNG for further editing or publishing.
- No Install Needed: It runs in the browser (and there’s an online instance on RAWGraphs.io), so no software installation is required. Designers often like to export SVG and then refine the visuals in Illustrator, RAWGraphs basically generates a starting point for complex charts.
RAWGraphs Pricing
RAWGraphs is an open-source data visualization tool that is free to use.
How to Choose the Right Data Visualization Tool
With so many options available, how do you decide which data visualization tool is best for your needs?
Here are some key considerations to guide your choice:
- Define Your Audience and Skills: Who will use the tool? If you’re a non-technical marketer or executive, you’ll want a user-friendly, no-code tool like an interactive dashboard platform — Tableau or Improvado. If you have dedicated data analysts or developers, they might leverage code-centric tools like D3.js or Python libraries for ultimate flexibility. Always match the tool to the technical skill level of your primary users.
- Consider Your Use Case: What do you need to visualize, and how will the visuals be used? For static blog infographics, a simple tool like Datawrapper or Infogram might suffice. For real-time monitoring of campaigns or operations, you’ll need a dynamic dashboard tool like Looker or Improvado.
- Data Complexity and Volume: Assess the size and complexity of your data. If you’re dealing with large, complex datasets (millions of rows, multiple sources), look for robust tools that can handle big data – enterprise BI platforms or specialized big data visualization tools. Ensure the tool can connect to your data sources with minimal friction. In many cases, you might use a data pipeline like Improvado to consolidate and prep your data first, then feed it into the visualization tool to avoid performance issues.
- Budget and Total Cost: Tools range from free (or freemium) to enterprise-priced. Determine your budget not just for licensing, but also implementation and maintenance.
- Integration and Ecosystem: Make sure the tool plays well with your existing tech stack. Does it connect to your databases or marketing platforms natively? Can it embed into your website or apps if needed? Also consider what ecosystem the vendor offers: Microsoft Power BI integrates with Excel and Azure services, which is great if you’re a Microsoft-centric shop. Improvado, as another example, can feed into any BI tool, so it might be chosen alongside a simple visualization tool to enhance its data reach. Choose a tool that fits into your workflow rather than forces you to change how you handle data.
.png)


.png)
