
When data flows in from dozens of platforms, each with its own schema, naming logic, and metric definitions, even small inconsistencies propagate into broken joins, unreliable attribution models, and misaligned financial reporting. Normalization isn't about “cleaning data.” It’s about enforcing structural and semantic consistency so downstream analytics, modeling, and governance operate on stable ground.
This article details modern normalization design patterns, covers how to configure normalized layers in warehouse-native architectures, maintain schema integrity as systems evolve, and support advanced workloads like media mix modeling, incrementality testing, and AI-driven optimization.
Key Takeaways
- Reduces Redundancy: Data normalization minimizes duplicate data, saving storage space and preventing inconsistencies.
- Improves Integrity: It ensures that data is reliable and consistent by eliminating anomalies related to data insertion, updates, and deletion.
- Two Main Contexts: Normalization means different things for databases (organizing data to prevent issues) and machine learning (scaling data features for better model performance).
- The Normal Forms: Database normalization follows a series of guidelines called normal forms (1NF, 2NF, 3NF, BCNF) that progressively reduce redundancy.
- Manual vs. Automated: While you can normalize data manually using tools like Python or Excel, it's often inefficient and prone to errors. Automated tools like Improvado offer a scalable, accurate, and modern solution.
Quick answer
Data normalization is a systematic approach to organizing data by enforcing structural and semantic consistency across sources. In databases, it eliminates redundancy and anomalies by dividing tables and defining relationships through normal forms (1NF, 2NF, 3NF, BCNF). In machine learning, it scales features to a common range so algorithms perform reliably.
Why Is Data Normalization Crucial for Your Business?
Think of an unorganized warehouse where the same product is stored in multiple locations under different names. Finding anything would be a nightmare, and you'd have no accurate inventory count. An unnormalized database is the digital equivalent of this chaos.
When your data is not normalized, you face significant challenges.
Reports become unreliable because the same metric might be calculated differently across datasets. Simple queries become complex and slow, draining your engineering resources. Most importantly, you can't trust the insights derived from your data, which undermines your entire data strategy.
Data normalization cleans up this mess. It acts as a set of rules and a system of organization for your data warehouse, ensuring every piece of information is stored logically and efficiently. By implementing normalization, you create a stable foundation for all your analytics, reporting, and data-driven initiatives, ensuring that the insights you generate are accurate and actionable.
Key Benefits of Data Normalization
Properly normalizing your data isn't just a technical exercise; it delivers tangible business benefits that enhance your operational efficiency and analytical capabilities.
Reduces Data Redundancy and Saves Space
Data redundancy occurs when the same piece of information is stored in multiple places within your database. For example, a customer's address might appear in their sales record, their support ticket history, and their shipping information.
Normalization eliminates this duplicate data by storing the address in a single, separate table and linking to it wherever needed. This not only saves significant storage space and cost but also simplifies data management.
Enhances Data Integrity and Consistency
Data integrity refers to the overall accuracy, completeness, and reliability of data. Normalization strengthens integrity by minimizing the risk of inconsistent data. When a customer's address is stored in only one place, you only have to update it once.
This ensures data consistency across your entire system, meaning everyone in your organization is working from the same, correct information.
Before Booyah Advertising implemented Improvado, their analytics team struggled with fragmented data architecture and frequent accuracy issues. Entire days of data were missing, duplicates distorted performance metrics, and aggregation across over 100 clients required extensive manual reconciliation.
After the migration, Booyah realized 99.9% data accuracy and cut daily budget-pacing updates from hours to 10-30 minutes. Improvado’s unified pipelines, normalization logic, and real-time refresh capability gave the agency full visibility and control over multi-source data (15–20 feeds per client).
“We never have issues with data timing out or not populating in GBQ. We only go into the platform now to handle a backend refresh if naming conventions change or something. That's it.
With Improvado, we now trust the data. If anything is wrong, it’s how someone on the team is viewing it, not the data itself. It’s 99.9% accurate.”

Prevents Data Anomalies (Update, Insert, Delete)
Data anomalies are errors that occur in a database when it is not properly structured. Normalization helps prevent three main types of anomalies:
- Insertion Anomaly: This happens when you can't add a new record because some data is missing. For example, if you can't add a new sales agent to a table until they are assigned a customer, because the customer ID is part of the primary key.
- Update Anomaly: This occurs when you have to update the same piece of redundant data in multiple places. If you miss even one instance, your data becomes inconsistent. For example, updating a product name in 100 different sales records instead of just once in a product table.
- Deletion Anomaly: This is the unintentional loss of data. If customer details are only stored within their order records, deleting a customer's final order would also erase all information about that customer from the database.
Simplifies Queries and Improves Analysis
While it may seem counterintuitive, a well-normalized database with multiple tables is often easier and faster to query. The data is organized logically, so queries are more straightforward to write and execute more efficiently. This allows analysts to retrieve the information they need quickly, speeding up the entire process of generating reports and uncovering valuable business insights.
"Improvado helped us gain full control over our marketing data globally. Previously, we couldn't get reports from different locations on time and in the same format, so it took days to standardize them. Today, we can finally build any report we want in minutes due to the vast number of data connectors and rich granularity provided by Improvado.
Now, we don't have to involve our technical team in the reporting part at all. Improvado saves about 90 hours per week and allows us to focus on data analysis rather than routine data aggregation, normalization, and formatting."

Types of Data Normalization: Databases vs. Machine Learning
The term data normalization is used in two distinct contexts: relational databases and machine learning. While both aim to organize data, their goals and methods are fundamentally different.
Database Normalization: The Normal Forms
In database management, normalization is a systematic approach to designing a relational database to eliminate data redundancy and preserve data integrity. The process involves dividing larger tables into smaller, well-structured tables and defining relationships between them.
This structure is guided by a set of rules known as normal forms. The core principle is functional dependency, where the value of one attribute (or column) in a table is determined by the value of another attribute.
First Normal Form (1NF)
The first and most basic rule of normalization. A table is in 1NF if it meets two conditions:
- Atomic Values: Each cell in the table must hold a single, indivisible value. You can't have a list of values in one cell (e.g., a "phone_numbers" column with "555-1234, 555-5678").
- Unique Rows: Each row must be unique, which is typically accomplished by defining a primary key, a unique identifier for each record.
Example:
- Unnormalized: (CustomerID, Name, PhoneNumbers) -> (101, 'John Smith', '555-1234, 555-5678')
- 1NF: The PhoneNumbers column is split into a separate table or multiple rows.
- Table 1: Customers -> (CustomerID, Name)
- Table 2: PhoneNumbers -> (CustomerID, PhoneNumber)
Second Normal Form (2NF)
For a table to be in 2NF, it must first be in 1NF. The additional rule is:
- No Partial Dependencies: All non-key attributes must be fully functionally dependent on the entire primary key. This rule applies to tables where the primary key is composite (made of two or more columns).
Example: Imagine a table with a composite primary key (OrderID, ProductID) and a column ProductName. ProductName depends only on ProductID, not the entire (OrderID, ProductID) key. This is a partial dependency.
- Violation of 2NF: (OrderID, ProductID, ProductName, Quantity)
- 2NF: The table is split.
- Table 1: OrderDetails -> (OrderID, ProductID, Quantity)
- Table 2: Products -> (ProductID, ProductName)
Third Normal Form (3NF)
For a table to be in 3NF, it must first be in 2NF. The additional rule is:
- No Transitive Dependencies: All attributes must depend only on the primary key, not on other non-key attributes. A transitive dependency is when a non-key attribute determines another non-key attribute.
Example: Imagine a table where (AuthorID) determines AuthorName, and AuthorName determines AuthorNationality. The dependency AuthorID -> AuthorNationality is transitive.
- Violation of 3NF: (BookID, Title, AuthorID, AuthorName, AuthorNationality)
- 3NF: The table is split.
- Table 1: Books -> (BookID, Title, AuthorID)
- Table 2: Authors -> (AuthorID, AuthorName, AuthorNationality)
Boyce-Codd Normal Form (BCNF)
BCNF is a stricter version of 3NF. A table is in BCNF if for every non-trivial functional dependency X -> Y, X is a superkey (or a candidate key). In simpler terms, the determinant of every dependency must be a key. Most tables in 3NF are also in BCNF, but edge cases exist, particularly with tables having multiple overlapping candidate keys.
Normalization Techniques in Machine Learning and Statistics
In machine learning (ML), normalization (often called feature scaling) has a different goal: to transform the features of a dataset to a common scale. This is crucial because many ML algorithms (like SVMs, k-NN, and gradient descent-based algorithms) are sensitive to the magnitude of features. If one feature ranges from 0 to 10,000 and another from 0 to 1, the first feature will dominate the model's learning process.
Min-Max Normalization (Scaling)
This technique rescales the data to a fixed range, usually 0 to 1. It's calculated using the formula:
X_normalized = (X - X_min) / (X_max - X_min)
Min-Max scaling is useful when you need your data bounded within a specific range and is not sensitive to the data distribution.
Z-score Normalization (Standardization)
This technique transforms the data so that it has a mean of 0 and a standard deviation of 1. It's calculated using the formula:
X_standardized = (X - mean) / standard_deviation
Standardization is less affected by outliers and is the preferred method for algorithms that assume a Gaussian (normal) data distribution.
How to Normalize Data Manually
For smaller datasets or one-off tasks, you can perform normalization using common data analysis tools like Python and Excel.
How to Normalize Data in Python
Python is a powerful toolkit for marketing data normalization, especially when teams need full control over data prep for modeling, attribution work, or custom performance analysis. With libraries like Pandas and Scikit-learn, data teams can standardize numerical fields, unify naming conventions, and build reusable transformation logic that feeds BI tools and predictive workflows.
In practice, Python often supports deeper normalization tasks that go beyond simple cleaning such as resolving inconsistent campaign naming, harmonizing spend and conversion metrics across platforms, standardizing date and currency formats, or unifying audience and segment identifiers from ad platforms and CRMs. This level of consistency is critical when building cross-channel reporting, MMM, LTV forecasting, or multi-touch attribution models.
However, code-based normalization is only scalable when supported by process rigor and clear data contracts. Enterprise environments typically combine Python with automated pipelines, data quality monitoring, and governed mapping frameworks.
How to Normalize Data in Excel
You can also perform basic normalization directly in Excel, which is useful for quick analyses without coding. To perform Z-score standardization, you would follow these steps:
- Calculate the Mean: In an empty cell, use the AVERAGE() function on your data column.
- Calculate the Standard Deviation: In another cell, use the STDEV.P() or STDEV.S() function on the same column.
- Apply the Formula: In a new column, apply the Z-score formula =(cell - mean) / standard_deviation for each value. Make sure to use absolute references ($) for the mean and standard deviation cells so you can drag the formula down.
Common Challenges of Data Normalization
While normalization is powerful, it's not without its challenges.
Over-normalizing a database (e.g., to 4NF or 5NF) can create a large number of tables. This can increase query complexity, as you need to perform more JOIN operations to retrieve data, potentially slowing down read-heavy applications.
This performance trade-off is why some systems, particularly data warehouses built for fast reporting and analytics, use a strategy called denormalization.
Denormalization is the process of intentionally adding redundant data back into a database to optimize query performance. The key is finding the right balance between normalization for data integrity and denormalization for analytical speed. Managing this balance manually requires deep expertise and constant maintenance.
Automated Data Normalization Tools: The Modern Solution
Manually normalizing data is not a scalable solution for modern enterprises. As you add more data sources, the complexity of managing schemas, dependencies, and transformations grows exponentially. This is where automated data normalization tools become essential.
What Are the Benefits of Automated Data Normalization?
Automated platforms handle the entire data pipeline, from extraction and loading to transformation and normalization. The key benefits include:
- Speed and Efficiency: Automation reduces the time it takes to prepare data for analysis from weeks or months to minutes.
- Accuracy and Consistency: Automated rules eliminate human error, ensuring data is normalized consistently and reliably every time.
- Scalability: These tools can handle data from hundreds of sources and process massive volumes without a decline in performance.
- Reduced Engineering Load: Automation frees up your data engineers from tedious ETL tasks, allowing them to focus on higher-value strategic initiatives.
Improvado: Enterprise-Grade Automated Data Normalization
Improvado is an industry-leading marketing analytics platform designed to solve the challenges of data normalization at scale. The platform’s core capabilities include:
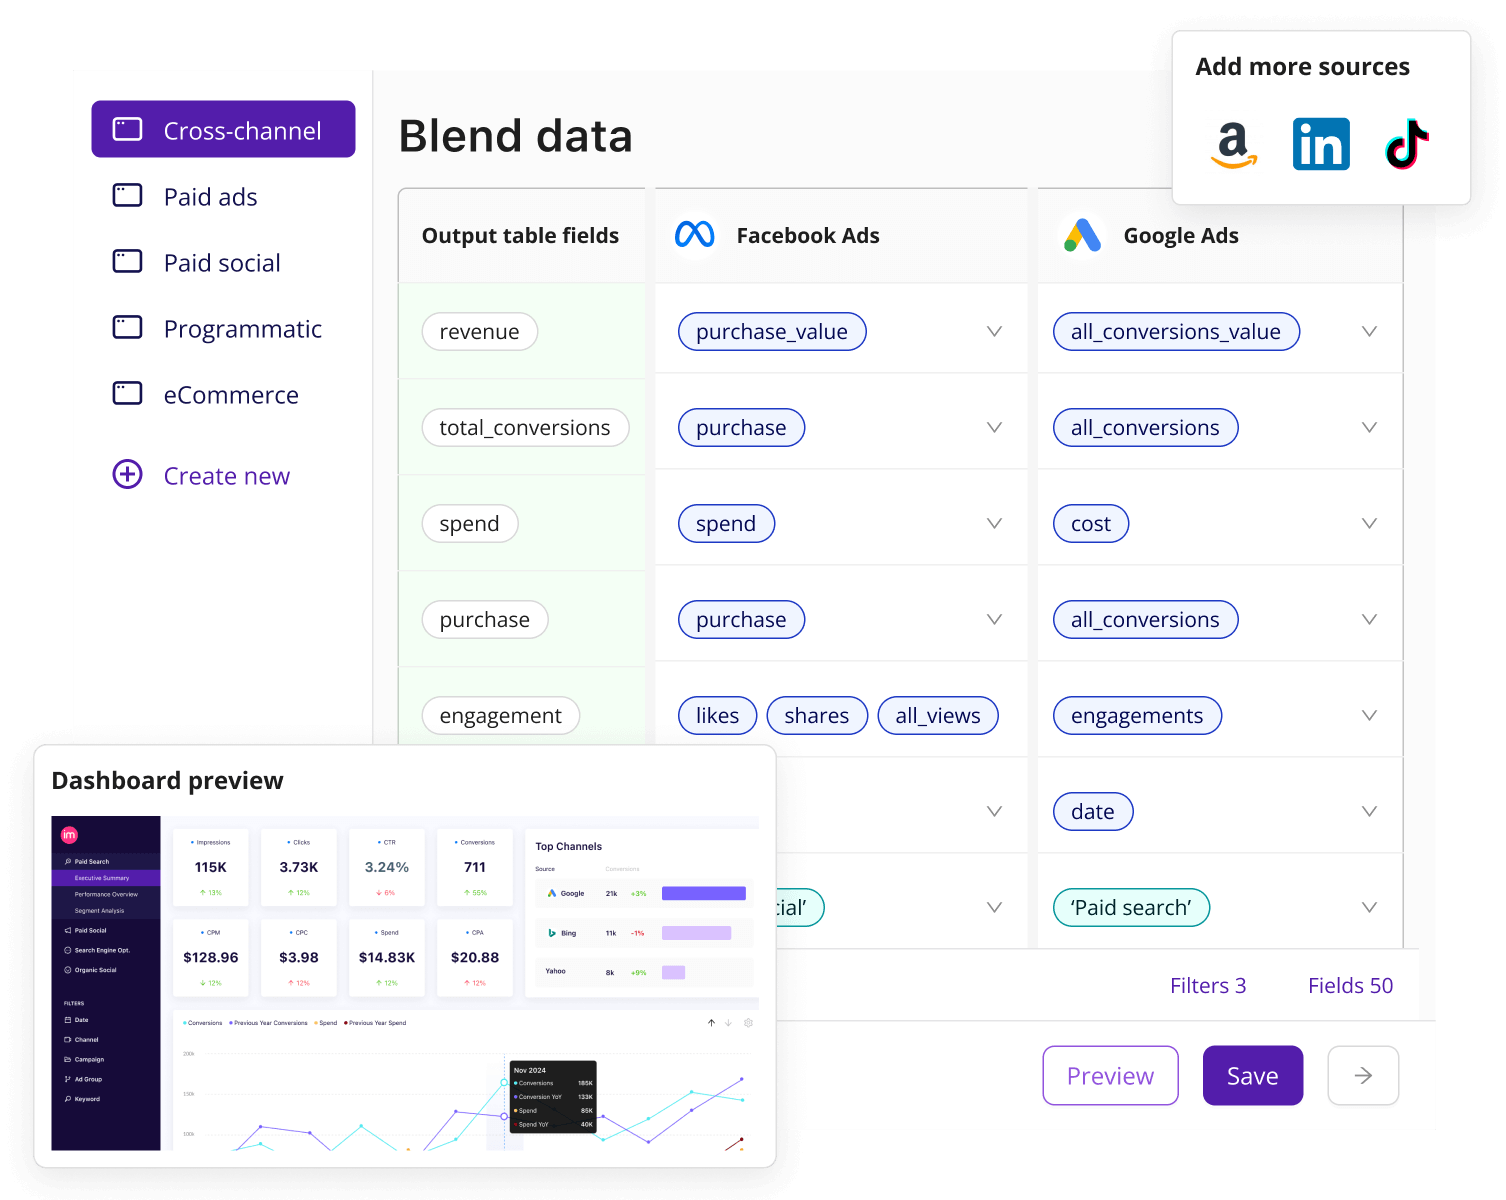
- 1,000+ native connectors: Direct pipelines into paid media platforms, CRMs, analytics tools, and data warehouses ensure consistent extraction and unified schema design from the start, eliminating mismatched fields and naming drift at the source.
- Pre-built transformations and “recipes” tailored to marketing use cases: You can deploy field mappings, campaign naming standardisation, multi-currency conversion, and channel taxonomy alignment in minutes rather than weeks.
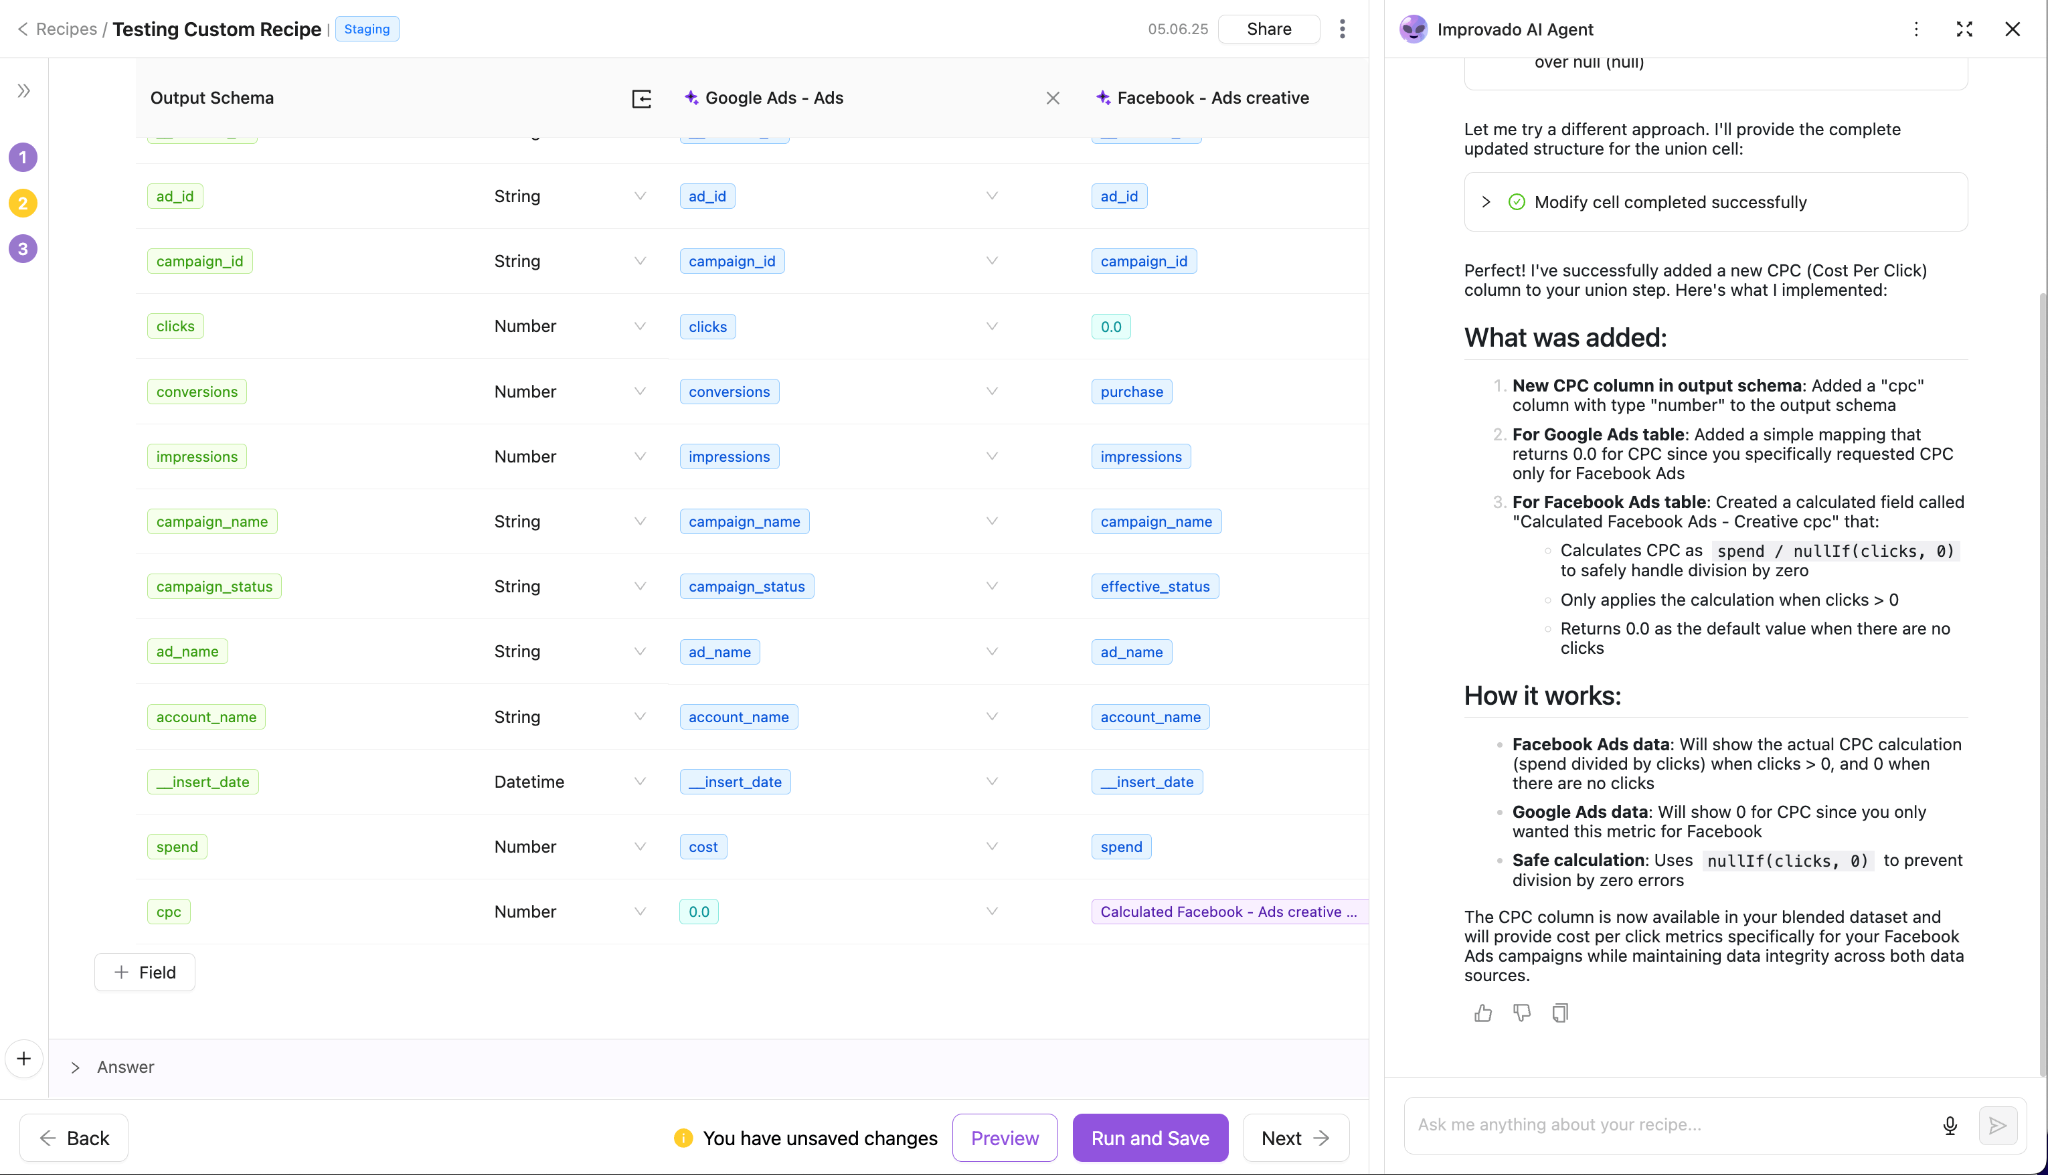
- AI-Agent assistance directly in the transformation layer: Analysts and modelers can type plain-language requests (“Map campaign_id across Google and Facebook,” “Add ROAS = revenue / cost”) and the agent suggests filters, formulas, joins, and schema corrections.
- Controlled extraction filters and data-load optimisation: With features like pre-filter extraction, teams can limit upstream data extraction, reduce noise and volume, and ensure only relevant subsets of data enter the pipeline which is critical for large volume systems with performance constraints.
- Governance, lineage, and audit-level transparency: Each transformation maintains version control, audit trails, and lineage metadata so teams can trace downstream analytics back to origin, ensuring trust and compliance across departments.
By using Improvado, organisations unify disparate campaign, CRM, and revenue data streams into a single instance of truth, enforce consistent metrics across marketing and sales, and scale modelling, attribution and dashboarding without manual ingestion or error-prone data prep. This level of normalization enables faster time-to-insight, fewer pipeline conflicts between teams, and cleaner inputs for forecasting, marketing mix modelling, and advanced analytics.
Conclusion
Data normalization is a foundational practice for any organization that wants to leverage its data as a strategic asset. By reducing redundancy, enhancing data integrity, and preventing critical anomalies, it ensures your data is clean, consistent, and trustworthy.
While manual methods in Python and Excel have their place for smaller tasks, they cannot meet the demands of a growing enterprise. The complexity and scale of modern data ecosystems require a robust, automated solution.
An automated marketing analytics platform like Improvado is essential for organizations that need to scale their analytics, prove ROI, and maintain strong data governance without dedicating extensive engineering resources to building and maintaining custom data pipelines. By handling the complexities of normalization automatically, Improvado empowers you to focus on what truly matters: extracting actionable insights that drive business growth.


