Data beats emotions. However, data also causes emotions. Especially negative emotions if your data doesn't provide any actionable insights on the subject.
Data mapping and its improper implementation are the most significant reasons behind meaningless insights.
The lack of unified metrics and naming conventions across different data sources makes it hard for analysts to see a holistic picture of business activities and make data-driven decisions. Without standardized insights and numerous data discrepancies all the time spent on data aggregation may be wasted in vain.
This problem most strongly manifests itself in digital advertising, where different marketing tools have different names for the same metric. Eventually, companies can't find an application to their data. A recent study by Inc found that up to 73% of company data goes unused for analytics.
In this post, you'll learn what data mapping is, how it solves data analytics issues, and what data mapping tools help non-technical analysts gain crystal clear insights.
What is data mapping?
💡Data mapping is a process of matching fields from different datasets into a schema. The data mapping process identifies the target (for example, data warehouse table) data element for each source element (for example, transactional system). 💡
Data mapping is the first step for a variety of different tasks, such as:
- Data migration
- Data transformation
- Data ingestion
- Merging of multiple datasets or databases into a single database
While moving information from one source to another, data specialists have to ensure that the meaning of information remains the same and appropriate for the final destination.
In other words, data mapping helps databases talk to each other. Let's consider the example of marketing metrics.
Marketers often need to gather information from Google Analytics and Google Search Console in one place. These tools keep information about new users coming from Google in their own database.
If you just merge data from both sources, you'll have to count the same visitor twice. That's why you need to create a data map that connects Google sessions in Google Analytics and clicks from Google Search Console.
In this way, you can avoid duplications and fill your new database with precise data.
How to do data mapping?
To understand how data mapping works, we first have to figure out what data models are.
A data model is an abstract model that describes data elements are arranged and how they relate to each other and other entities.
Here are some of the most common data models:
- Flat model
- Hierarchical model
- Network model
- Relational model
- Object-relational model
Since there's no unified way to organize data in different models, data fields in two separate datasets might have distinct structures.
But why do we need to know the way data is arranged in databases and how different datasets relate to each other?
Imagine that your company used a particular CRM system for a long time, but now it can't cope with your needs, and the company migrates to another solution.
Likely, your new system won't have the same data format as your old one. The new system might contain new data fields, naming conventions, and fields order.
While the previous solution stored data in the following format:
- Client_First_Name, Client_Last_Name, Client_Email, Client_Cell_Phone, Client_Company, Client_Work_Address, Client_Birhdate
And your new solution might have the following data formatting:
- Last Name, First Name, Company, Work Address, Cell Phone, Birthdate, Email
As you can see, these solutions have different data structures and naming conventions. In this case, copypasting information would do no good.
That's where data mapping comes to help. With the help of a data map, you can create a set of rules which will make the data migration smooth and successful.
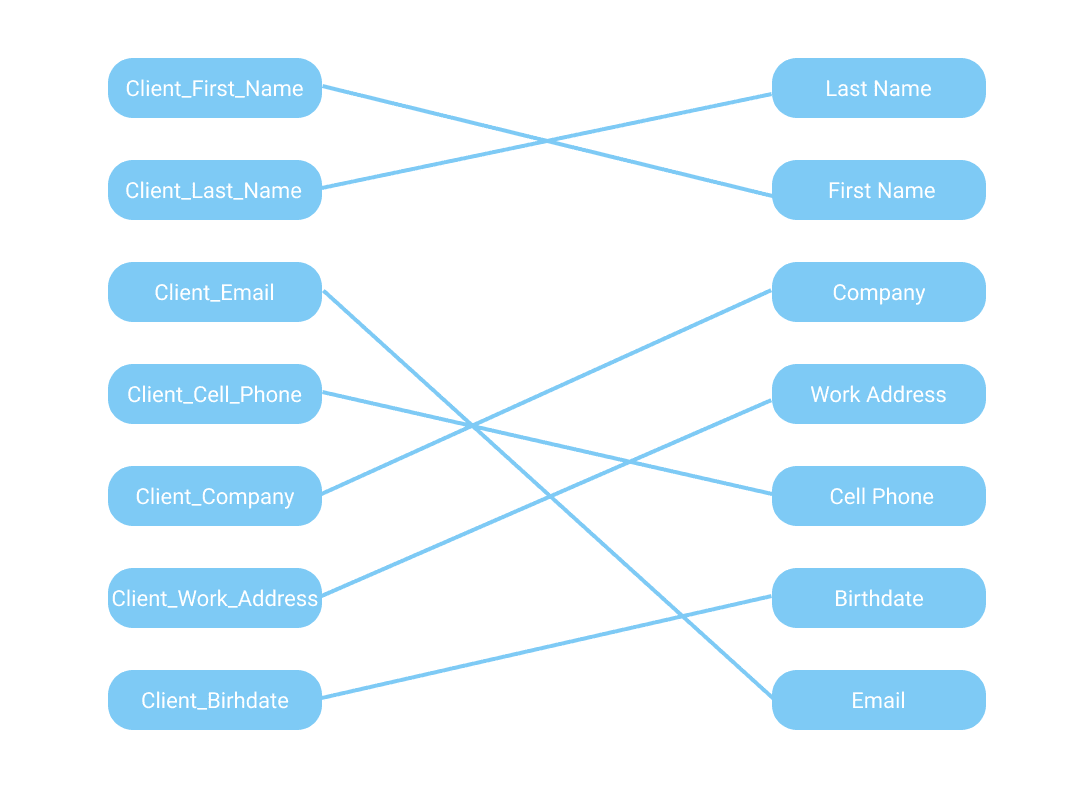
These rules govern the data migration workflow in the following way:
- Take the data from the first field of the old CRM's database and put it into the second field of the new CRM's database.
- Take the data from the second field of the old CRM's database and put it into the first field of the new CRM's database.
- And so on
Of course, these rules should also consider variables' data types, the size of the data field, data fields' names, and other details. But this example gives a high-level understanding of how data mapping works in human terms.
Data mapping advantages
The major advantage of data mapping is obvious: analysts get well-structured, analysis-ready data in the desired destination by mapping out your data.
But what it gives you on a grander scale, and how it benefits your business? Let's find out.
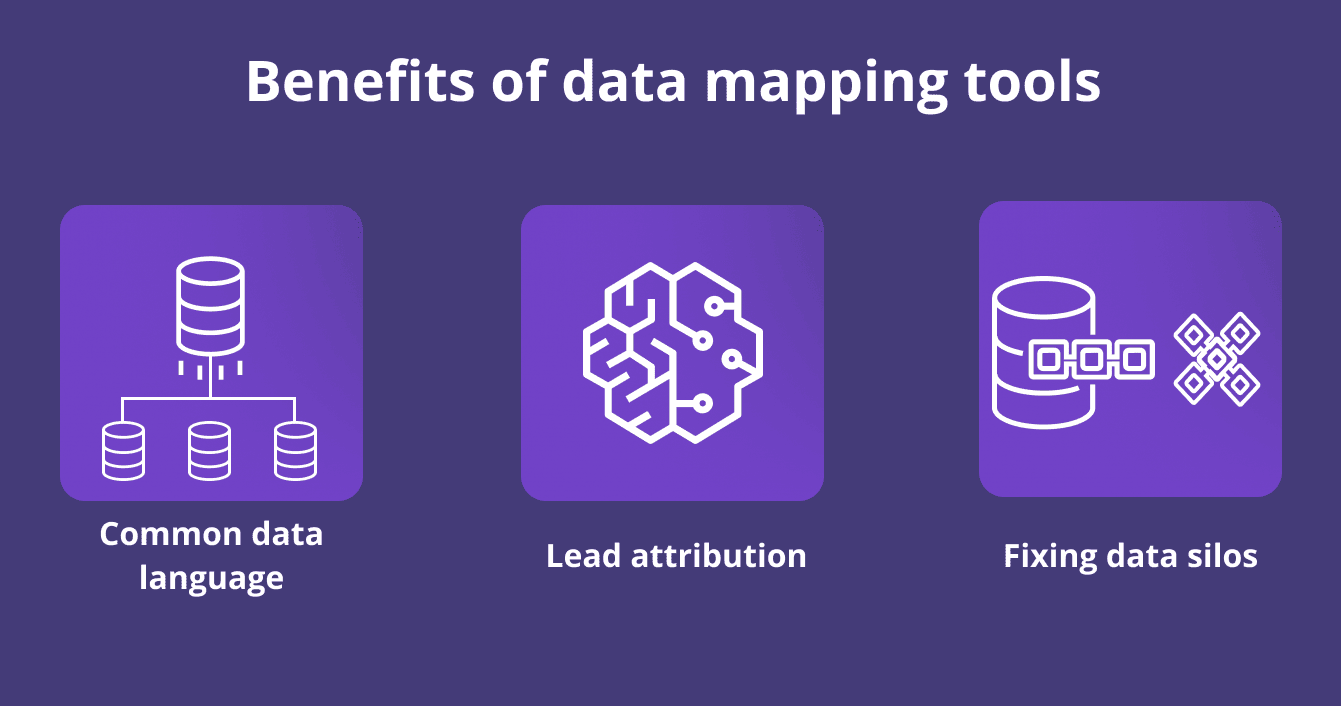
Common data language
With data mapping, businesses achieve a granular of their performance.
Let's take marketing platforms as an example. Every marketing platform has its own naming conventions for the same metric. Hence, every platform calls the same metric in different ways.
Impressions, views, imps, imp are different names for the same metrics used by different tools.
Analysts can unify metrics from various sources to aggregate them in a single marketing report with data mapping.
That's how marketers can get a holistic view of the campaign performance and make the right decisions faster.
This use case also applies to sales teams, recruitment teams, and other departments that use many data sources in their day-to-day work.
Recommendation systems
Data mapping is one of the key components behind behavioral retargeting.
Businesses such as Amazon extract valuable insights from users' browsing habits, purchase history, time spent on a page, viewing history, and other data.
Then, data specialists connect these insights with other stats such as demographic information or users' purchase power.
By combining data from these sources, Amazon can target users with certain products and personalize shopping experiences based on a number of factors (e.g., challenges customers may be facing, their location, age, interests, education, occupation, and many more).
However, to get the real value out of plain information, data experts must invest considerable efforts in data mapping because of data heterogeneity.
Lead attribution
Companies can track where their prospects come from and what marketing channels are the most effective by making your insights talk to each other.
With data mapping, marketers align metrics from different sources and merge them together.
With data from analytics platforms such as Google Analytics or Mixpanel and data from CRM systems such as Hubspot or Shopify advertisers identify which data should be credited for each conversion.
This data-driven attribution model gives a more accurate view of marketing performance and allows for better allocation of advertising budget.
Addressing data silos
Data mapping is an integral part of removing data silos across the organization.
A data silo is a collection of information kept by one department that isn't fully accessible by other departments in the same company.
In the age of data-driven organizations, siloed data becomes a great challenge on the way to rapid growth and analytics maturity.
Data silos increase data redundancy and inconsistency, hamper collaboration between teams, slow down the decision-making process, and eventually lead to overall data chaos.
Here's what Patrick Lencioni, the author of Silos, Politics and Turf Wars: A Leadership Fable About Destroying the Barriers That Turn Colleagues Into Competitors says about siloed organizations:
"Silos are nothing more than the barriers that exist between departments within an organization, causing people who are supposed to be on the same team to work against one another. And whether we call this phenomenon departmental politics, divisional rivalry, or turf warfare, it is one of the most frustrating aspects of life in any sizable organization.
Now, sometimes silos do indeed come about because leaders at the top of an organization have interpersonal problems with one another. But my experience suggests that this is often not the case. In most situations, silos rise up not because of what executives are doing purposefully but rather because of what they are failing to do: provide themselves and their employees with a compelling context for working together.
This notion of context is critical. Without it, employees at all levels—especially executives—easily get lost, moving in different directions, often at cross-purposes."
It's totally true. Without global visibility into the company's operations, employees' level of productivity goes down and it becomes harder to keep up with other departments.
🚀These 15 data integration tools can remove data silos in your organization🚀
To avoid data silos, businesses must build a strong foundation based on a data mapping strategy that specialists can implement using the right approach and data mapping tools.
Data mapping challenges
Despite all the benefits data mapping brings to businesses, it's not without its own set of challenges.
Mapping data fields
Mapping data fields accurately is essential for getting the desired results from your data migration project. However, this can be difficult if the source and destination fields have different names or different formats (e.g., text, numbers, dates).
Besides, in the case of manual data mapping, it can be exhausting to map hundreds of different data fields. Over time, employees may become prone to mistakes which will eventually lead to data discrepancies and confusing data.
Automated data mapping tools address this issue by introducing automated workflow to this process.
Technical expertise
Another obstacle is that data mapping requires the knowledge of SQL, Python, R, or any other programming language.
Sales or marketing specialists use dozens of different data sources which should be mapped to uncover useful insights. Unfortunately, just a small part of these employees know how to use programming languages.
In most cases, they have to involve the tech team in the process. However, the tech team has its own tasks and may not respond to the request this instant. Eventually, a simple connection between two data sources might take a long time or even turn into an everlasting chain of tasks in developers’ backlog.
A narrowly-focused data mapping solution could help non-technical teams with their data integration needs. A drag and drop functionality makes it easy to match data fields even without knowledge of any programming language.
Automated tools make the task even easier by shouldering all data mapping tasks. With code-free data mapping, analysts can get actionable insights in no time.
Data cleansing and harmonization
Raw data is by no means useful for a data integration process. First of all, data professionals have to cleanse the initial dataset from duplicates, empty fields, and other types of irrelevant data.
That's a lengthy and quite a routine process if done manually. According to the Forbes survey, data scientists spend 80% of their time on data collection, cleansing, and organization.
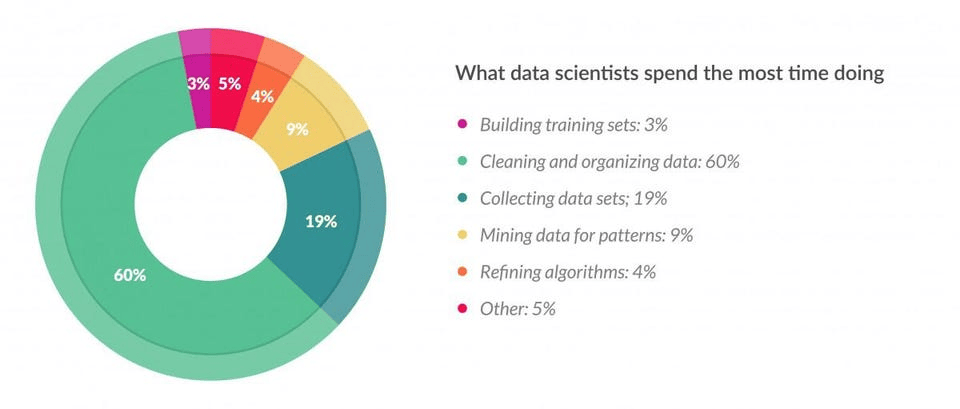
There's no escape from this task. Data integration and data migration processes that revolve around unnormalized data will take you nowhere.
Guy Pearce, Chief Data Officer and Chief Digital Officer at Convergence.tech, says the following about data mapping in one of his answers on Quora:
"Better deliverables tend to also include a profile of all the source data elements and the (governed) actions taken to manage outliers, as well as building and storing the metadata to support the mapping. This is to accommodate differences in validation rules between systems.
More interestingly, five questions always emerge:
- What do you do with the data that doesn’t map anywhere (ignore?)?
- How do you get data that doesn’t exist that is required for the mapping (gaps)?
- How do you ensure the accuracy of the semantic mapping between data fields?
- What do you do with nulls?
- What do you do with empty fields?
The single greatest lesson in all this? Make sure data is clean before you migrate, and make sure processes are harmonized!"
He couldn't be more right!
There's only one rock-solid way to automate data cleansing and normalization.
ETL systems can extract data from disparate sources, normalize it, and store it in a centralized data warehouse. Automated data pipelines take the workload off analysts and data specialists, allowing them to focus on their primary tasks.
🚀Learn more about ETL and how it can strengthen your data infrastructure🚀
Let's take a look at Improvado, for example. This ETL platform merges data from 500+ marketing, sales, and CSM data sources to help businesses build a holistic picture of their revenue operations performance.
Improvado turns raw data into analysis-ready insights and helps revenue teams make data-driven decisions faster. It offers various features, including automated data mapping, lead attribution, data transformation, and many more.
ETL systems are an integral part of efficient data infrastructure when working with heterogeneous sources. They can save hundreds of hours of manual work a week and replace tens of redundant data tools and duct tape data systems.
Handling errors
Errors during data mapping can cause significant problems down the line in terms of data accuracy and data integrity.
Any data mapping process is prone to errors. Sometimes it's a typo, other times data fields don't match, or the data format changes.
In order to avoid data-related catastrophes, it's crucial to have a plan for handling errors.
One way is to have an automated quality assurance system in place. It will monitor data mapping processes and correct any errors as they occur. However, in this way, analysts only receive more manual work because they will still have to go and fix errors manually.
Another way is to use automated data mapping tools. A set of predefined rules for each particular data source guarantees that you'll get the right relationships between data without additional data operations.
Key takeaways:
- Manual data mapping of large datasets takes too much time and is prone to mistakes. Automated data mapping addresses this issue.
- Non-technical employees who work with data, might need to learn how to map it. This task becomes more difficult without programming skills. Automated data mapping tools facilitate the process.
- Before the actual data mapping process, this data should be cleansed and normalized. However, data preparation takes too much data scientists’ time. A well-designed ETL tool can automate the process and free up to 30% of analysts’ time.
- Take care of mistakes. Manual or automated quality assurance is required to avoid misleading data.
How to choose a data mapping tool?
When it comes to data mapping, one size doesn't fit all. You need to find a data mapping tool that is tailored to your business needs and data sources.
Still, there are certain features that you should look for in any data mapping tool. Let's review all of them.
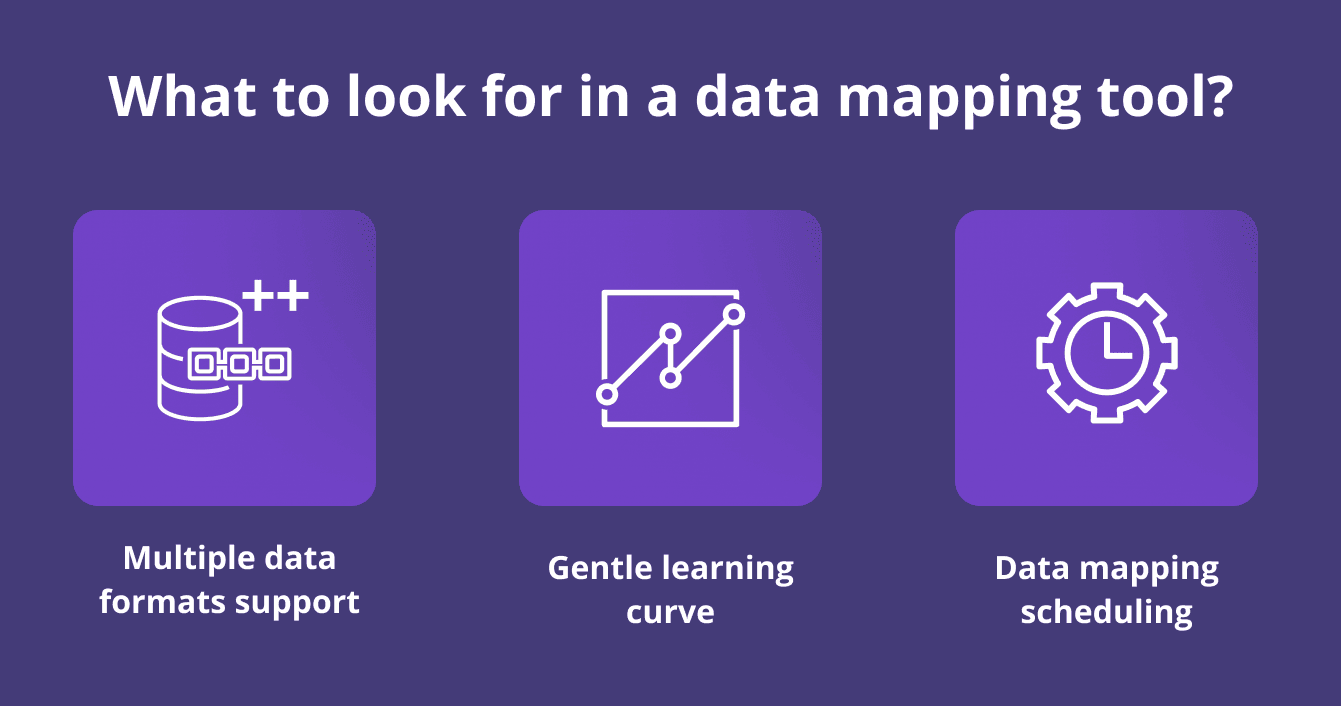
Support for multiple data formats
Most data mapping tools support commonly used formats such as XLSX, XML, CSV, JSON, and more.
However, if you're working with more proficient environments such as SQL Server, Oracle, IBM DB2, or any others, you should choose a tool that supports all formats used in your environment.
Besides, you might need a tool that supports enterprise software such as SAP HANA, Marketo, HubSpot, and other tools.
It's important to think about supported data formats beforehand so you don't have to add a new layer of data transformation when you suddenly need to export data from an uncommon source.
Learning curve and customer support
Even though automated data mapping solutions are easy to use, data analysts and data scientists will require some time to get used to them.
Hence, aim for tools that share educational materials on how their platform works, what exactly their features do, and how users can make the most out of them.
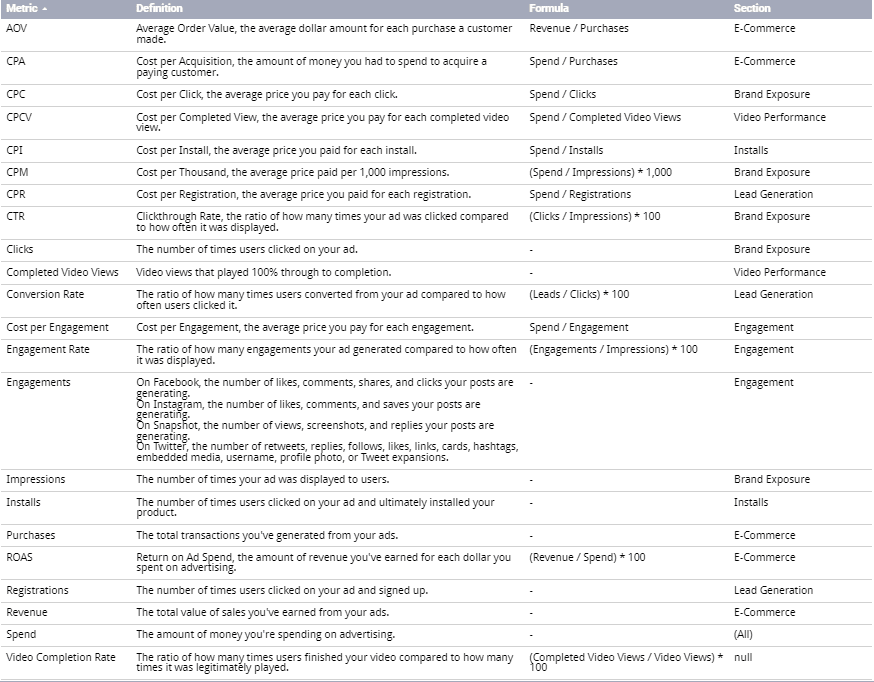
For example, Improvado's MCDM data mapping framework comes with a metric glossary. It provides more transparency into what exact metrics they are following and how they are calculated.
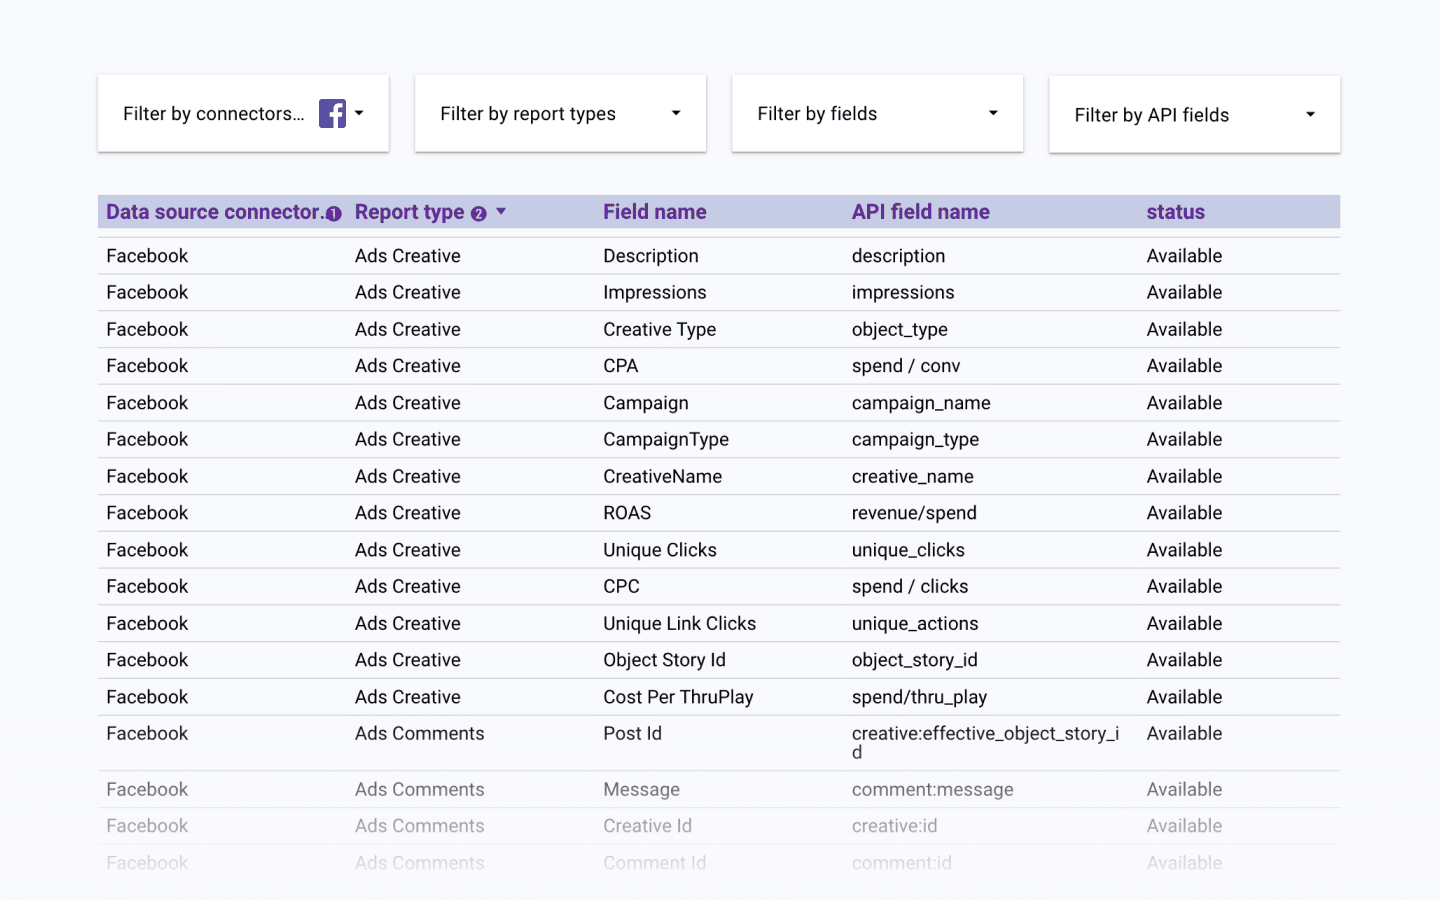
Besides, the access to the data dictionary is a strong tick on the tool's CV. The data dictionary shows analysts all data fields that the software can map. Here's an example of Improvado's data dictionary that contains over 28,000 reports types for sales and marketing data.
Finally, let's not forget about customer support. Complex solutions that offer more functionalities than just data mapping should have an onboarding system. A ticketing system for new feature and bug fixes requests is also required.
Data mapping scheduling
If you're extracting new data continuously (to create real-time marketing reports, for example), your data mapping tool should have scheduling functionality.
Each time you extract new data from your data sources, the platform performs mapping activities automatically. This level of automation is crucial if you want to create real-time visualization dashboards.
Key takeaways:
- Find the tool that supports all the formats you might need in the future. You wouldn’t want to migrate to another solution because it doesn’t support your database’s file formats.
- Keep in mind that if you’re choosing a tool for non-technical employees, the platform should be intuitive and easy-to-use. Also, pay attention to the detailed documentation and technical support.
- Automated data mapping tools should have a scheduling feature. This functionality allows users to adjust data extraction and transformation workflow more personalized.
Data mapping tools comparison table
Here’s the list of the best tools with data mapping features:
| Data mapping tool | Best for | The number of integrations | Price | Use cases |
| Improvado | Revenue data integration, normalization, advanced transformations, ETL, ELT | 300+ | Depends on business requirements | Cross-channel marketing automation, complex transformations, data analytics ETL |
| Xplenty | Data integration, ETL, ELT | 100+ | Depends on business requirements | Cross-channel data automation, ELT, ETL |
| Dell Boomi | Data integration, data automation | 140+ | Starts with $549/month | Cross-channel data automation, real-time integration |
| Talend | Advanced transformations, data integration tool | 200+ | Starts with $1,170 USD per month per user | Data transformations, data integration, data mapping |
| Informatica PowerCenter | Data migration, data integration | 150 | Consumption-based pricing | Data transformation, data mapping, data migration |
| Supermetrics | Data integration, ETL | 70+ | Starts with €69/month | ETL, automated reporting |
| Funnel | Marketing data integration, ETl | 500+ (The majority of them available only on demand) | Starts with €359/month | Marketing ETL |
| Fivetran | ETL, ELT, data integration, data transformation | 150+ | Credit-based pricing, starts with 1$/credit | Database integration, data migration, ETL, ELT |
| Oracle Integration Cloud | Data mapping, data integration | 100+ | Depends on business objectives | Data integration |
| Adverity | ETL, data visualization | 200+ | Depends on business objectives | Data management, data extraction |
| Stitch | ETL | 130+ | Depends on data usage, starts with $100/month for 5 million data rows | Data extraction, data cleansing, data transformation |
Best data mapping tools by categories
Now that we know what to look for in data mapping tools, let's review some of the best data mapping tools on the market.
Data mapping tools for cross-channel marketing automation
The platforms listed in this section can do all data conversions, mappings, and integrations from any source to any destination by using the same consistent set of rules across all data sources.
Improvado MCDM
Improvado is an ETL platform designed for revenue teams. The platform does a lot more than just source to destination mapping. With 500+ integrations on board, Improvado extracts data from numerous marketing data sources, normalizes collected data, and loads it into a centralized data warehouse.
One of its core functionalities is MCDM (Marketing Common Data Model). This tool unifies disparate naming conventions, matches all data fields, and bridges the gap between the data source and the user's destination.
MCDM makes marketing and sales data ready to consume right away. It's a code-free data mapping tool. Without it, revenue teams have to spend from 10 to 50 hours a week (and more, depending on the size of the team) creating data maps for their metrics.
Besides, MCDM comes with a prebuilt Google Data Studio dashboard for real-time monitoring of marketing performance. The platform offers a one-hour data sync frequency, so analysts always have up-to-date insights at their fingertips.
Xplenty
Xplenty is an ETL platform that offers data mapping capabilities.
Xplenty data mapping tool does an automated conversion of data from around 100 sources to cloud data warehouses without human intervention. It uses the same rules across all sources and destinations, which means there is less room for errors when it comes to data conversions between different systems.
Here’s an example of Xplenty’s data mapping UI:
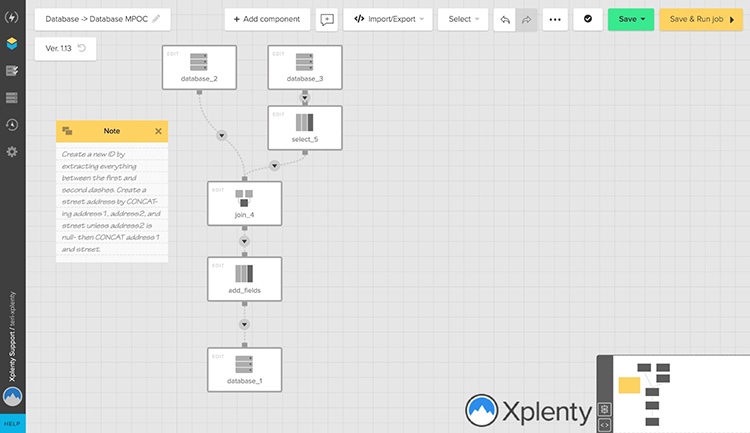
Xplenty doesn't just stop with data mapping as an ETL platform. It also includes capabilities for transforming raw data without the need for coding expertise, making it easier for consumers to work with.
Dell Boomi
Dell Boomi is an integration platform with a data mapping feature.
The Dell Boomi AtomSphere data mapping tool lets users map data fields between different systems, automate the process of data loading and transformation, and integrate with cloud-based apps.
With a drag and drop UI and an extensive library of connectors, users can implement sophisticated data integration projects with impressive speed. However, what works for others may not work for you due to different business needs. This is why it’s important to explore Boomi alternatives and competitors to find the best fit for your organization's unique requirements.
Data mapping tools for advanced transformation
This section covers tools that can cope with more complex data transformation tasks such as converting data to new formats, editing text strings, joining rows or columns, and more.
Improvado DataPrep
Improvado's DataPrep tool combines SQL's extensive data transformation capabilities with an intuitive spreadsheet-like interface.
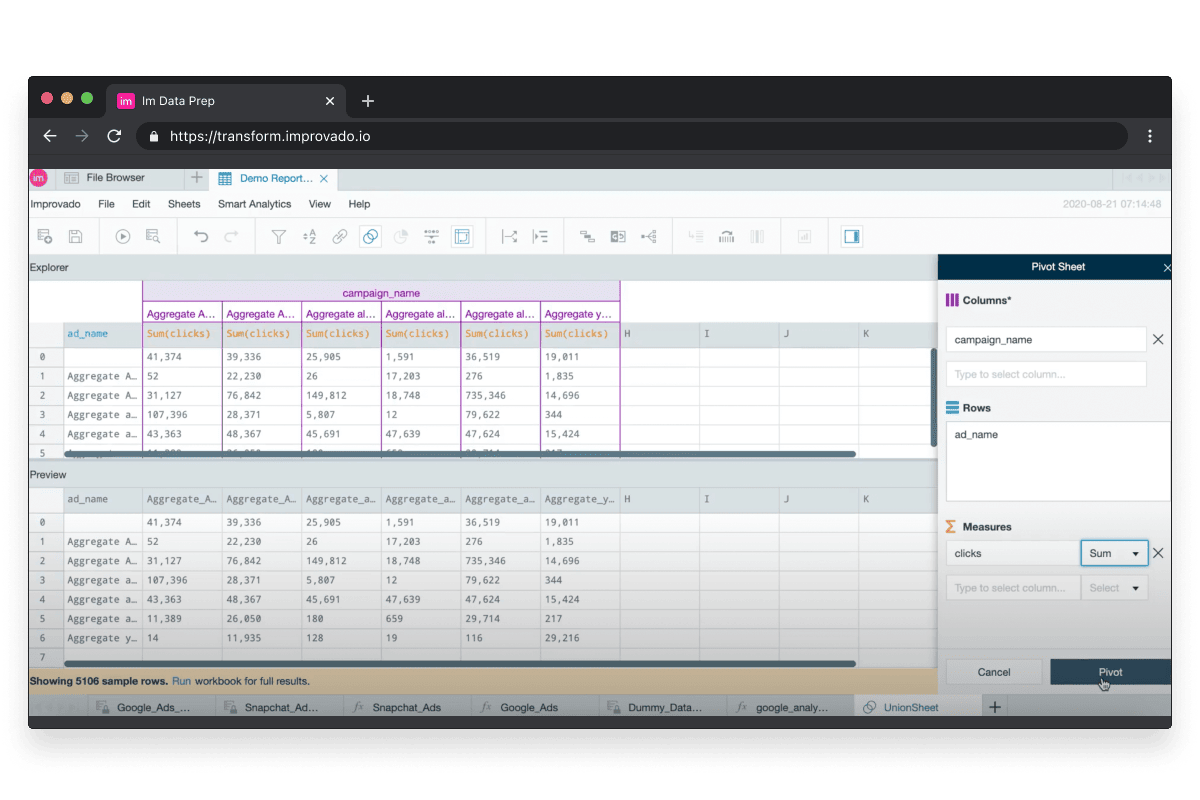
With DataPrep, marketing and sales teams can perform complex data transformations without coding knowledge. With SQL, analysts have to create tens of queries to explore data, debug, and organize data.
DataPrep drastically simplifies transformation and other data management tasks with transformation recipes, decision trees, clustering, and many more out-of-the-box features.
In addition to other benefits, it's much easier to onboard new team members on ongoing projects. Finding specialists that know how to use spreadsheets is much easier than finding ones with SQL expertise.
Talend
Talend Data Fabric is a data mapping and transformation solution provided by Talend.
The data mapping tool in Talend Data Fabric is an intuitive graphical interface that makes it easy for users to map data fields between different systems, join tables, and perform other complex data transformations.
Talend provides documentation describing its data mapping tool. That you can also get a closer look at the tool’s UI.

Besides, it lets users build reusable and scalable pipelines using a drag-and-drop mechanism. The platform also offers data quality services for error detection and correction.
Informatica PowerCenter
Informatica's PowerCenter data integration platform offers a data mapping tool that is both powerful and easy to use.
The data map editor in PowerCenter lets users visually map data fields between different systems, join tables, and perform other complex data transformations.
Plus, it includes a library of built-in transformation functions for data cleansing, data enrichment, data matching, and more.
All of these capabilities are backed by a metadata repository that lets users create reusable data integration flows.
Data mapping tools for essential data needs
Not everyone needs to extract data from tens of sources and create large-scale, real-time reports. Sometimes, analysts just need to connect a single source with a data warehouse to automate their day-to-day monitoring tasks.
This section covers the best tools suitable for such cases.
Supermetrics
Supermetrics offers a data extraction and aggregation tool that is designed for everyday business users.
The tool extracts data from 70+ connectors and allows moving data between sources and destinations in several clicks.
Here’s how Supermetrics works when loading data to BigQuery:
When working with BigQuery via Supermetrics, it allows mapping the source field to destination fields with its metadata manager. This feature improves the ability to handle data source changes and maintains consistent naming across data sources.
Funnel
Funnel is a tool for automated data collection and reporting. It integrates with marketing and sales data sources to transform fragmented insights into insightful reports.
Data mapping is one of Funnel's primary advantages. Funnel allows analysts to create a set of rules that combines data across multiple sources.
What's more, in Funnel you can create custom metrics based on dimensional values (rules) or with simple mathematical formulas.
Here you can learn more about Funnel’s UI and data mapping capabilities.

Funnel's rules are a great way to build metrics based on dimensional value. For instance, marketers can use rules to subtract VAT from cost per market.

Data mapping tools for types of tasks
We've touched upon tools for marketing needs and complex data transformation. However, there are also tools that can accelerate analytics in other ways. Let's take a look at them.
Fivetran
Fivetran is a data pipeline company that helps businesses move data from any source into data warehouses and data lakes.
The data pipeline extracts insights automatically and builds schemas on the fly, which means there is little to no setup time required.
Fivetran creates the mapping between data sources and destinations' tables/columns. If analysts need to add a new column or make any changes to the source schema, Fivetran automatically detects alterations and adjusts mapping rules automatically.
What's more, the platform automatically updates data types in case of widening changes, truncates long values, and many more.
Still, Fivetran is more of a general-purpose tool for data transformation and integration. It doesn't support so many various marketing and sales connectors like previous solutions.
Oracle Integration Cloud
Oracle Data Mapper is a part of Oracle Integration Cloud.
As the name suggests, Oracle Data Mapper is quite similar to other solutions on our list. It enables you to assign the value of a process data object, predefined variable, or literal to another data object or variable within the data integration process.
Learn more about Oracle’s data mapping tool with Oracle’s documentation.
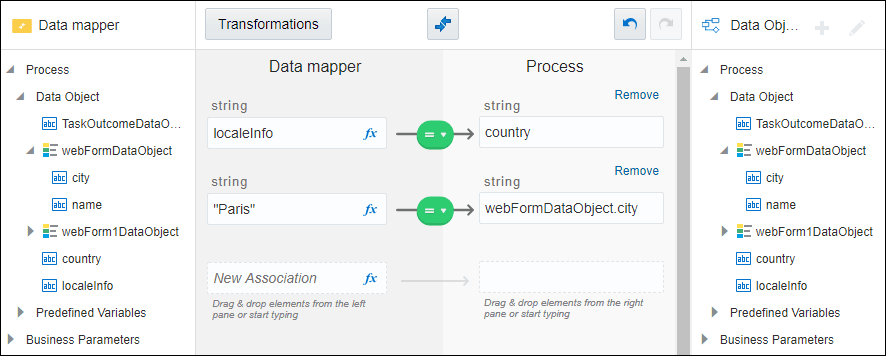
Oracle's data mapper automatically builds metadata for source schemas and creates a one-to-one record for every data object in the target schema. It also allows data transformations such as joins, unions, and Cartesian products.
Here’s a short guide showcasing Oracle data mapper’s features and drag and drop interface:
https://www.youtube.com/watch?v=iCVZwsHIVr4&t=140s&ab_channel=SamDoesOracle
Adverity
Adverity is a self-service data integration and management platform that simplifies data preparation, data enrichment, and data governance.
Adverity offers an intuitive schema mapping interface that is easy to use, even for people without coding skills. With the platform's functionality, you can realign, combine, and rename data types during the transition from your data source to a destination.
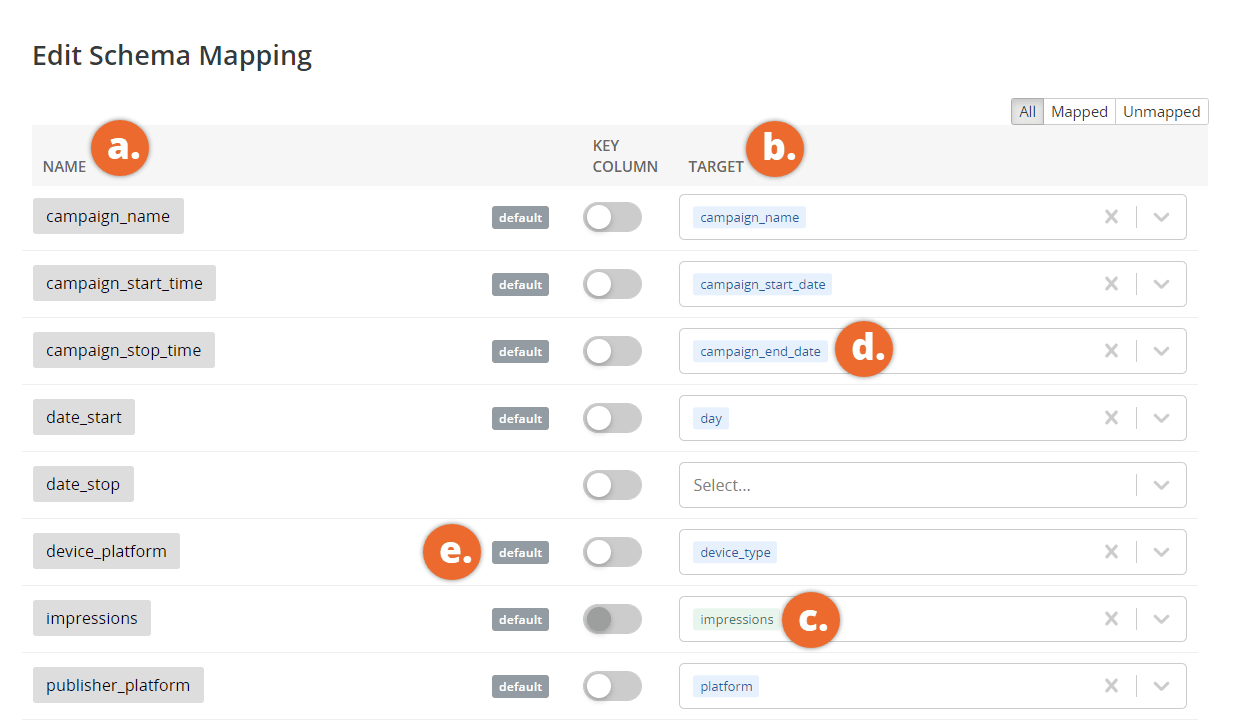
The tool includes a wide range of connectors for data enrichment and data cleansing.
On the other hand, Adverity's functionalities are pretty much limited to the common use cases and any advanced data manipulations require additional investments of time and resources.
Plus, the platform's pricing model isn't very flexible. Clients have to pay for the number of connectors and accounts they use, which doesn't leave much space for experiments and growth.
Stitch Data
Stitch is a data connectivity service that simplifies data integration with over 130+ web, mobile, and cloud data sources.
The platform's data mapping functionality supports data standardization by converting values from different formats into the same structure. It also includes basic source schema detection to ensure consistent data types across all connections used in ETL processes.
However, data mapping is just one of Stitch's functionalities. It doesn't include data cleansing and advanced data transformation capabilities.
Additionally, the platform supports fewer data sources than Fivetran, Funnel, or Improvado. This could be a major issue for companies that need to work with several different data types simultaneously.
Delegate manual data mapping process to Improvado
With data mapping processes automated, data analysts gain more time to work with data and ensure that their data is accurate. In addition, they can focus on higher-level tasks rather than spending hours in the data preparation process.
Still, have to pick up the right tool and put it to work to see some results. If you're still undecided, give Improvado's MCDM a try.
You can use Marketing Common Data Model for schema mapping and data preparation across 500+ marketing and sales data sources. Unlike other solutions, it unifies values of certain demographic metrics, such as geo, age, and gender.
Get a demo to see MCDM in action and learn how it can accelerate your growth.
.png)
.jpeg)


.png)
