
The best AI dashboards for marketing analytics in 2026 are: Improvado (best for enterprises with 1,000+ data sources), Tableau with Einstein (best for large-scale BI integration), Power BI with Copilot (best for Microsoft ecosystems), Looker with Gemini (best for BigQuery-first teams), ThoughtSpot (best for natural language queries), Domo (best for pre-built app connectors), Qlik Sense (best for associative data exploration), Sisense (best for embedded analytics), Klipfolio (best for mid-market teams), GoodData (best for white-label deployments), Dundas BI (best for on-premise requirements), and Yellowfin (best for collaborative storytelling).
Marketing teams drown in dashboards. Google Analytics shows one story, Google Ads another, and Meta Ads a third. You spend hours each week exporting CSVs, reconciling numbers, and explaining why totals don't match. By the time you spot a problem, the campaign has burned through half its budget.
AI dashboards solve this by automating anomaly detection, predicting outcomes, and surfacing insights without manual queries. They connect data sources automatically, flag statistically significant changes, and answer questions in plain English. But not all AI dashboards are built for marketing — many are general-purpose BI tools with AI features bolted on. This guide evaluates the 12 platforms that genuinely accelerate marketing analytics in 2026, covering their core AI capabilities, ideal use cases, and specific limitations you need to know before buying.
Key Takeaways
✓ AI dashboards use machine learning to automatically detect anomalies, predict trends, and surface insights that would take analysts days to find manually — AI features like anomaly detection help flag issues such as statistically significant drops in conversion rates for campaigns.
✓ The best AI dashboards for marketing integrate 1,000+ data sources natively, including Google Ads, Meta, LinkedIn, Salesforce, and HubSpot, eliminating the need for manual data pipelines or third-party connectors.
✓ Natural language query interfaces let non-technical marketers ask questions like "which campaigns drove the most pipeline last quarter?" and receive instant visualizations without writing SQL.
✓ AI-powered dashboards reduce reporting time by up to 80% by automating data preparation, transformation, and visualization tasks that previously required dedicated analytics teams.
✓ Enterprise-grade AI dashboards include marketing-specific data models that understand concepts like multi-touch attribution, customer lifetime value, and cross-channel campaign performance out of the box.
✓ Implementation time varies dramatically: some platforms require months of data engineering work, while purpose-built marketing solutions like Improvado can be operational within a week.
Quick answer
An AI marketing dashboard is a data visualization platform that uses machine learning to automate insight discovery, predict outcomes, and answer analytical questions in natural language. The best AI dashboards for marketing analytics in 2026 include Improvado (best for enterprises with 1,000+ data sources), Tableau with Einstein (best for large-scale BI integration), Power BI with Copilot (best for Microsoft ecosystems), Looker with Gemini, ThoughtSpot, Domo, Qlik Sense, Sisense, Klipfolio, GoodData, Dundas BI, and Yellowfin.
What Is an AI Dashboard?
An AI dashboard is a data visualization platform that uses machine learning and artificial intelligence to automate insight discovery, predict outcomes, and answer analytical questions in natural language. Unlike traditional dashboards that display static metrics you configure manually, AI dashboards actively monitor your data, identify patterns, and alert you to anomalies without human intervention.
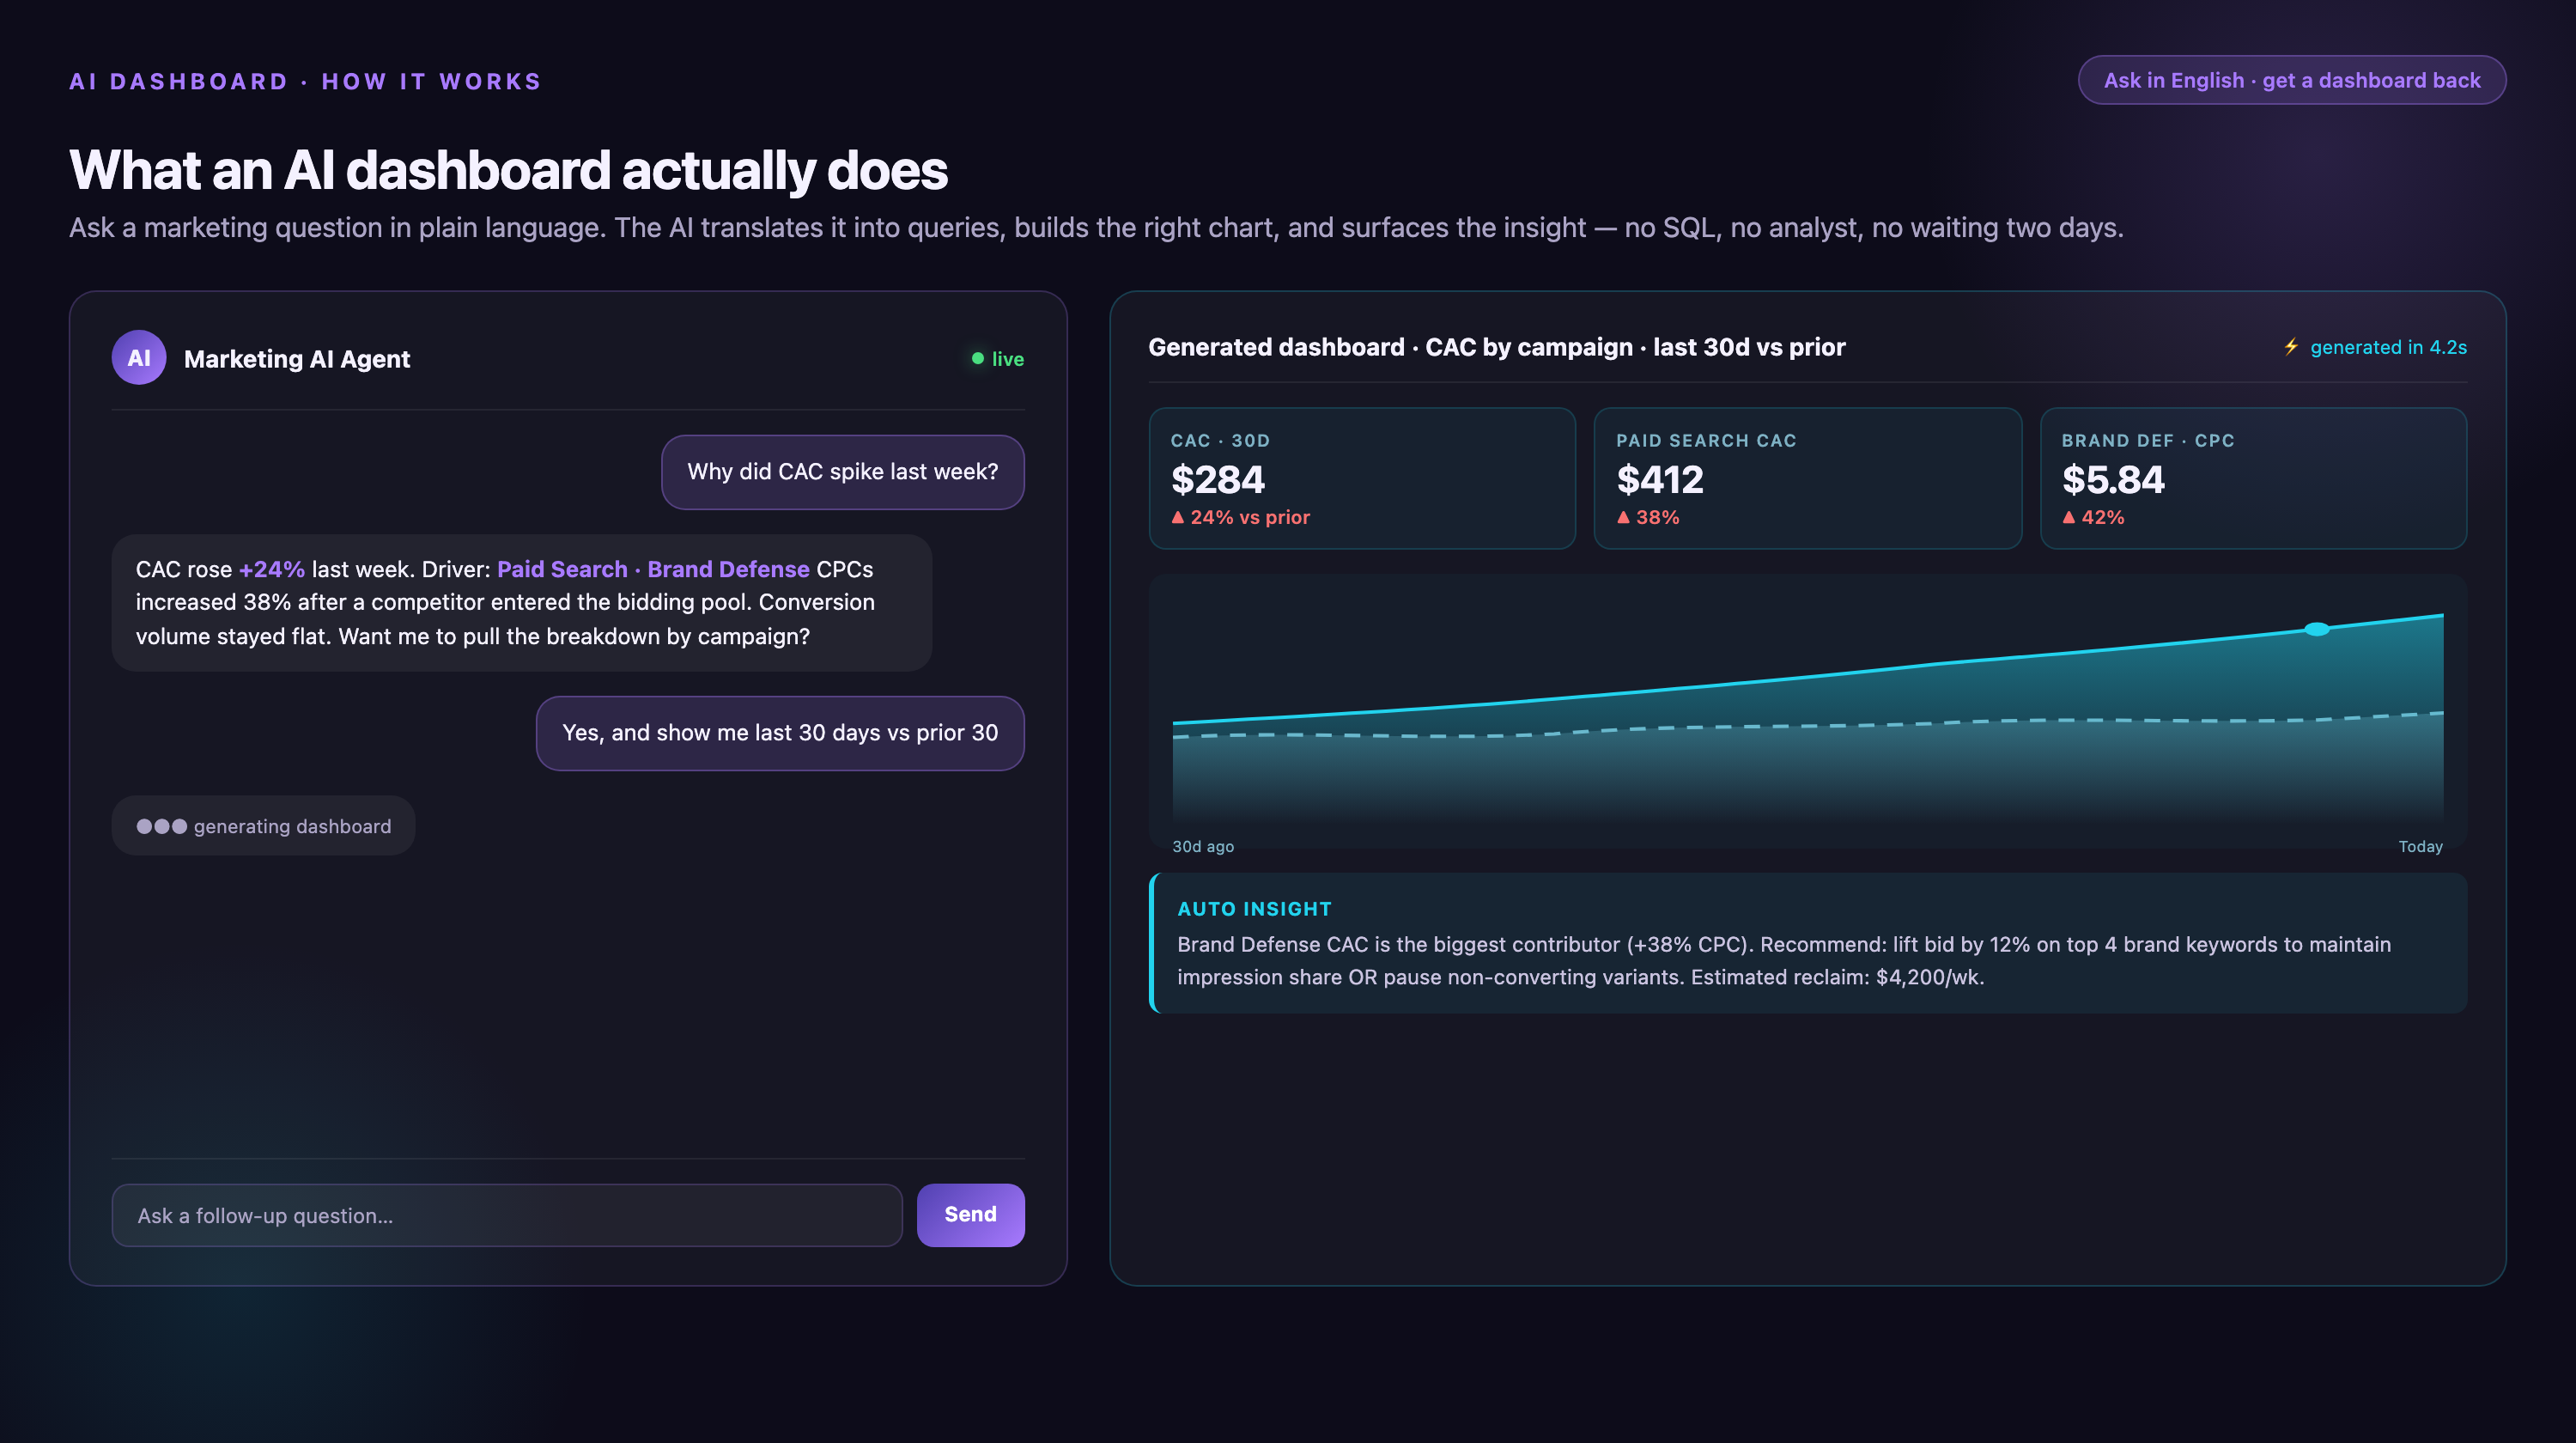
For marketing teams, this means the dashboard learns what "normal" looks like for your campaigns — typical conversion rates, cost per acquisition ranges, seasonal patterns — and flags deviations automatically. When your Facebook campaign's cost-per-click spikes 40% overnight, the AI detects it, calculates statistical significance, and sends an alert. When one channel starts outperforming others, it surfaces that trend before you think to look for it.
The core AI capabilities that separate these platforms from traditional BI tools include: automated anomaly detection that identifies outliers in real-time, predictive analytics that forecast future performance based on historical patterns, natural language processing that lets you ask questions conversationally instead of building queries, automated data preparation that cleans and transforms data without manual ETL work, and smart recommendations that suggest next-best actions based on your goals.
How Do You Choose an AI Dashboard for Marketing Teams?
Choose an AI dashboard by testing data source coverage, AI capability depth, marketing-specific data models, implementation speed, governance, and total cost of ownership against your own campaigns, not vendor demos. Score every shortlisted platform on these criteria with a proof of concept using your actual data, since features that excel in isolation often fail together.
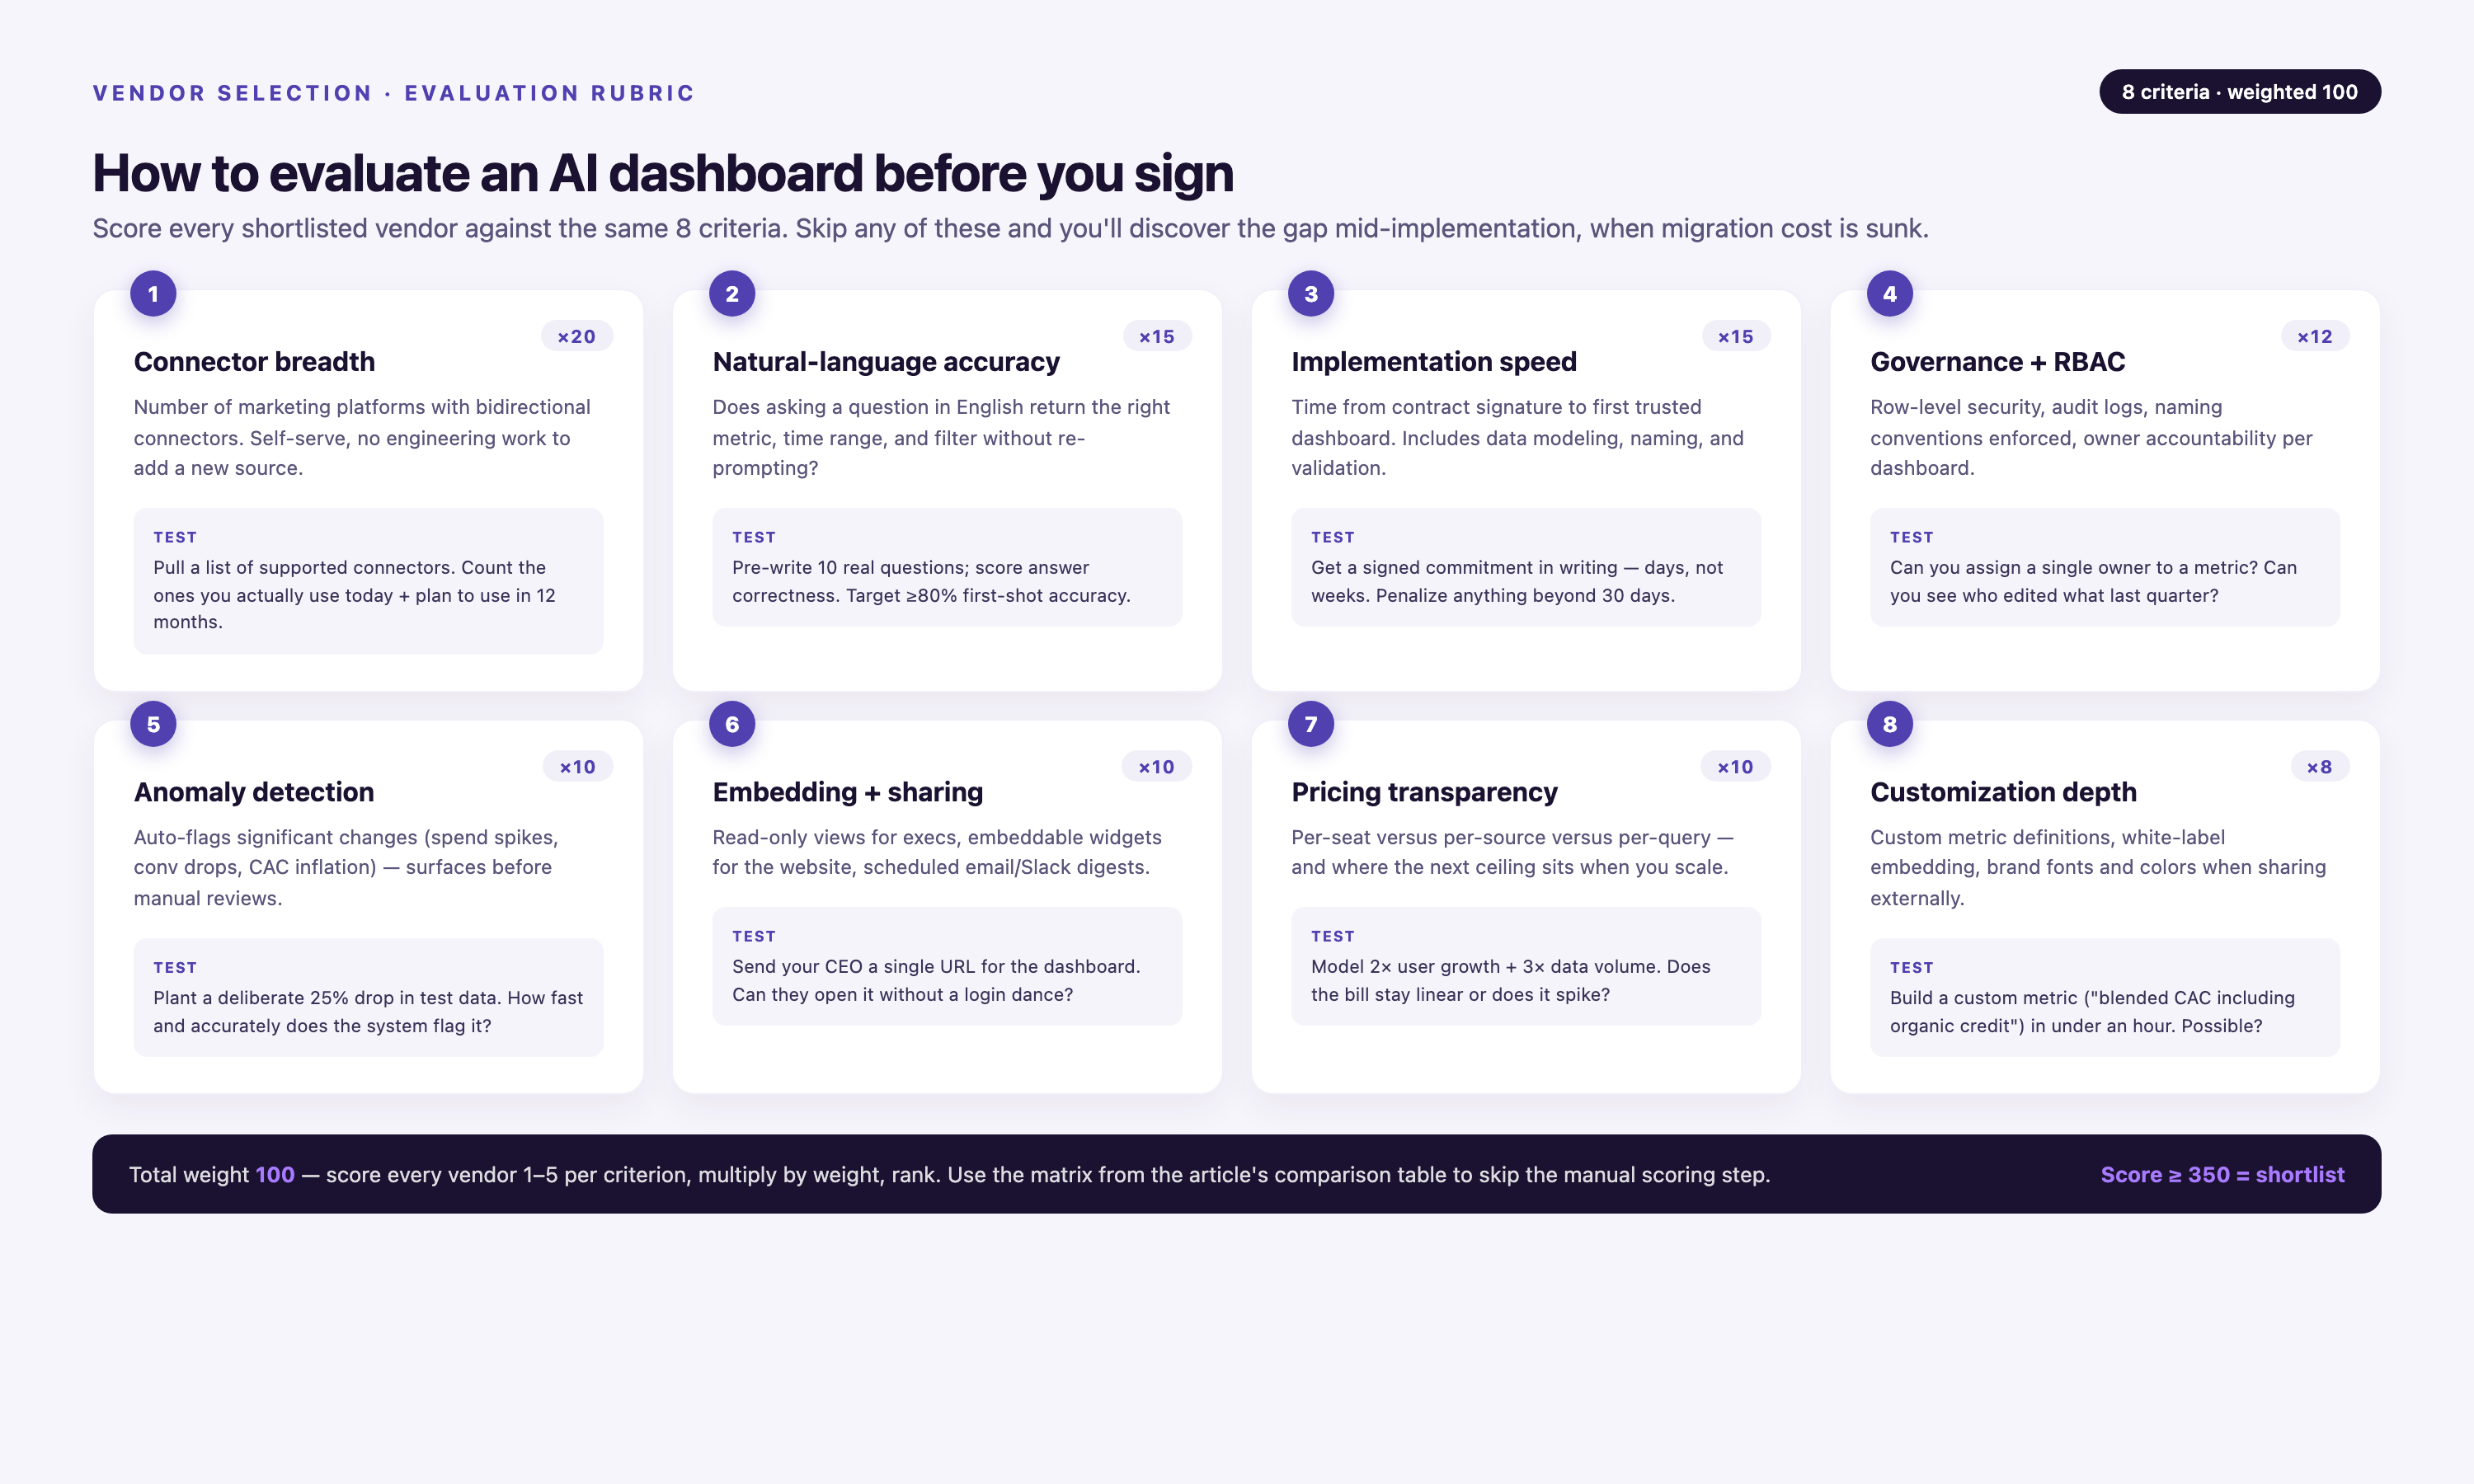
Data source coverage. Count how many of your current platforms the dashboard connects to natively. If you're running campaigns across Google Ads, Meta, LinkedIn, TikTok, Salesforce, HubSpot, and GA4, you need a platform with pre-built connectors for all seven. Custom connector development adds months to implementation and ongoing maintenance costs. The best platforms maintain 1,000+s and handle API changes automatically.
AI capability depth. Test the AI features with your actual data during a proof of concept. Ask the platform to detect anomalies in a campaign you know had issues. Query it in natural language with questions your team actually asks. Check if the predictive models account for seasonality in your industry. Many platforms claim AI capabilities but deliver basic rules-based alerting instead of genuine machine learning.
Marketing-specific data models. Generic BI tools force you to build attribution models, define marketing metrics, and create customer journey logic from scratch. Purpose-built marketing platforms include these models pre-configured. Look for platforms that understand multi-touch attribution, customer lifetime value calculation, campaign taxonomy, cross-channel journey mapping, and marketing-specific KPIs like ROAS, CAC, and MQL-to-SQL conversion rates.
Implementation speed. Ask how long it takes to go from contract signature to first dashboard. Enterprise BI platforms often require 3–6 months of data engineering work. Marketing-focused solutions should be operational within weeks. Implementation time directly correlates to time-to-value — the faster you're live, the faster you stop manual reporting.
Governance and compliance. Marketing data includes PII, purchase history, and behavioral tracking subject to GDPR, CCPA, and HIPAA regulations. Verify the platform's security certifications (SOC 2 Type II minimum), data residency options, role-based access controls, audit logging, and data retention policies. Enterprise teams need platforms that enforce data governance rules automatically, not tools that rely on manual processes.
Total cost of ownership. AI dashboard pricing varies wildly. Some charge per user, others by data volume, some by query count. Calculate TCO including: platform licensing, connector maintenance, implementation services, training, and ongoing support. The cheapest option often becomes the most expensive when you factor in engineering time to build custom integrations.
Improvado: AI-Powered Marketing Data Platform with Conversational Analytics
Improvado is an agentic marketing analytics platform that connects 1,000+ data sources, automatically transforms data into marketing-specific models, and includes an AI Agent that answers analytical questions conversationally. The platform is purpose-built for marketing teams at enterprises and agencies managing complex, multi-channel campaigns across dozens or hundreds of data sources.
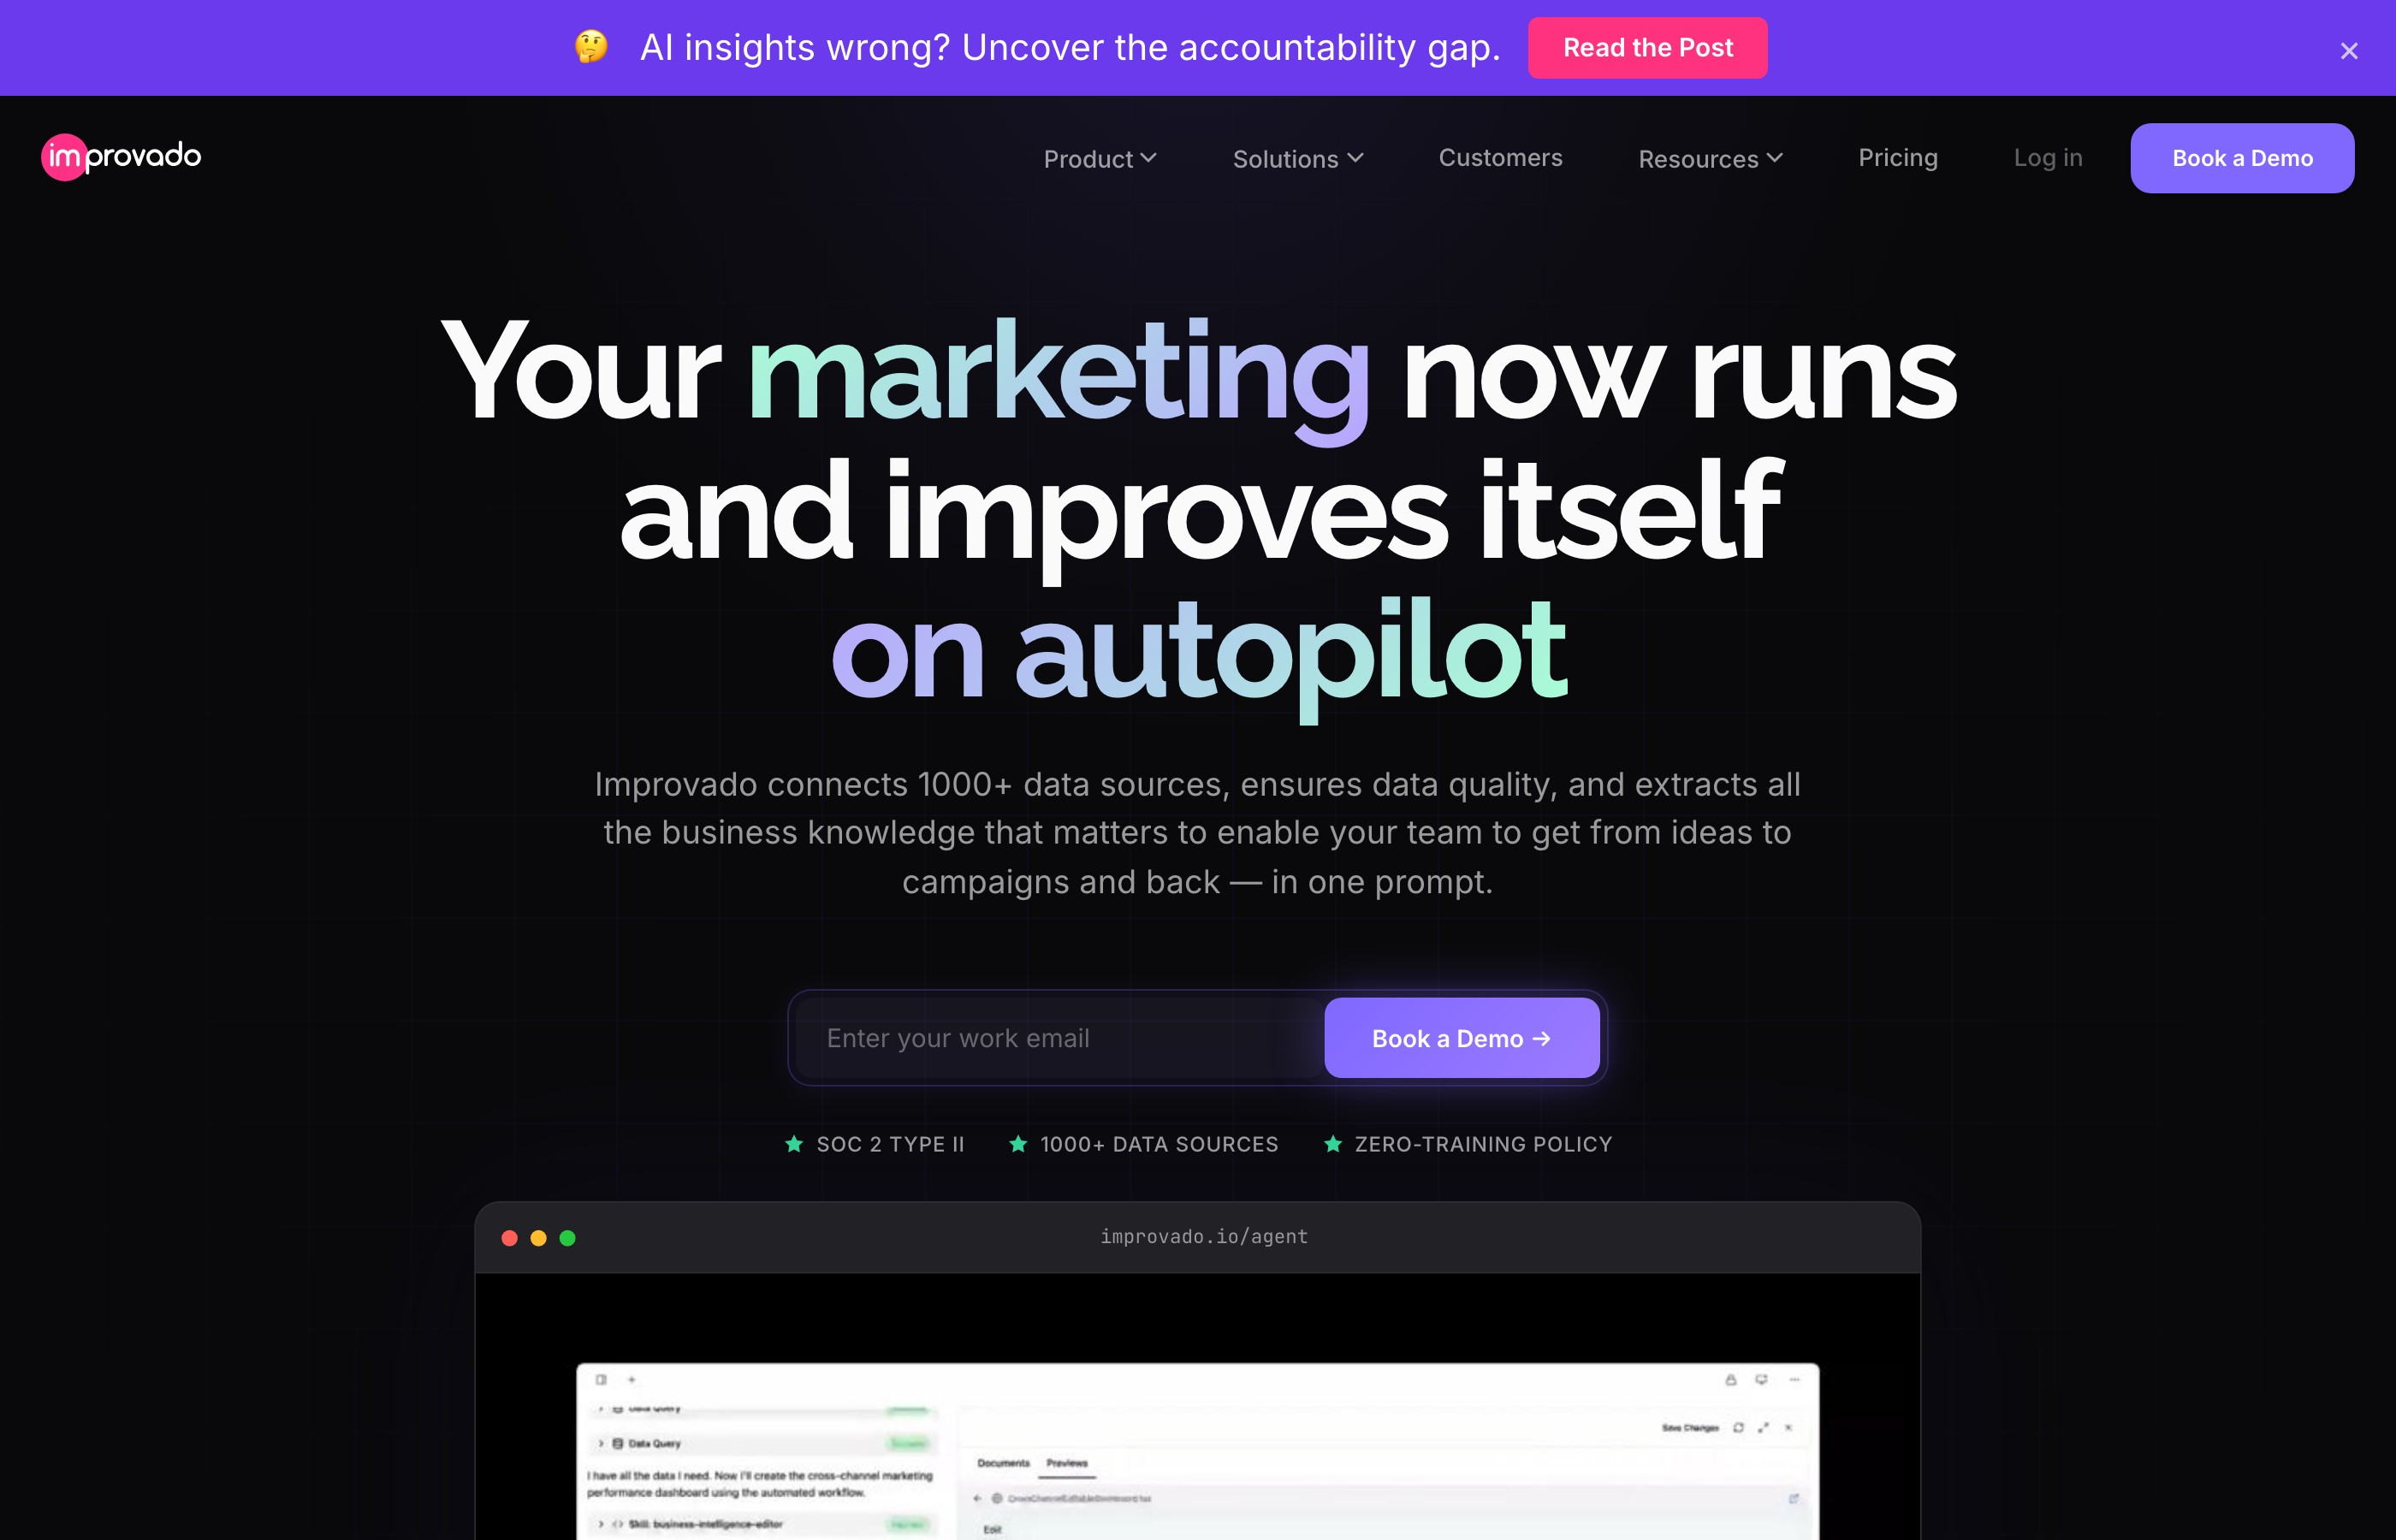
The core differentiator is the AI Agent, which queries your entire connected data ecosystem in natural language. Instead of building dashboards manually, you ask questions like "which campaigns drove the most pipeline last quarter?" or "show me CAC by channel for the last six months" and receive instant visualizations. The Agent understands marketing terminology — it knows what ROAS means, how to calculate customer lifetime value, and which metrics matter for different campaign types.
Marketing Data Governance Engine
Improvado includes 250+ pre-built data quality rules that validate campaign data before it reaches your dashboards. The platform flags common issues like missing UTM parameters, duplicate transaction IDs, mismatched currency codes, and incomplete conversion tracking. Budget validation happens pre-launch — the system checks that campaign budgets, targeting parameters, and tracking codes are configured correctly before campaigns go live.
This matters because most attribution errors stem from data quality issues, not model problems. When 30% of your campaigns lack proper UTM markup (a common issue the platform's research identified), your attribution model can't function correctly regardless of its sophistication. Improvado's governance engine catches these issues automatically instead of requiring manual audits.
Implementation Speed and Ideal Customer Profile
Improvado is typically operational within a week for standard connector configurations. The platform includes a no-code interface for marketers to configure data sources and a full SQL layer for engineering teams that need custom transformations. Implementation includes dedicated customer success management and professional services — not add-ons, but included in the platform license.
The platform is not ideal for small teams with simple reporting needs or companies running fewer than 10 data sources. Improvado is built for enterprises and agencies dealing with data complexity — hundreds of campaigns, dozens of markets, multiple BI tools, and strict governance requirements. Pricing is custom based on data volume and connector count, not per-user licensing.
Tableau with Einstein: Enterprise BI with AI-Powered Insights
Tableau is a market-leading business intelligence platform now integrated with Salesforce's Einstein AI capabilities. The combination delivers automated anomaly detection, natural language query via Tableau Pulse, and AI-generated dashboard recommendations. Tableau excels when your organization already uses Salesforce for CRM and has dedicated data engineering resources to manage data pipelines.
Einstein Discovery analyzes your data to identify patterns and predict outcomes without requiring data science expertise. For marketing teams, this means the platform can predict which leads are most likely to convert, forecast campaign performance based on historical patterns, and recommend optimal budget allocation across channels.
Salesforce Ecosystem Integration
The primary advantage is native Salesforce integration. If your marketing automation, CRM, and customer data all live in Salesforce, Tableau connects directly without third-party ETL tools. You can visualize the full customer journey from first touch through closed revenue with minimal data engineering work.
Tableau Pulse, the platform's natural language interface, lets marketers ask questions in plain English. However, it requires significant upfront configuration — someone needs to define metrics, set thresholds, and configure the semantic layer before non-technical users can query effectively. This setup work typically takes weeks and requires SQL knowledge.
Connector Limitations for Marketing Platforms
Tableau's pre-built connectors focus on databases and enterprise systems, not marketing platforms. Connecting Google Ads, Meta, LinkedIn, TikTok, and other advertising platforms requires third-party connector services or custom development. Many marketing teams end up paying for additional connector tools on top of Tableau licensing.
The platform is best suited for large enterprises with existing Salesforce deployments and dedicated BI teams. Pricing starts around $70 per user per month for Creator licenses (required to build dashboards), with additional costs for Tableau Server or Tableau Cloud hosting.
Power BI with Copilot: Microsoft-Native AI Analytics
Microsoft Power BI is a business intelligence platform deeply integrated with the Microsoft ecosystem, now enhanced with Copilot AI capabilities. Copilot adds natural language query, automated insight generation, and AI-assisted dashboard creation directly within Power BI. The platform is strongest when your organization runs on Microsoft infrastructure — Azure for data storage, Microsoft 365 for collaboration, and Teams for communication.
Copilot in Power BI lets you ask analytical questions conversationally and generates visuals automatically. Ask "show me revenue by region for Q4" and Copilot builds the chart, selects appropriate visualization types, and suggests follow-up questions. For marketing teams embedded in Microsoft environments, this reduces the technical barrier to accessing data.
Azure Data Integration
Power BI connects natively to Azure data services including Azure SQL Database, Azure Data Lake, and Azure Synapse Analytics. If your data engineering team already uses Azure for data warehousing, Power BI becomes a natural visualization layer. The platform handles large data volumes efficiently when connected to Azure, supporting datasets with billions of rows.
The AI capabilities include anomaly detection that automatically identifies outliers in time-series data, Q&A visual that answers natural language questions about specific dashboards, and Smart Narratives that generate text summaries of visual insights. These features work well for standard analytical patterns but struggle with marketing-specific queries like multi-touch attribution or customer journey analysis.
Marketing Platform Connectivity
Power BI includes some pre-built connectors for marketing platforms through its AppSource marketplace, but coverage is limited compared to specialized marketing analytics tools. Connecting Google Ads, Facebook Ads, and LinkedIn requires either third-party connector services, Power Query custom scripts, or manual data exports. API rate limits and data freshness become issues for teams running large-scale campaigns.
The platform is ideal for marketing teams at enterprises already standardized on Microsoft technology. Power BI Pro licenses cost $10 per user per month, with Premium capacity required for larger deployments (starting around $5,000 per month). Copilot capabilities require Microsoft Fabric licenses, adding to total cost.
Looker with Gemini: BigQuery-Native AI Analytics
Looker is Google Cloud's business intelligence platform, now enhanced with Gemini AI capabilities for natural language query and automated insight generation. Looker is architected specifically for BigQuery and excels when your data warehouse lives in Google Cloud Platform. The platform's LookML modeling language creates a semantic layer that defines metrics once and reuses them across all dashboards.
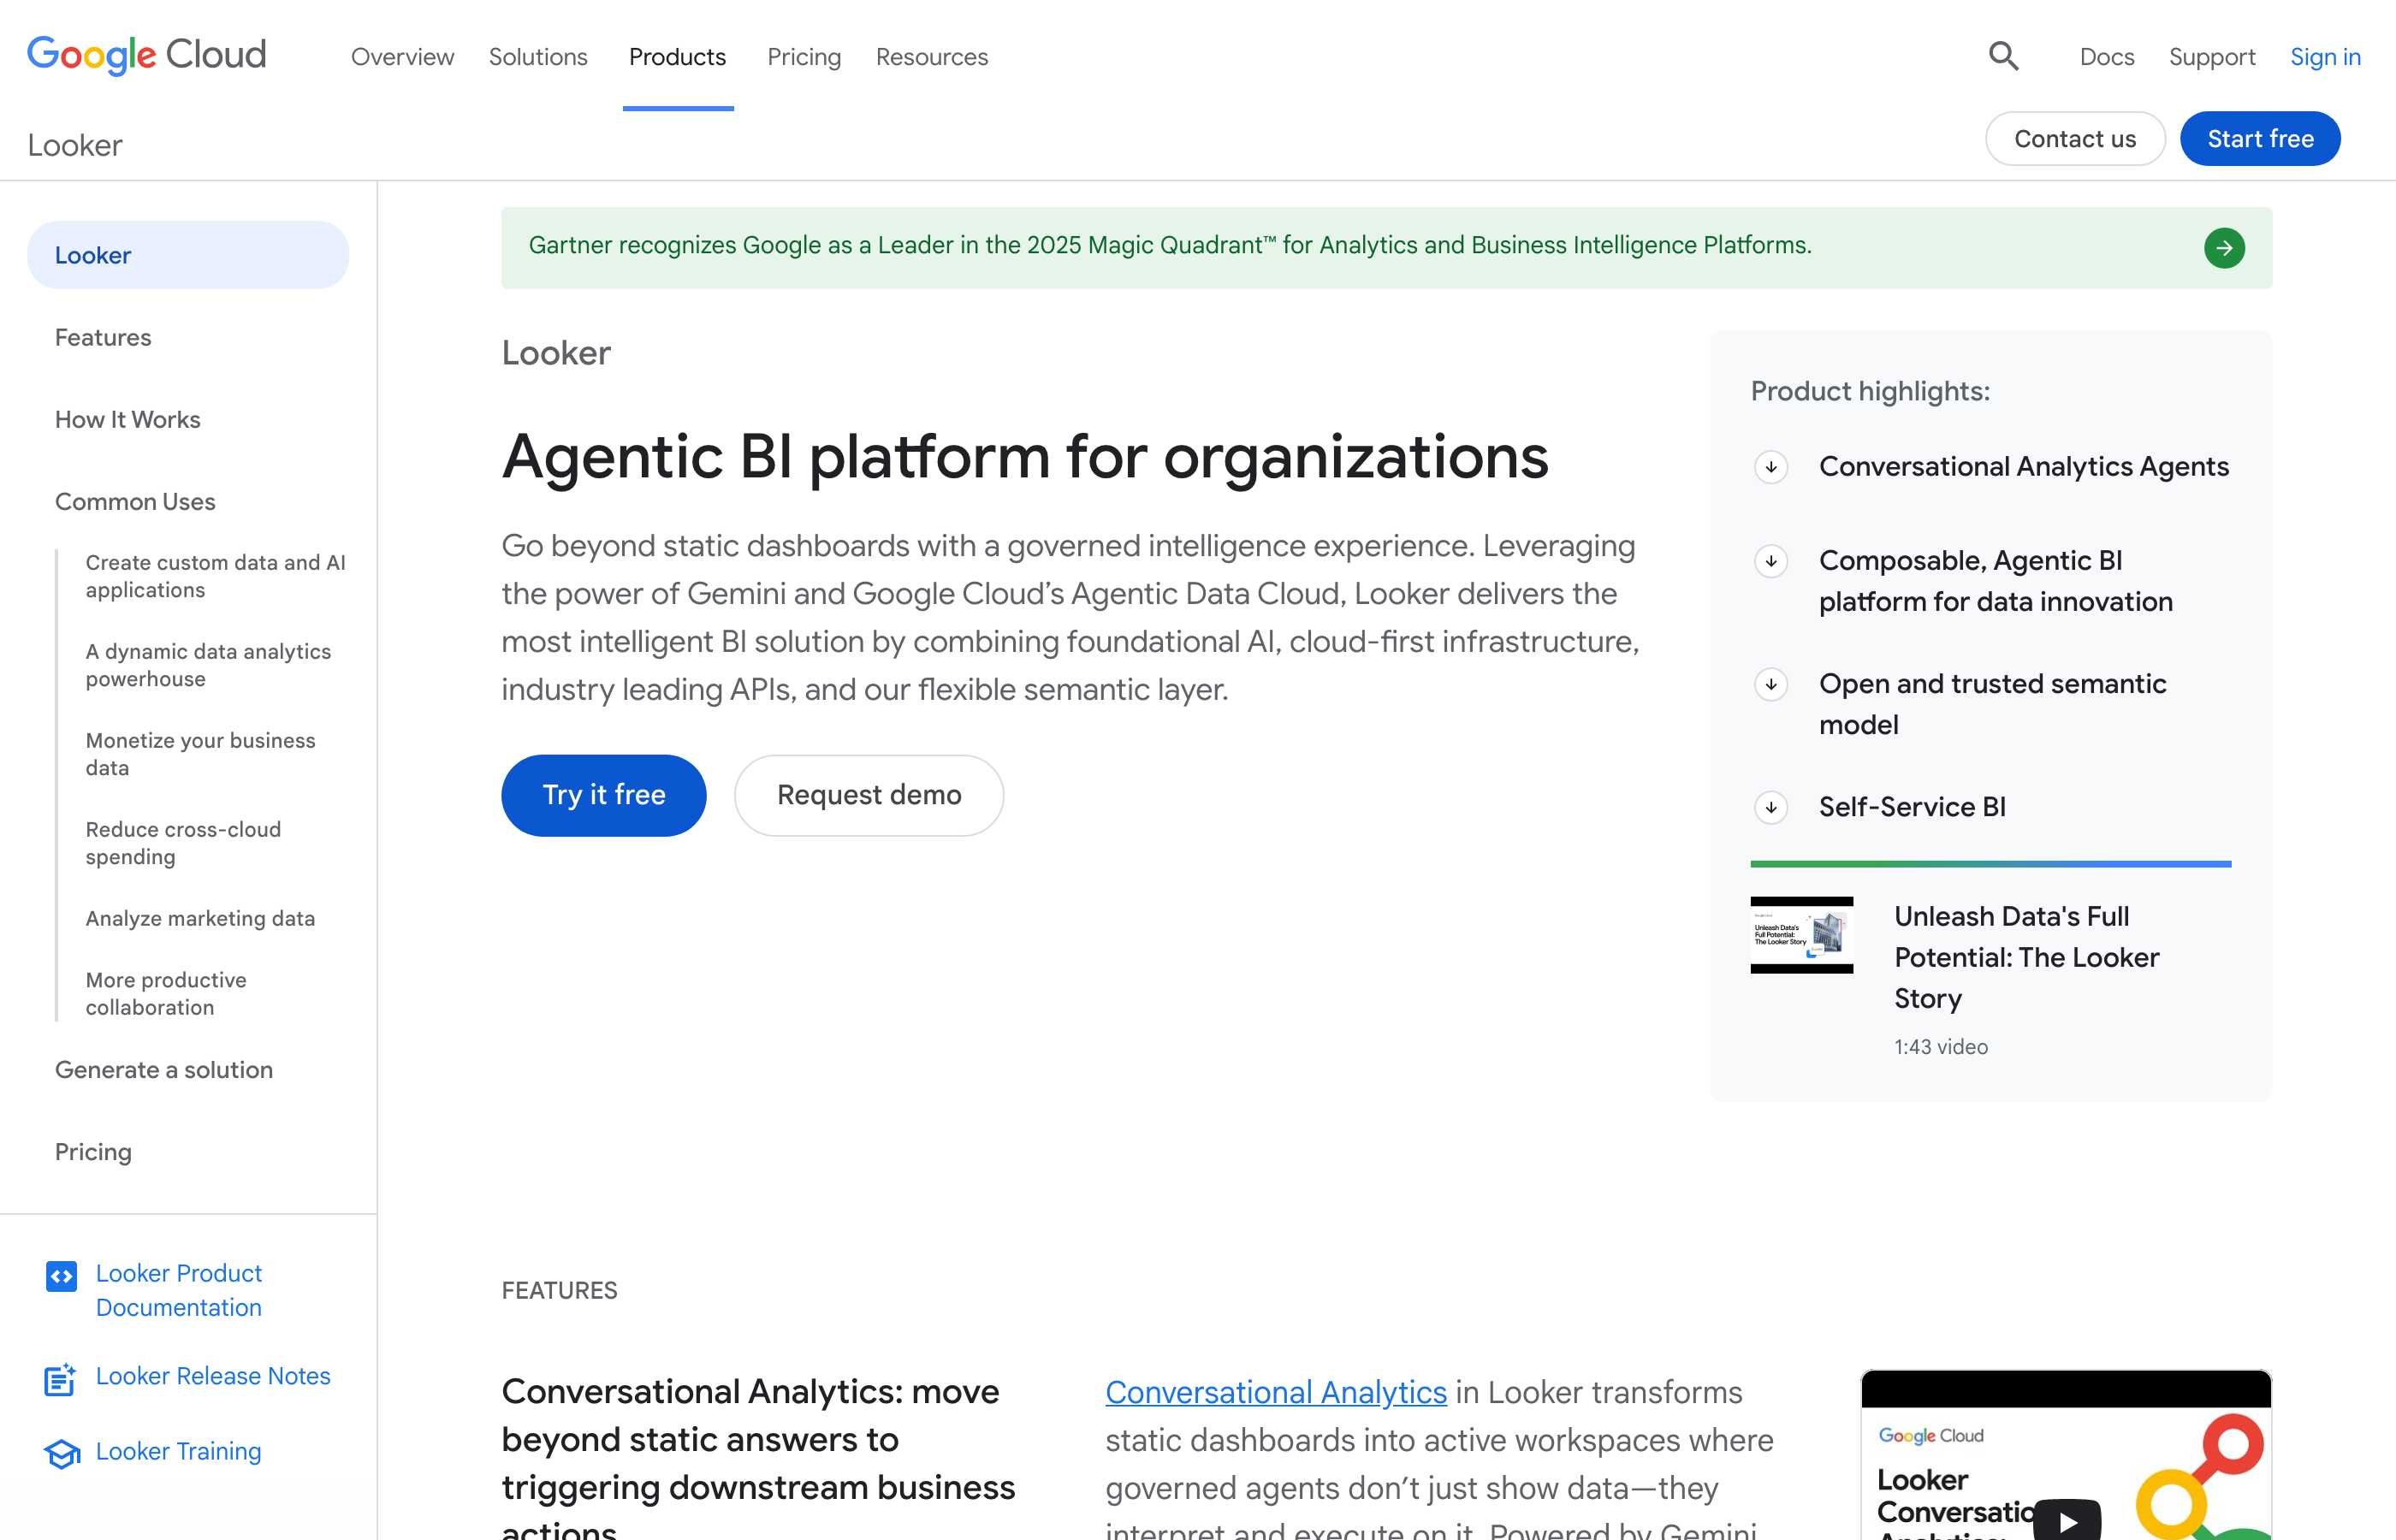
Gemini in Looker provides conversational analytics similar to other AI-enhanced BI tools, but with deeper integration into Google Cloud's AI infrastructure. The system can answer complex analytical questions, generate SQL queries from natural language, and create visualizations automatically. For marketing teams using Google Analytics 4, Google Ads, and BigQuery for data warehousing, Looker offers a cohesive ecosystem.
LookML Semantic Layer
LookML is Looker's proprietary modeling language that defines business logic, metrics, and relationships in code. Once configured, LookML ensures everyone in the organization uses the same metric definitions — no more debates about how to calculate customer acquisition cost or what counts as a qualified lead. This governance layer is powerful but requires engineering resources to maintain.
The semantic layer makes AI features more accurate because Gemini understands your business context. When you ask about "marketing qualified leads," the AI knows exactly which fields and filters to apply because they're defined in LookML. However, building and maintaining LookML models requires SQL expertise and ongoing engineering effort as your data models evolve.
Implementation Complexity
Looker implementation typically takes 3–6 months because it requires building the LookML semantic layer, configuring access controls, and training users on the platform's unique approach. This upfront investment pays off for large teams with complex analytical needs, but it's overkill for marketing departments that need to start analyzing data within weeks.
The platform works best for data-mature organizations with BigQuery data warehouses and dedicated analytics engineering teams. Pricing is custom based on deployment size, typically starting around $3,000 per month for small teams. Marketing platform connectors require custom development or third-party ETL tools to load data into BigQuery before Looker can visualize it.
ThoughtSpot: Search-Driven AI Analytics Platform
ThoughtSpot is an AI-powered analytics platform built around search-first interaction. Instead of building dashboards manually, users type questions into a search bar and ThoughtSpot generates visualizations instantly. The platform's AI, called Sage, uses natural language processing to interpret queries and large language models to suggest follow-up questions and insights.
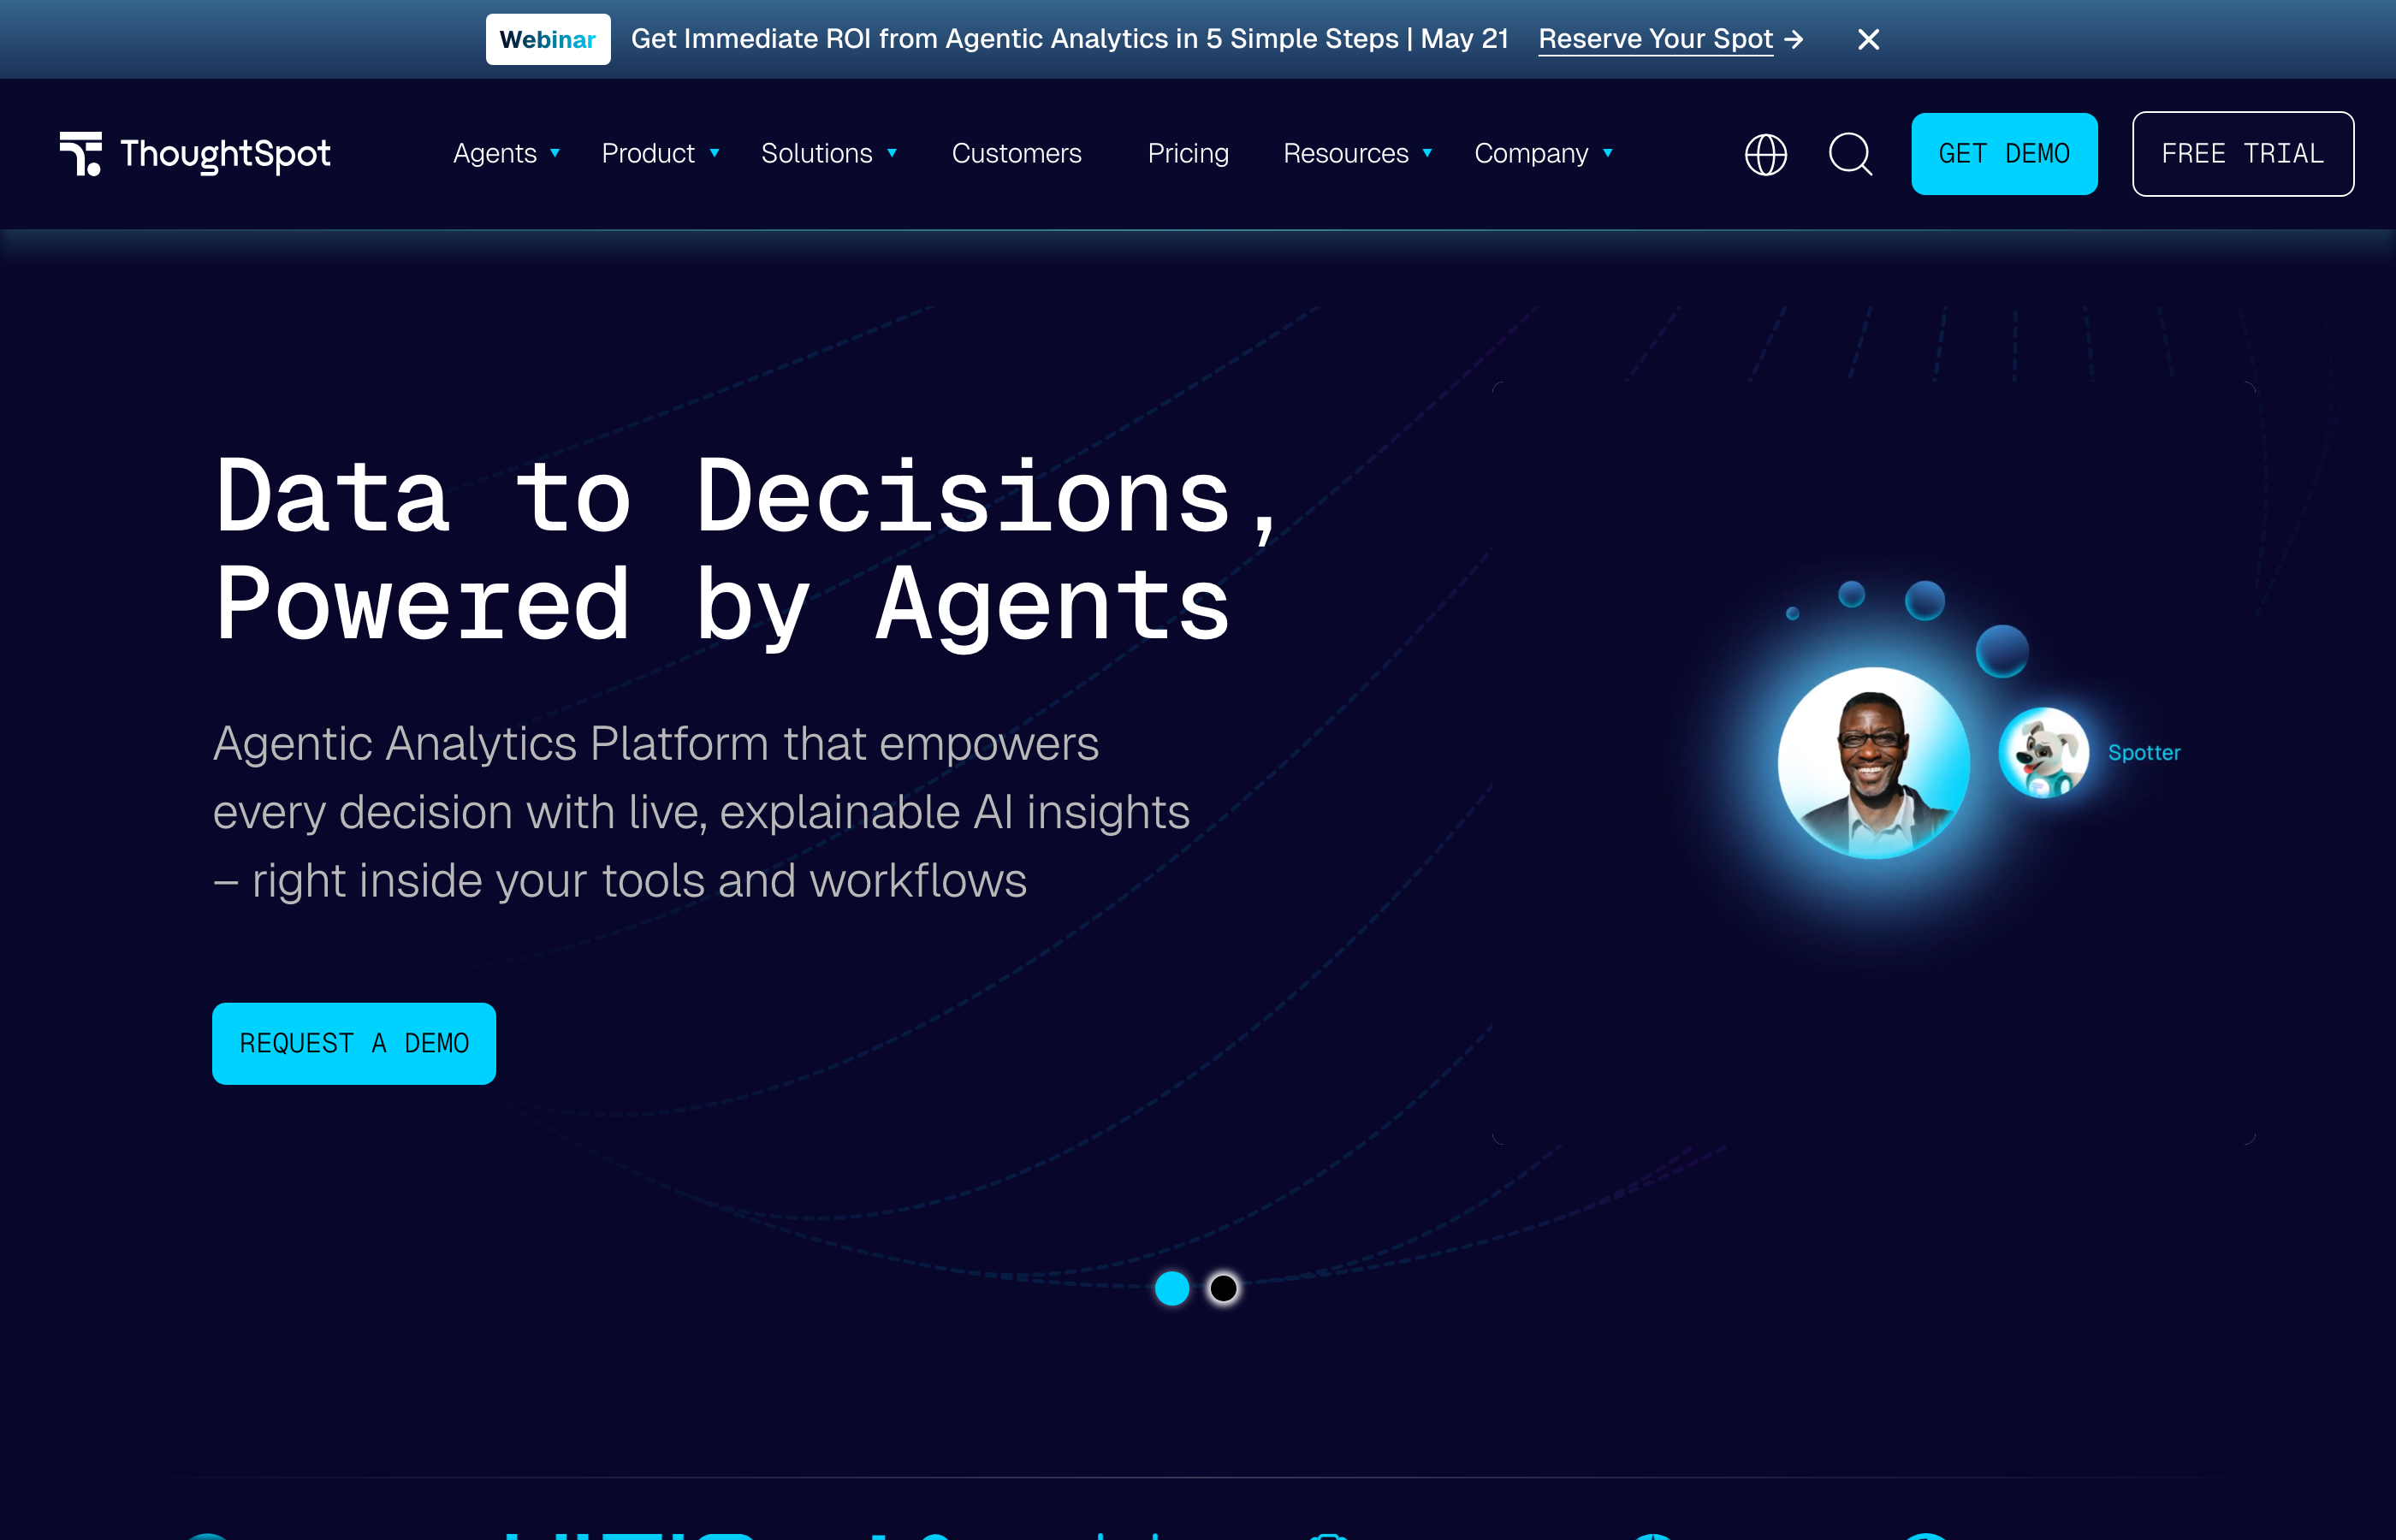
The core differentiator is the search paradigm. ThoughtSpot treats analytical queries like Google searches — you type "sales by region last quarter," and the platform generates appropriate visualizations without requiring you to select chart types, configure filters, or write SQL. This approach reduces time-to-insight dramatically for non-technical users.
SpotIQ Automated Insights
SpotIQ is ThoughtSpot's automated insight engine that continuously analyzes your data for patterns, anomalies, and trends. The system runs in the background, flagging statistically significant changes without manual monitoring. For marketing teams, this means SpotIQ detects when campaign performance deviates from expected patterns, identifies which segments are driving growth, and surfaces correlations between marketing activities and revenue outcomes.
The challenge is that SpotIQ generates many insights, and not all are actionable. Teams need processes to triage alerts and determine which patterns matter for their specific business context. Without this discipline, users suffer from alert fatigue and start ignoring notifications.
Data Modeling Requirements
ThoughtSpot requires structured, clean data to function effectively. The search interface works well when your data models are properly configured with relationships, synonyms, and indexing. This means someone needs to invest time upfront defining how tables relate, which columns represent metrics versus dimensions, and what business terms map to technical field names.
Marketing platform connectivity is limited compared to specialized marketing analytics tools. ThoughtSpot connects to data warehouses efficiently but lacks pre-built connectors for most advertising platforms. Teams typically use Fivetran, Airbyte, or custom scripts to load marketing data into Snowflake or BigQuery, then connect ThoughtSpot to the warehouse.
The platform is ideal for enterprises with data warehouses already in place and teams comfortable with search-based interfaces. Pricing is custom based on deployment size and data volume. Implementation typically takes 2–4 months including data modeling and user training.
Domo: App-Centric AI Business Intelligence
Domo is a cloud-based business intelligence platform with a library of 1,000+ pre-built app connectors and AI-powered features called Domo Sage. The platform positions itself as a complete business management solution beyond just analytics, including project management, workflow automation, and collaboration tools embedded directly in dashboards.
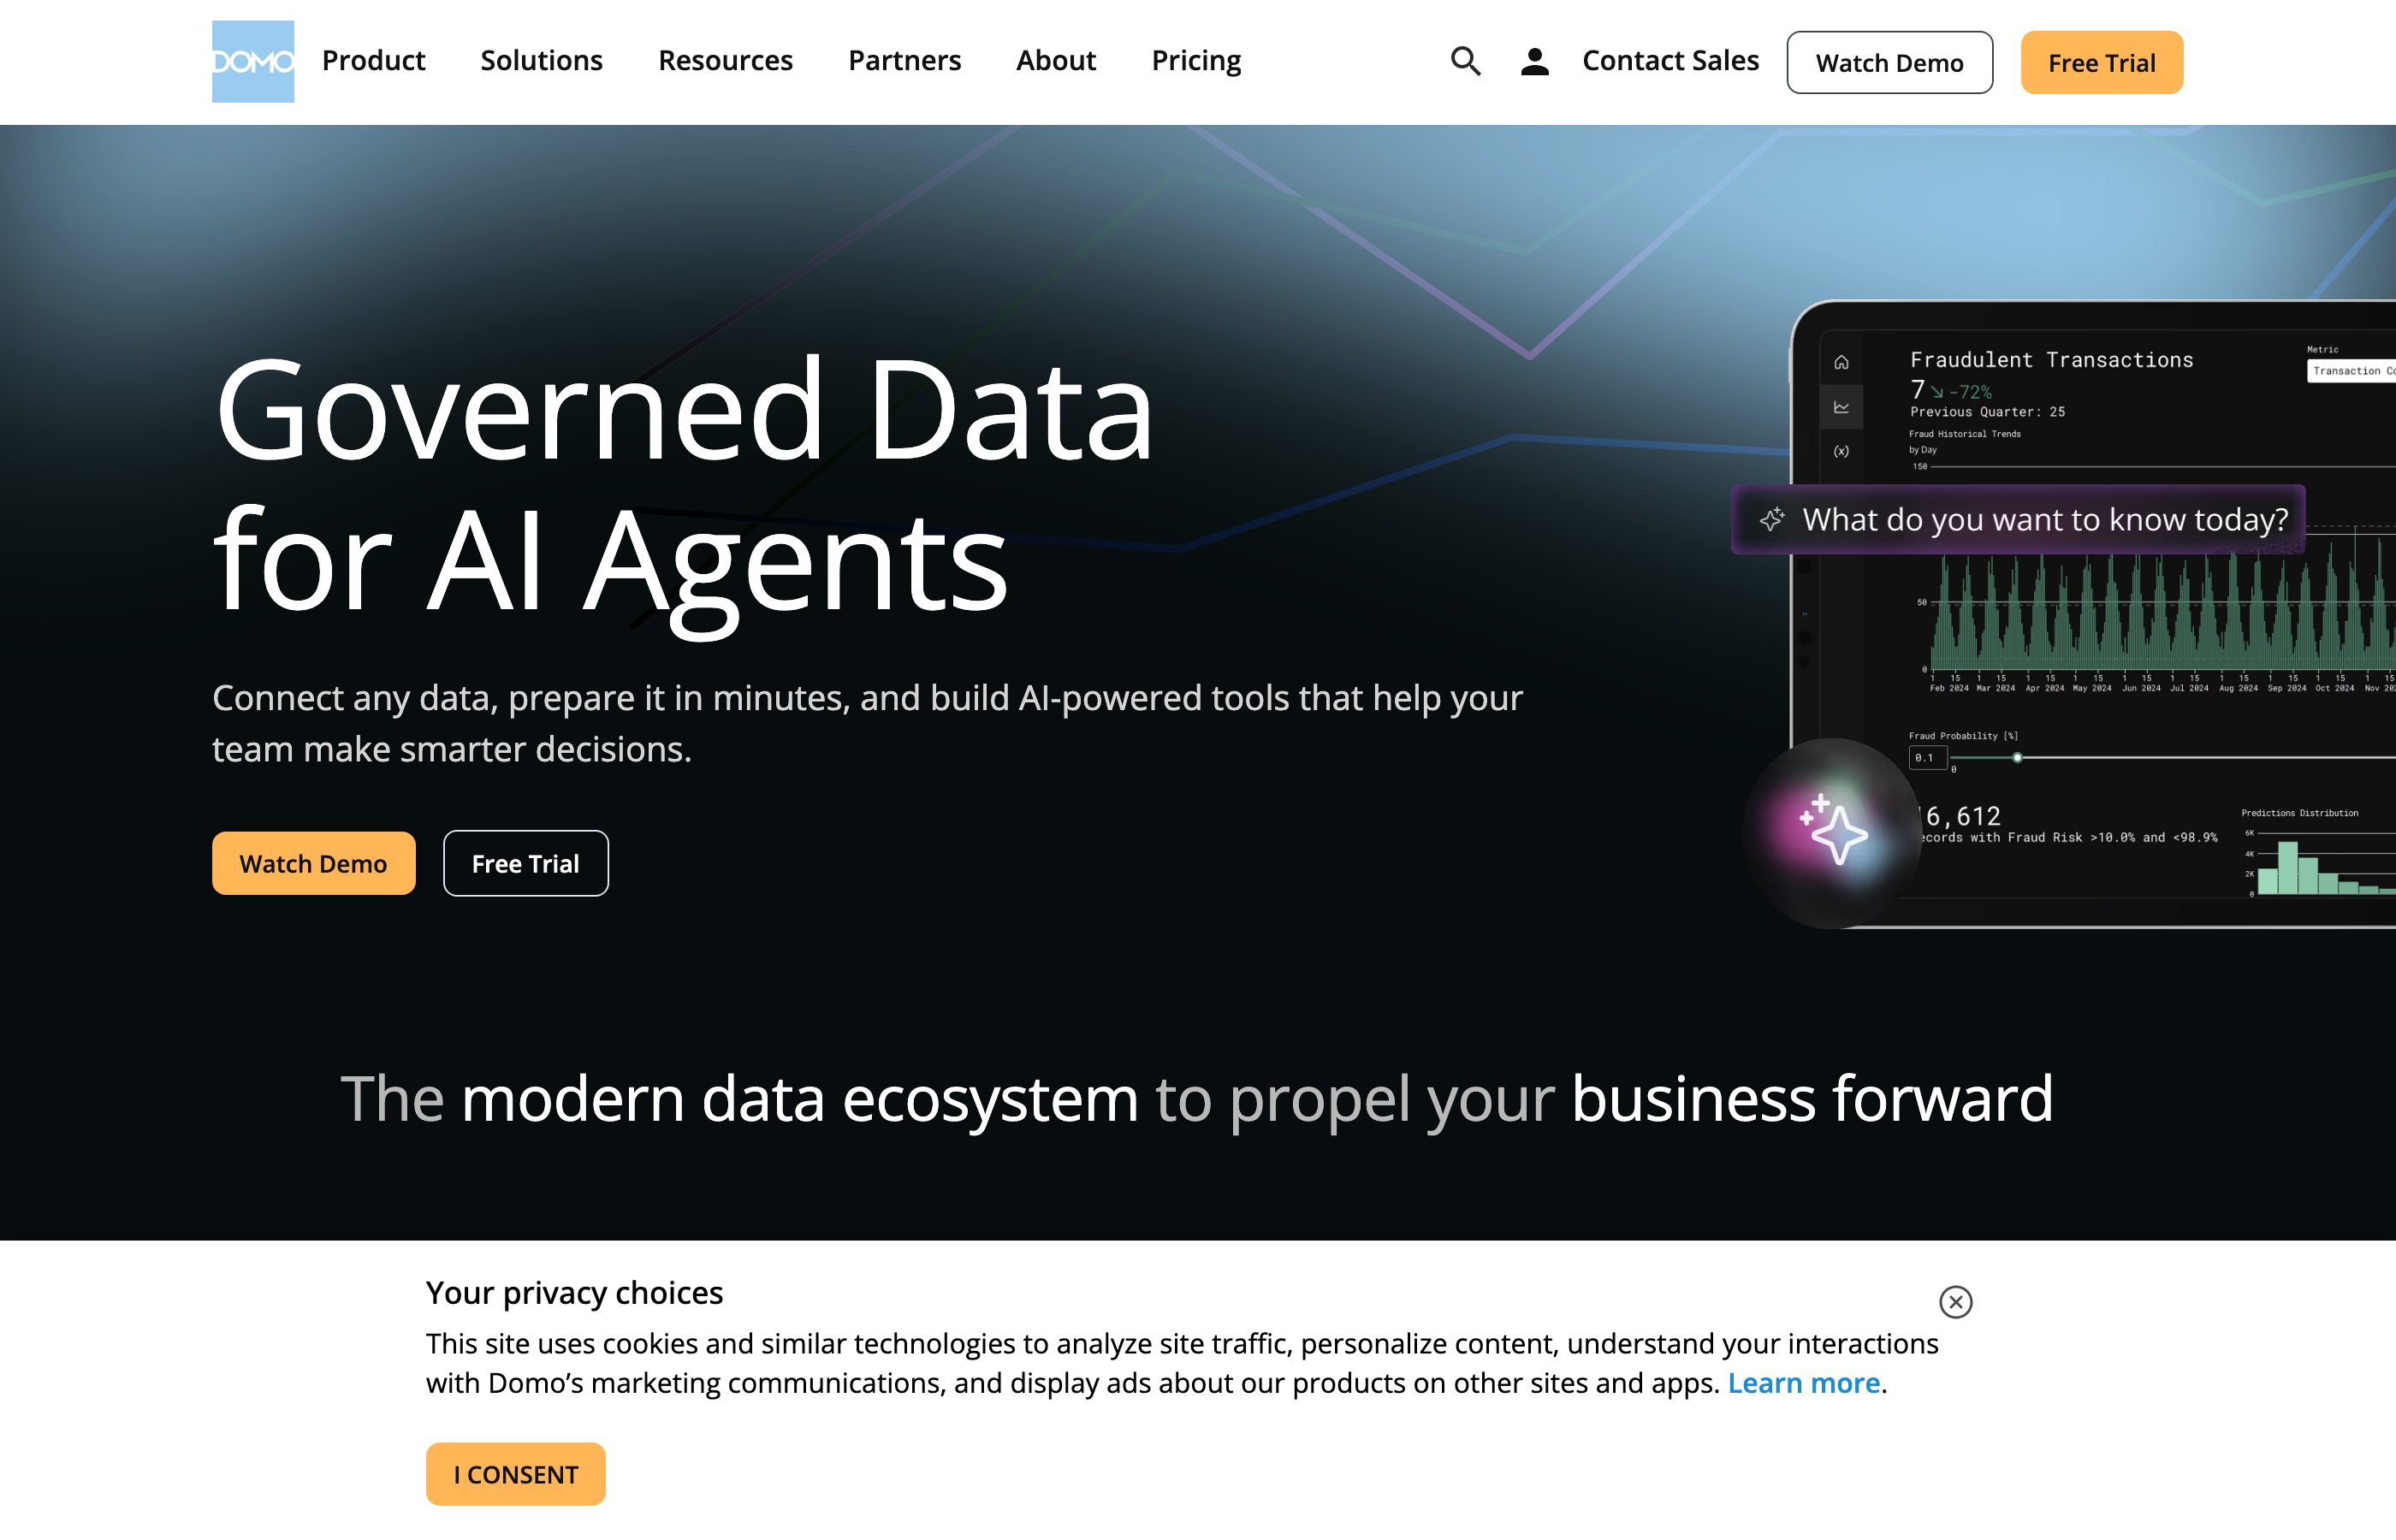
Domo Sage adds natural language query, automated anomaly detection, and predictive analytics to the platform. The AI can forecast future performance based on historical trends, identify outliers automatically, and answer conversational questions about your data. For marketing teams, Domo's strength is the connector library — it includes pre-built integrations for Google Ads, Facebook Ads, LinkedIn, most major ad platforms, and marketing automation tools.
Pre-Built Marketing Connectors
Domo's connector library includes direct integrations for most marketing platforms, reducing implementation time compared to warehouse-centric BI tools. The connectors handle API authentication, data extraction, and incremental updates automatically. However, connector quality varies — some are maintained by Domo, others by third parties, and some haven't been updated in years. Teams need to validate that connectors support the specific metrics and dimensions they require before committing.
Data transformation happens within Domo using Magic ETL, a visual data pipeline builder. Marketing teams can clean data, join sources, and create calculated fields without writing code. However, complex transformations become unwieldy in the visual interface, and the platform lacks the governance controls enterprises need for marketing-specific data quality rules.
Pricing and Feature Tiers
Domo's pricing is notoriously opaque, with significant cost variation based on features, user count, and data volume. The platform charges per user rather than per data volume, making it expensive for large marketing teams. Enterprise features like embedded analytics, white labeling, and advanced governance controls require higher-tier plans. Many teams discover hidden costs during implementation — additional charges for premium connectors, API calls above included limits, and support beyond basic tiers.
The platform works best for mid-market companies that need a broad connector library and aren't running at enterprise scale. Domo is less suitable for organizations with strict data governance requirements or teams that need marketing-specific attribution and data quality capabilities. Implementation typically takes 4–8 weeks for standard configurations.
Qlik Sense: Associative AI Analytics Engine
Qlik Sense is a business intelligence platform built on an associative data indexing engine that connects all data elements automatically. Unlike query-based BI tools that require predefined relationships, Qlik's associative engine indexes every possible relationship in your data, letting users explore freely without hitting dead ends. The platform now includes Qlik Insight Advisor, an AI feature that suggests visualizations, detects anomalies, and generates natural language insights.
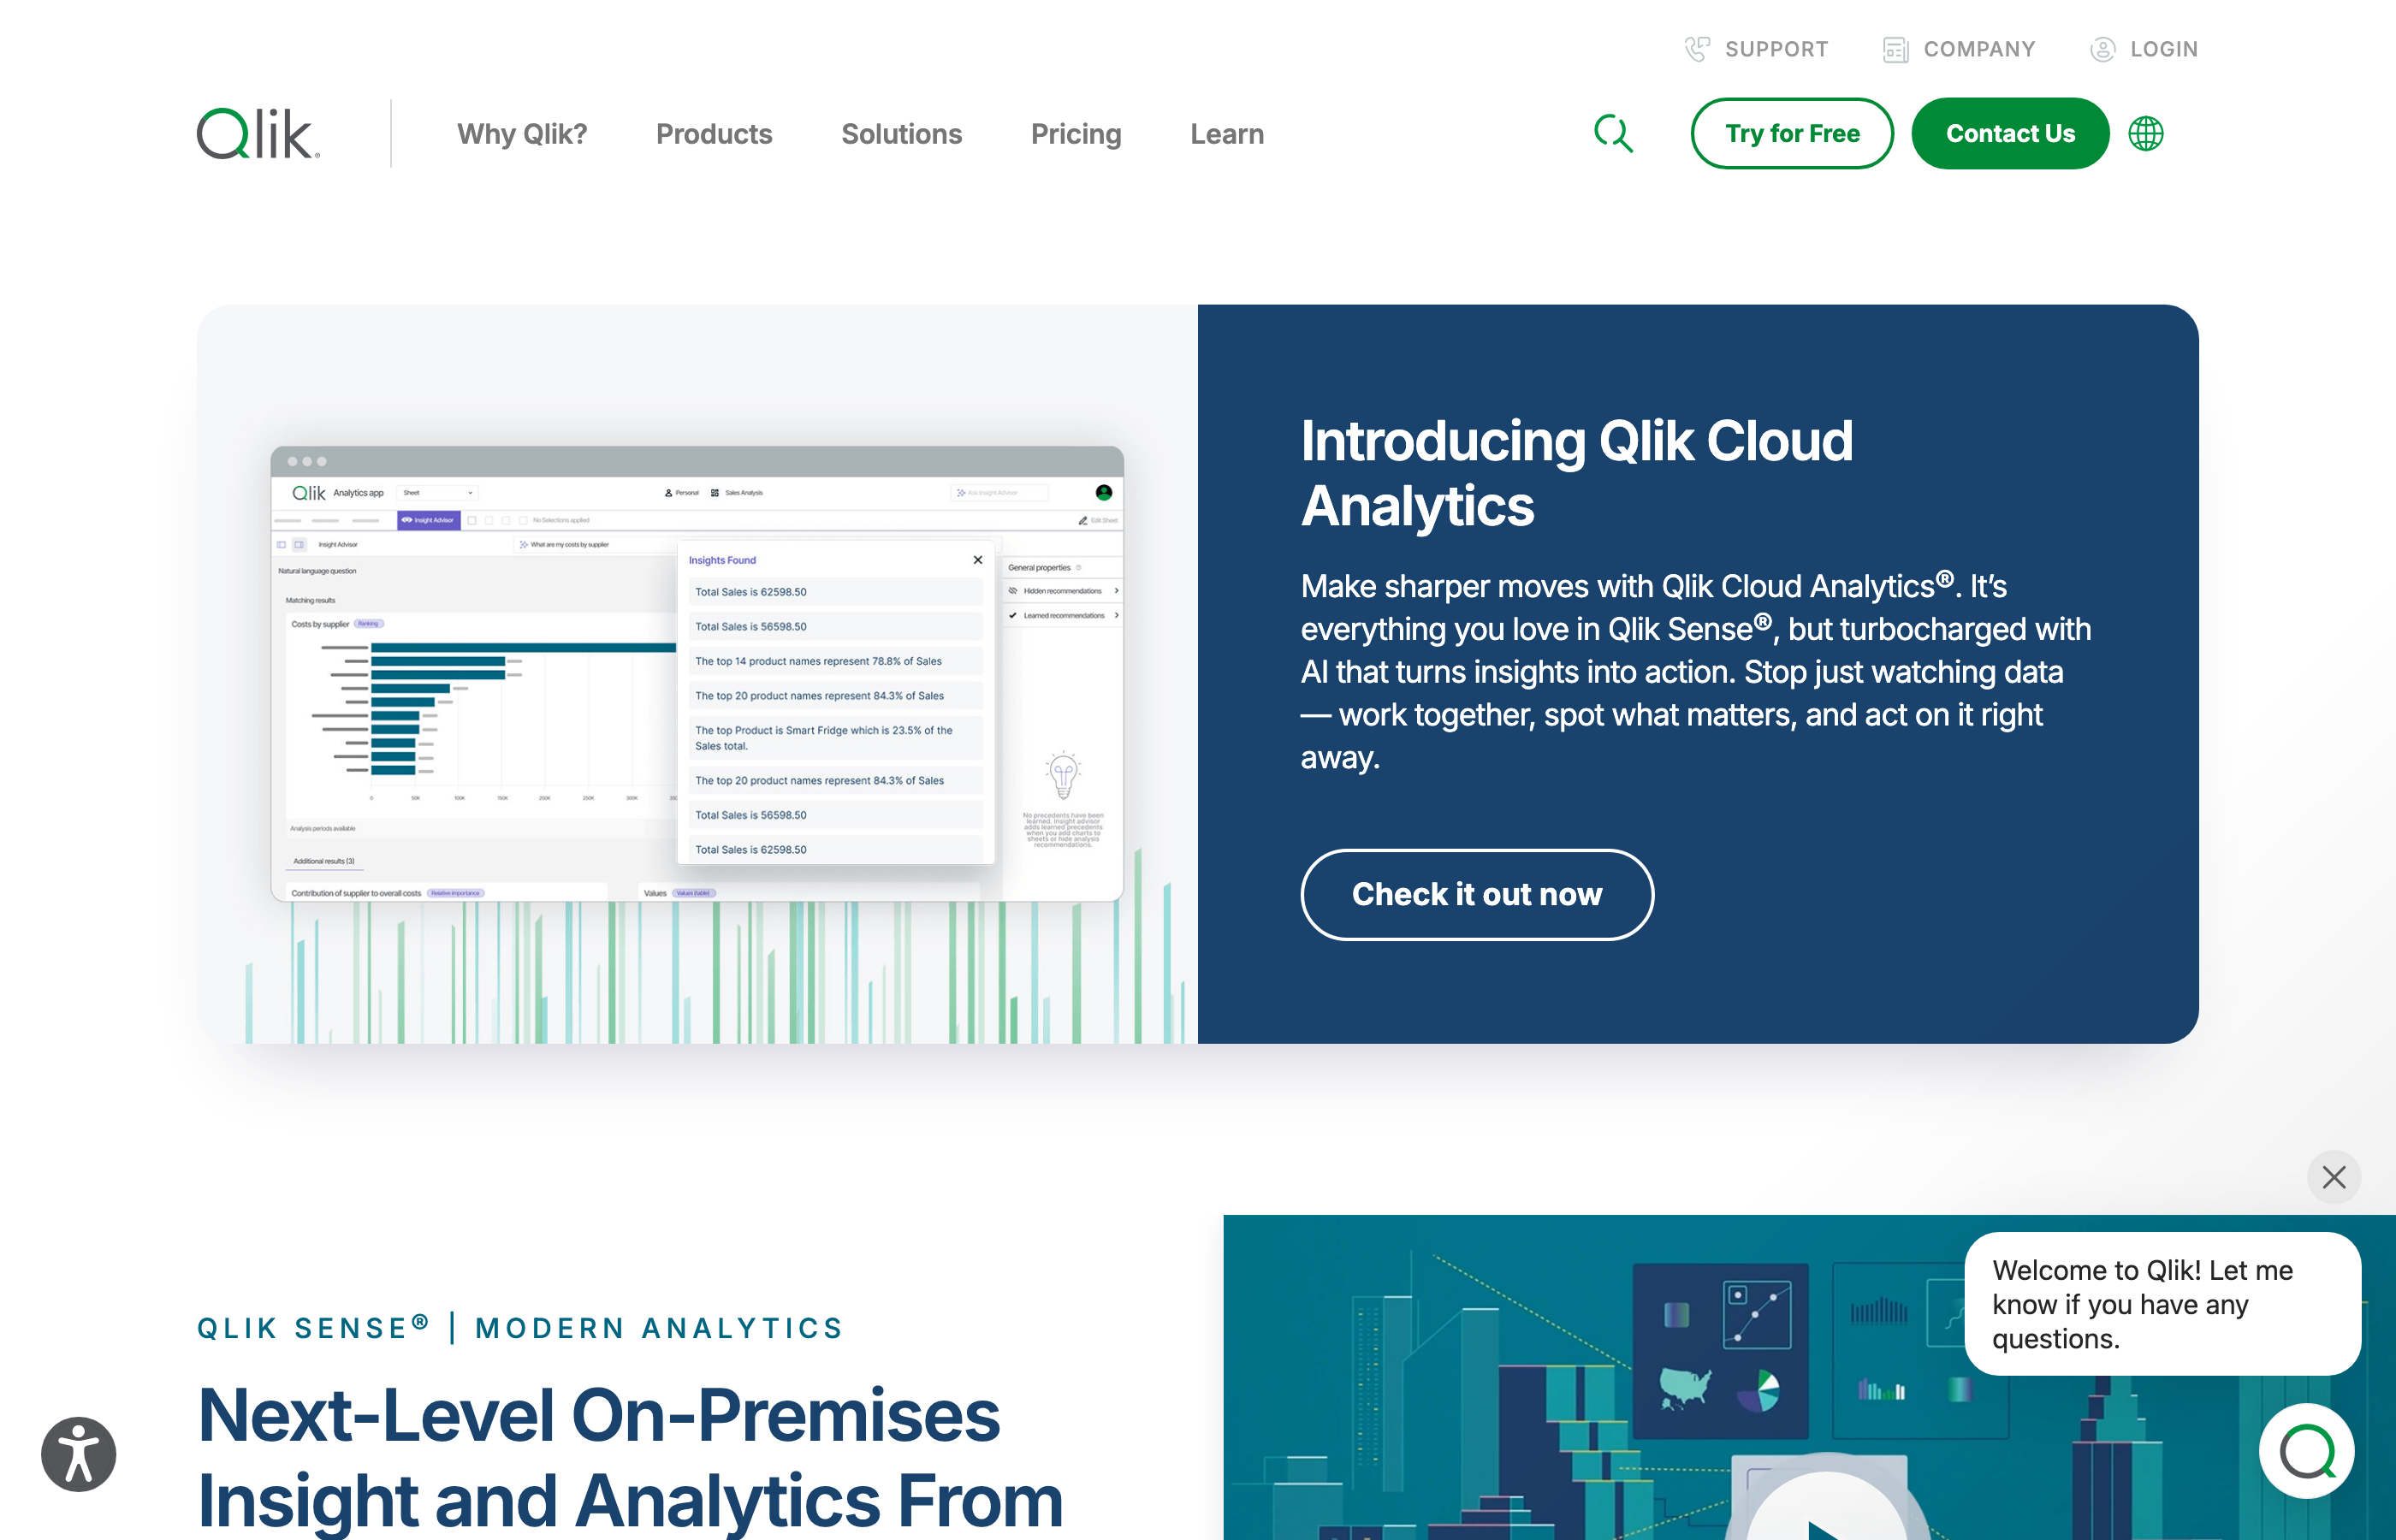
The associative engine's core advantage is exploratory analysis. When you select a filter or click a data point, Qlik instantly shows which other data is related, which is unrelated, and which is excluded. This makes it powerful for discovering unexpected patterns in marketing data — correlations between campaign attributes and conversion rates, seasonal patterns across channels, or segment behaviors that don't match assumptions.
Insight Advisor AI Features
Insight Advisor uses machine learning to recommend visualizations based on the data fields you select. Choose campaign name and conversion rate, and Insight Advisor suggests appropriate chart types, identifies outliers, and generates text summaries of key findings. The AI also performs automated regression analysis to identify which variables most strongly predict your target metrics.
However, Insight Advisor requires clean, well-structured data to generate useful recommendations. Marketing data is messy — inconsistent naming conventions, null values, duplicate records, and metrics that mean different things across platforms. Qlik doesn't include marketing-specific data preparation or governance, so teams spend significant time cleaning data before the AI features become valuable.
Cloud versus On-Premise Trade-offs
Qlik offers both cloud (Qlik Sense SaaS) and on-premise (Qlik Sense Enterprise) deployment options. The on-premise version appeals to enterprises with strict data residency requirements or existing on-premise infrastructure. However, on-premise deployments require IT resources to maintain servers, manage updates, and handle scaling as data volumes grow.
Marketing platform connectors are limited compared to specialized marketing analytics tools. Qlik connects efficiently to databases and data warehouses but requires third-party connectors or custom scripts for most advertising platforms. Implementation typically takes 3–6 months including data modeling and application development. Pricing is custom based on deployment type and user count, generally starting around $30 per user per month for cloud deployments with annual contracts.
Sisense: Embedded Analytics with AI Capabilities
Sisense is an analytics platform designed for embedding dashboards and analytics capabilities into other applications. The platform includes AI features like natural language query, automated anomaly detection, and predictive forecasting, but its primary use case is providing white-label analytics to customers or partners rather than internal marketing analysis.
For marketing teams, Sisense makes sense when you need to deliver analytics to external stakeholders — providing campaign performance dashboards to clients if you're an agency, or embedding marketing analytics into a SaaS product. The platform's APIs and embedding capabilities are more developer-friendly than most BI tools, making it easier to integrate dashboards into existing applications.
ElastiCube In-Memory Analytics
Sisense uses ElastiCube technology to load data into memory for fast query performance. This approach works well for datasets under a few hundred gigabytes but becomes expensive and complex as data volumes grow. Marketing teams running large-scale campaigns across dozens of platforms often exceed ElastiCube memory limits, requiring data aggregation or sampling that reduces analytical granularity.
The platform's AI features include natural language query through Sisense Chatbot and anomaly detection via Sisense Pulse. However, these capabilities lag behind competitors — the chatbot requires more explicit phrasing than conversational AI from Google or Microsoft, and anomaly detection relies on simple statistical thresholds rather than machine learning models that adapt to your data patterns.
Ideal Customer Profile
Sisense is best for software companies that need to embed analytics into their products, or agencies that deliver white-label reporting to clients. It's less suitable as a primary internal marketing analytics platform because it lacks marketing-specific connectors, data models, and governance capabilities. Implementation complexity is high — embedding analytics requires significant development work beyond just configuring dashboards.
Pricing is custom based on deployment size and whether you're embedding analytics externally or using it internally. The platform typically costs significantly more than general-purpose BI tools because licensing includes embedding rights and API access. Marketing platform connectivity requires third-party ETL tools to load data before Sisense can visualize it.
- →Your analysts spend 20+ hours weekly exporting CSVs and reconciling numbers across platforms instead of analyzing performance
- →You discover campaign budget overruns days after they happen because anomaly detection relies on manual dashboard checks
- →Cross-channel attribution is impossible because each platform reports conversions differently and no one has time to build unified models
- →New data sources take 3–6 weeks to connect because every integration requires custom engineering work and API maintenance
- →Campaign performance reports are out of date by the time stakeholders see them because data pipelines break frequently and take days to fix
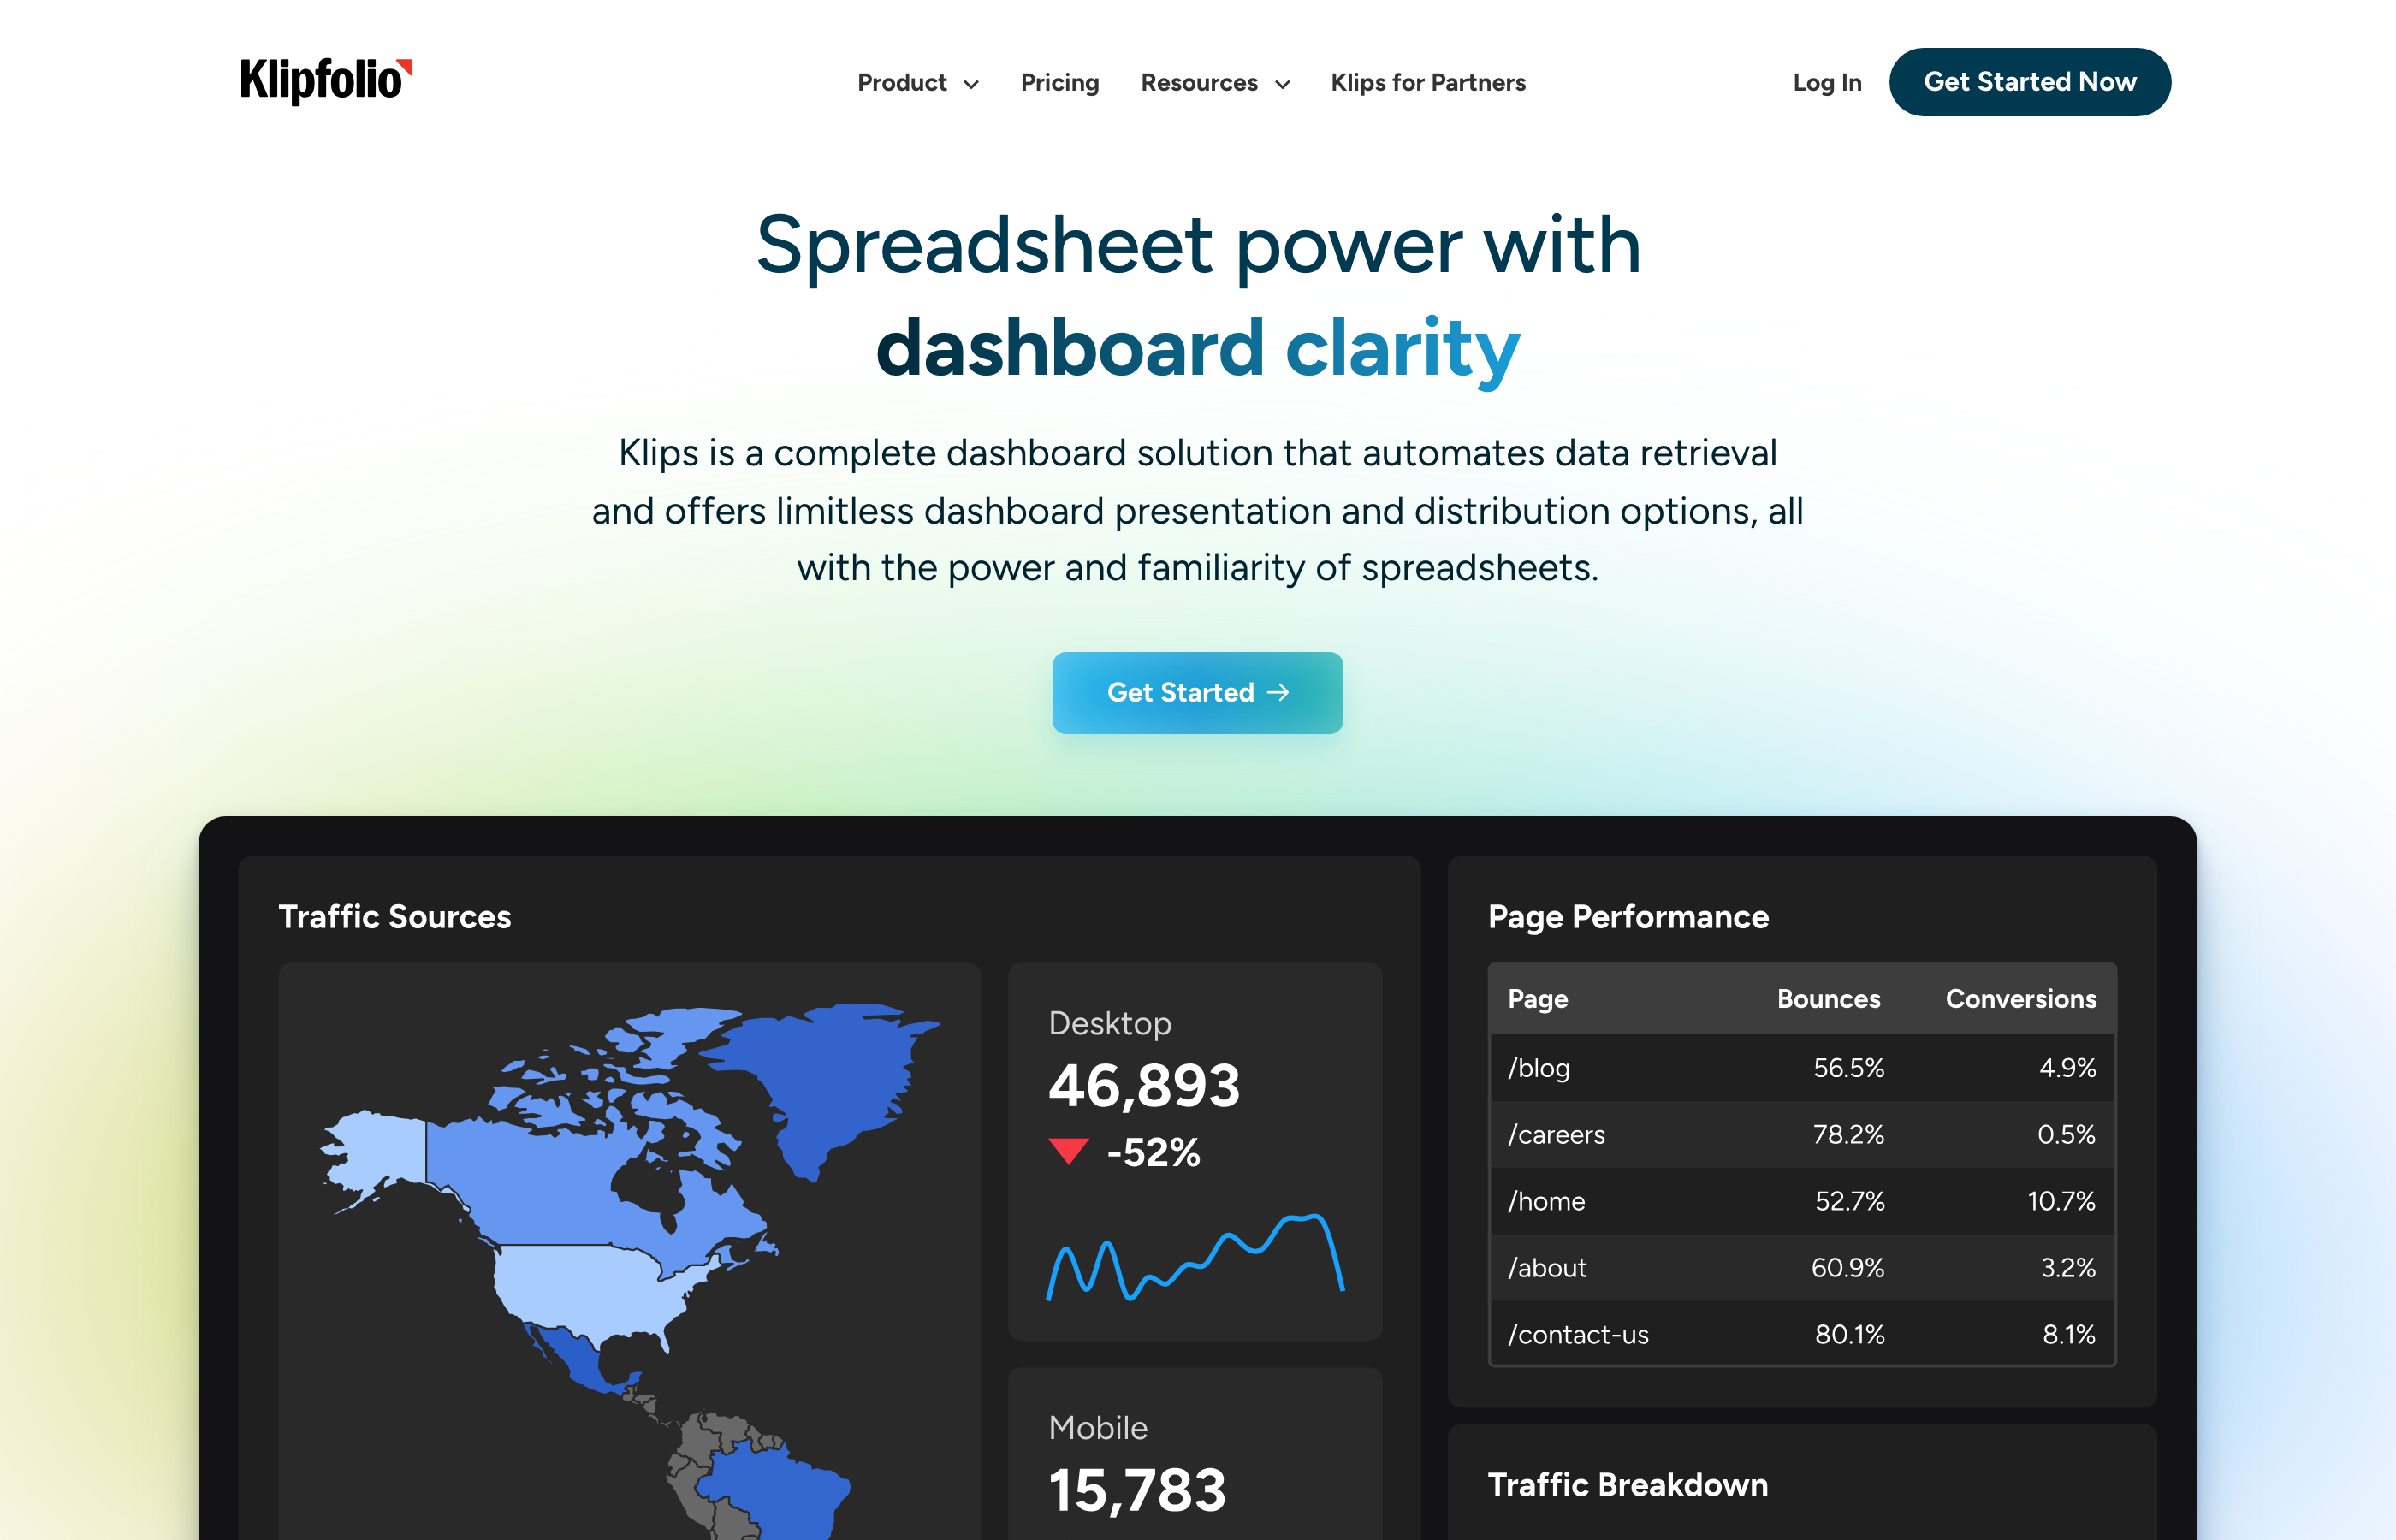
Klipfolio PowerMetrics: Pre-Built Marketing Dashboards
Klipfolio PowerMetrics is a dashboard platform with a library of pre-built templates for common marketing use cases. The platform includes AI-powered insights called Smart Metrics that automatically detect changes, calculate statistical significance, and alert users to anomalies. Klipfolio is positioned for mid-market companies that need to start analyzing marketing data quickly without extensive implementation projects.
The core appeal is speed to value. Klipfolio includes templates for Google Ads, Facebook Ads, LinkedIn, HubSpot, and other marketing platforms. Connect your accounts, and the platform populates dashboards automatically with standard metrics. For small marketing teams without dedicated analysts, this eliminates the blank-canvas problem of building dashboards from scratch.
Smart Metrics AI Features
Smart Metrics automatically tracks whether KPIs are trending up, down, or staying flat, calculates week-over-week and month-over-month changes, and flags statistically significant deviations. The system learns normal ranges for your metrics and alerts when values fall outside expected bounds. However, the anomaly detection is relatively basic — it uses statistical thresholds rather than machine learning models that account for seasonality, campaign cycles, or cross-channel interactions.
The platform lacks advanced AI capabilities like natural language query, predictive forecasting, or automated root-cause analysis. What it calls AI is mostly automated alerting with predefined rules. This is sufficient for basic monitoring but limiting when you need deeper analytical capabilities.
Data Volume and Transformation Constraints
Klipfolio works well for teams managing up to 20 data sources with straightforward reporting needs. Beyond that scale, the platform's data transformation capabilities become limiting. Complex calculations, custom attribution models, and cross-source data joins are difficult to implement. The platform also lacks governance features for enforcing data quality rules or managing metric definitions across teams.
Pricing starts at $90 per month for the PowerMetrics product with up to 10 users and 10 data sources. Higher tiers add more data sources, users, and historical data retention. The platform is cost-effective for small teams but doesn't scale economically for enterprises. Implementation is fast — most teams are operational within a few days — but customization options are limited compared to enterprise BI platforms.
GoodData: White-Label Analytics Platform
GoodData is an analytics platform designed for embedding dashboards into commercial applications and providing white-label analytics to customers. The platform includes AI-powered features like automated insight generation and anomaly detection, but its primary use case is multi-tenant analytics deployments where you need to isolate data and customize branding for different customer organizations.
For marketing teams, GoodData is relevant if you're building a marketing analytics product or need to provide customized dashboards to dozens of different client accounts with strict data isolation requirements. It's not designed as an internal marketing analytics tool — the platform's complexity and pricing model reflect its embedded analytics focus.
Multi-Tenant Architecture
GoodData's core strength is managing analytics for multiple organizations from a single deployment. The platform handles data isolation automatically, ensuring customers can't access each other's data, while letting you manage all analytics logic centrally. This architecture matters for agencies managing dozens of client accounts or SaaS companies providing analytics to thousands of customers.
The AI capabilities include automated insight generation that identifies trends, anomalies, and correlations in each tenant's data. However, the AI features are less sophisticated than standalone BI platforms because they need to operate efficiently across thousands of simultaneous tenants with varying data volumes and schemas.
Development Requirements
GoodData requires significant development work to implement. The platform is built for engineers, not business users — you define analytics logic in code, manage deployments through APIs, and embed dashboards using JavaScript SDKs. Marketing teams need dedicated engineering resources to build and maintain GoodData implementations.
Marketing platform connectors are minimal. GoodData connects to data warehouses efficiently but lacks pre-built integrations for advertising platforms. Teams need separate ETL tools to load marketing data before GoodData can analyze it. Pricing is custom based on tenant count, data volume, and feature requirements, typically starting around $1,000 per month for small deployments. The platform is best suited for software companies building analytics products, not marketing departments analyzing internal campaigns.
Dundas BI: On-Premise AI Analytics
Dundas BI is a business intelligence platform with a strong on-premise deployment option and comprehensive customization capabilities. The platform includes AI features like automated anomaly detection and natural language query, but its primary differentiator is the ability to run entirely on customer infrastructure without cloud dependencies. This matters for enterprises with strict data residency requirements or industries where cloud deployment is prohibited by regulation.
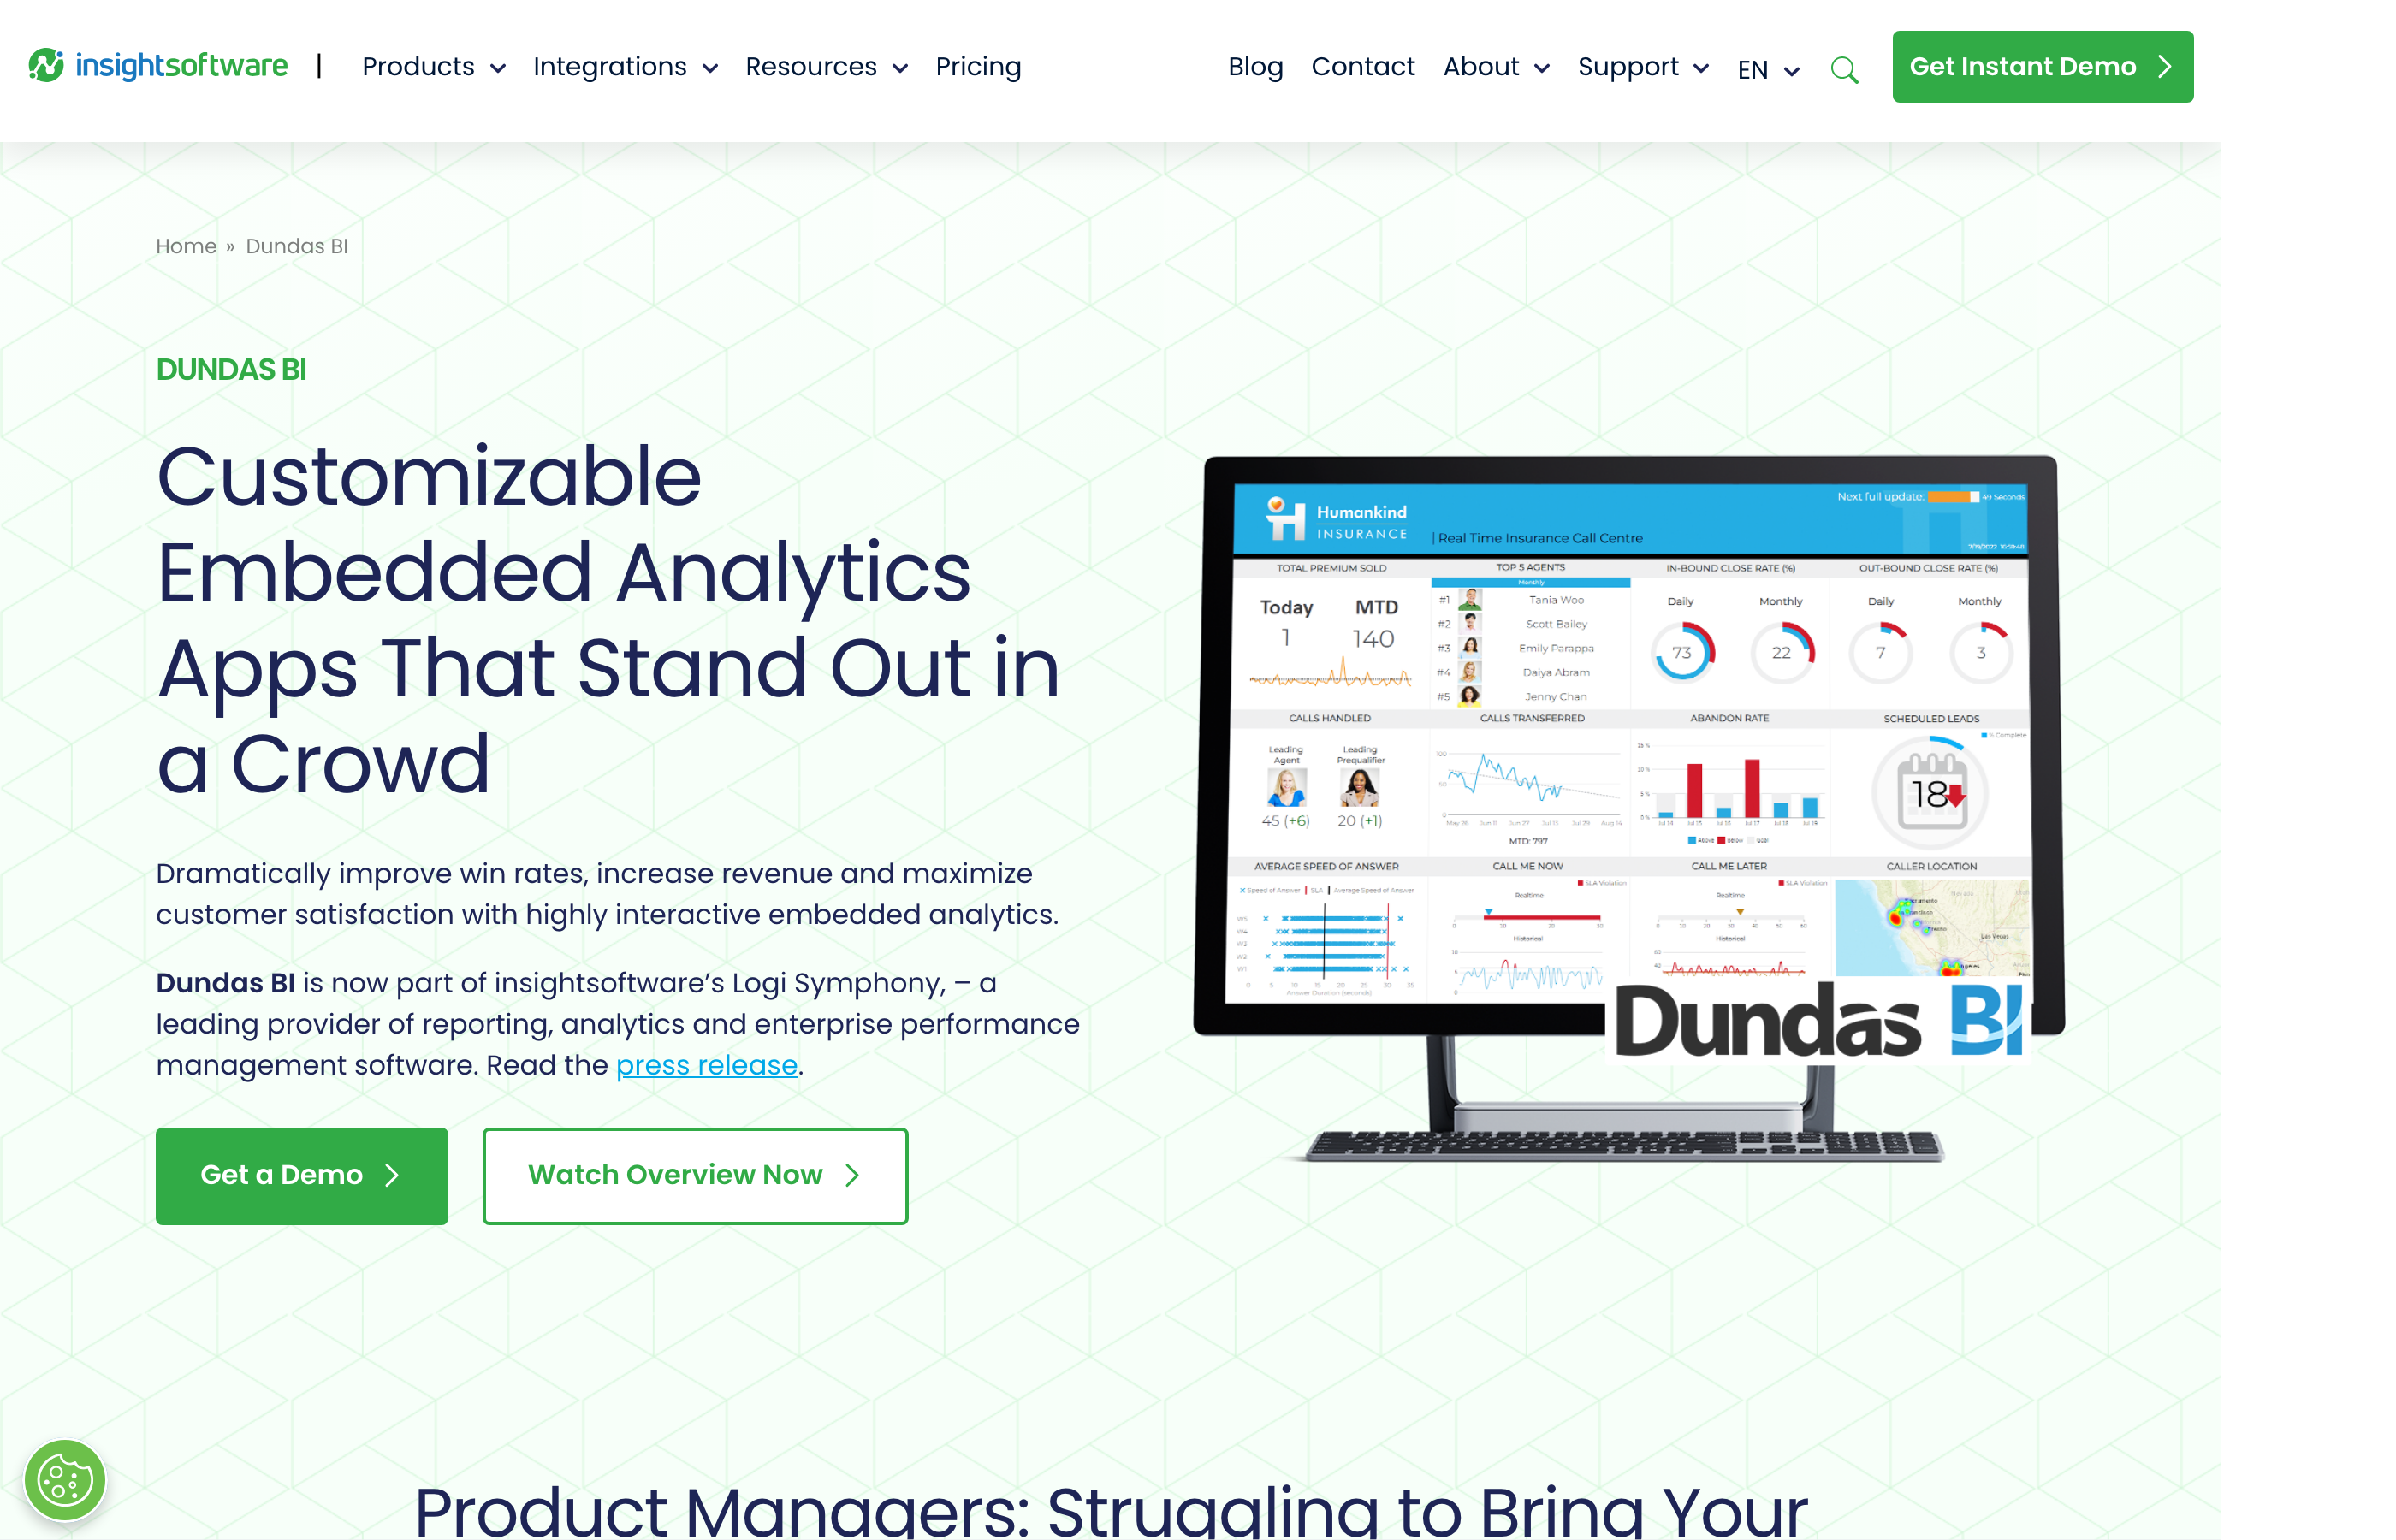
For marketing teams, Dundas is relevant if your organization has policies against cloud BI tools or operates in regulated industries like healthcare or financial services where data governance requirements mandate on-premise systems. The platform offers flexibility to customize every aspect of dashboards and analytics workflows, but this flexibility comes with implementation complexity.
Complete Visual Customization
Dundas provides granular control over dashboard design, letting teams build custom visualizations, interactive components, and branded analytics experiences. This level of customization appeals to enterprises with specific UX requirements or agencies that need to deliver white-label analytics with client branding. However, building highly customized dashboards requires development skills — business users can't create complex analytics without technical support.
The AI capabilities include predictive analytics that forecast future values based on historical trends and anomaly detection that identifies statistical outliers. These features work but are less sophisticated than AI from cloud-native platforms that leverage massive training datasets and continuous model updates.
On-Premise Operational Costs
On-premise deployment means your IT team manages servers, applies updates, handles scaling, and ensures uptime. This operational overhead is significant — you need dedicated resources for infrastructure management on top of the analytics platform itself. Cloud deployment is available but reduces Dundas's core advantage over cloud-first competitors.
Marketing platform connectors are limited. Dundas connects to databases and enterprise systems efficiently but lacks pre-built integrations for most advertising platforms. Implementation typically takes 3–6 months including infrastructure setup, data modeling, and dashboard development. Pricing is custom based on deployment size and user count, with perpetual licensing options for on-premise deployments.
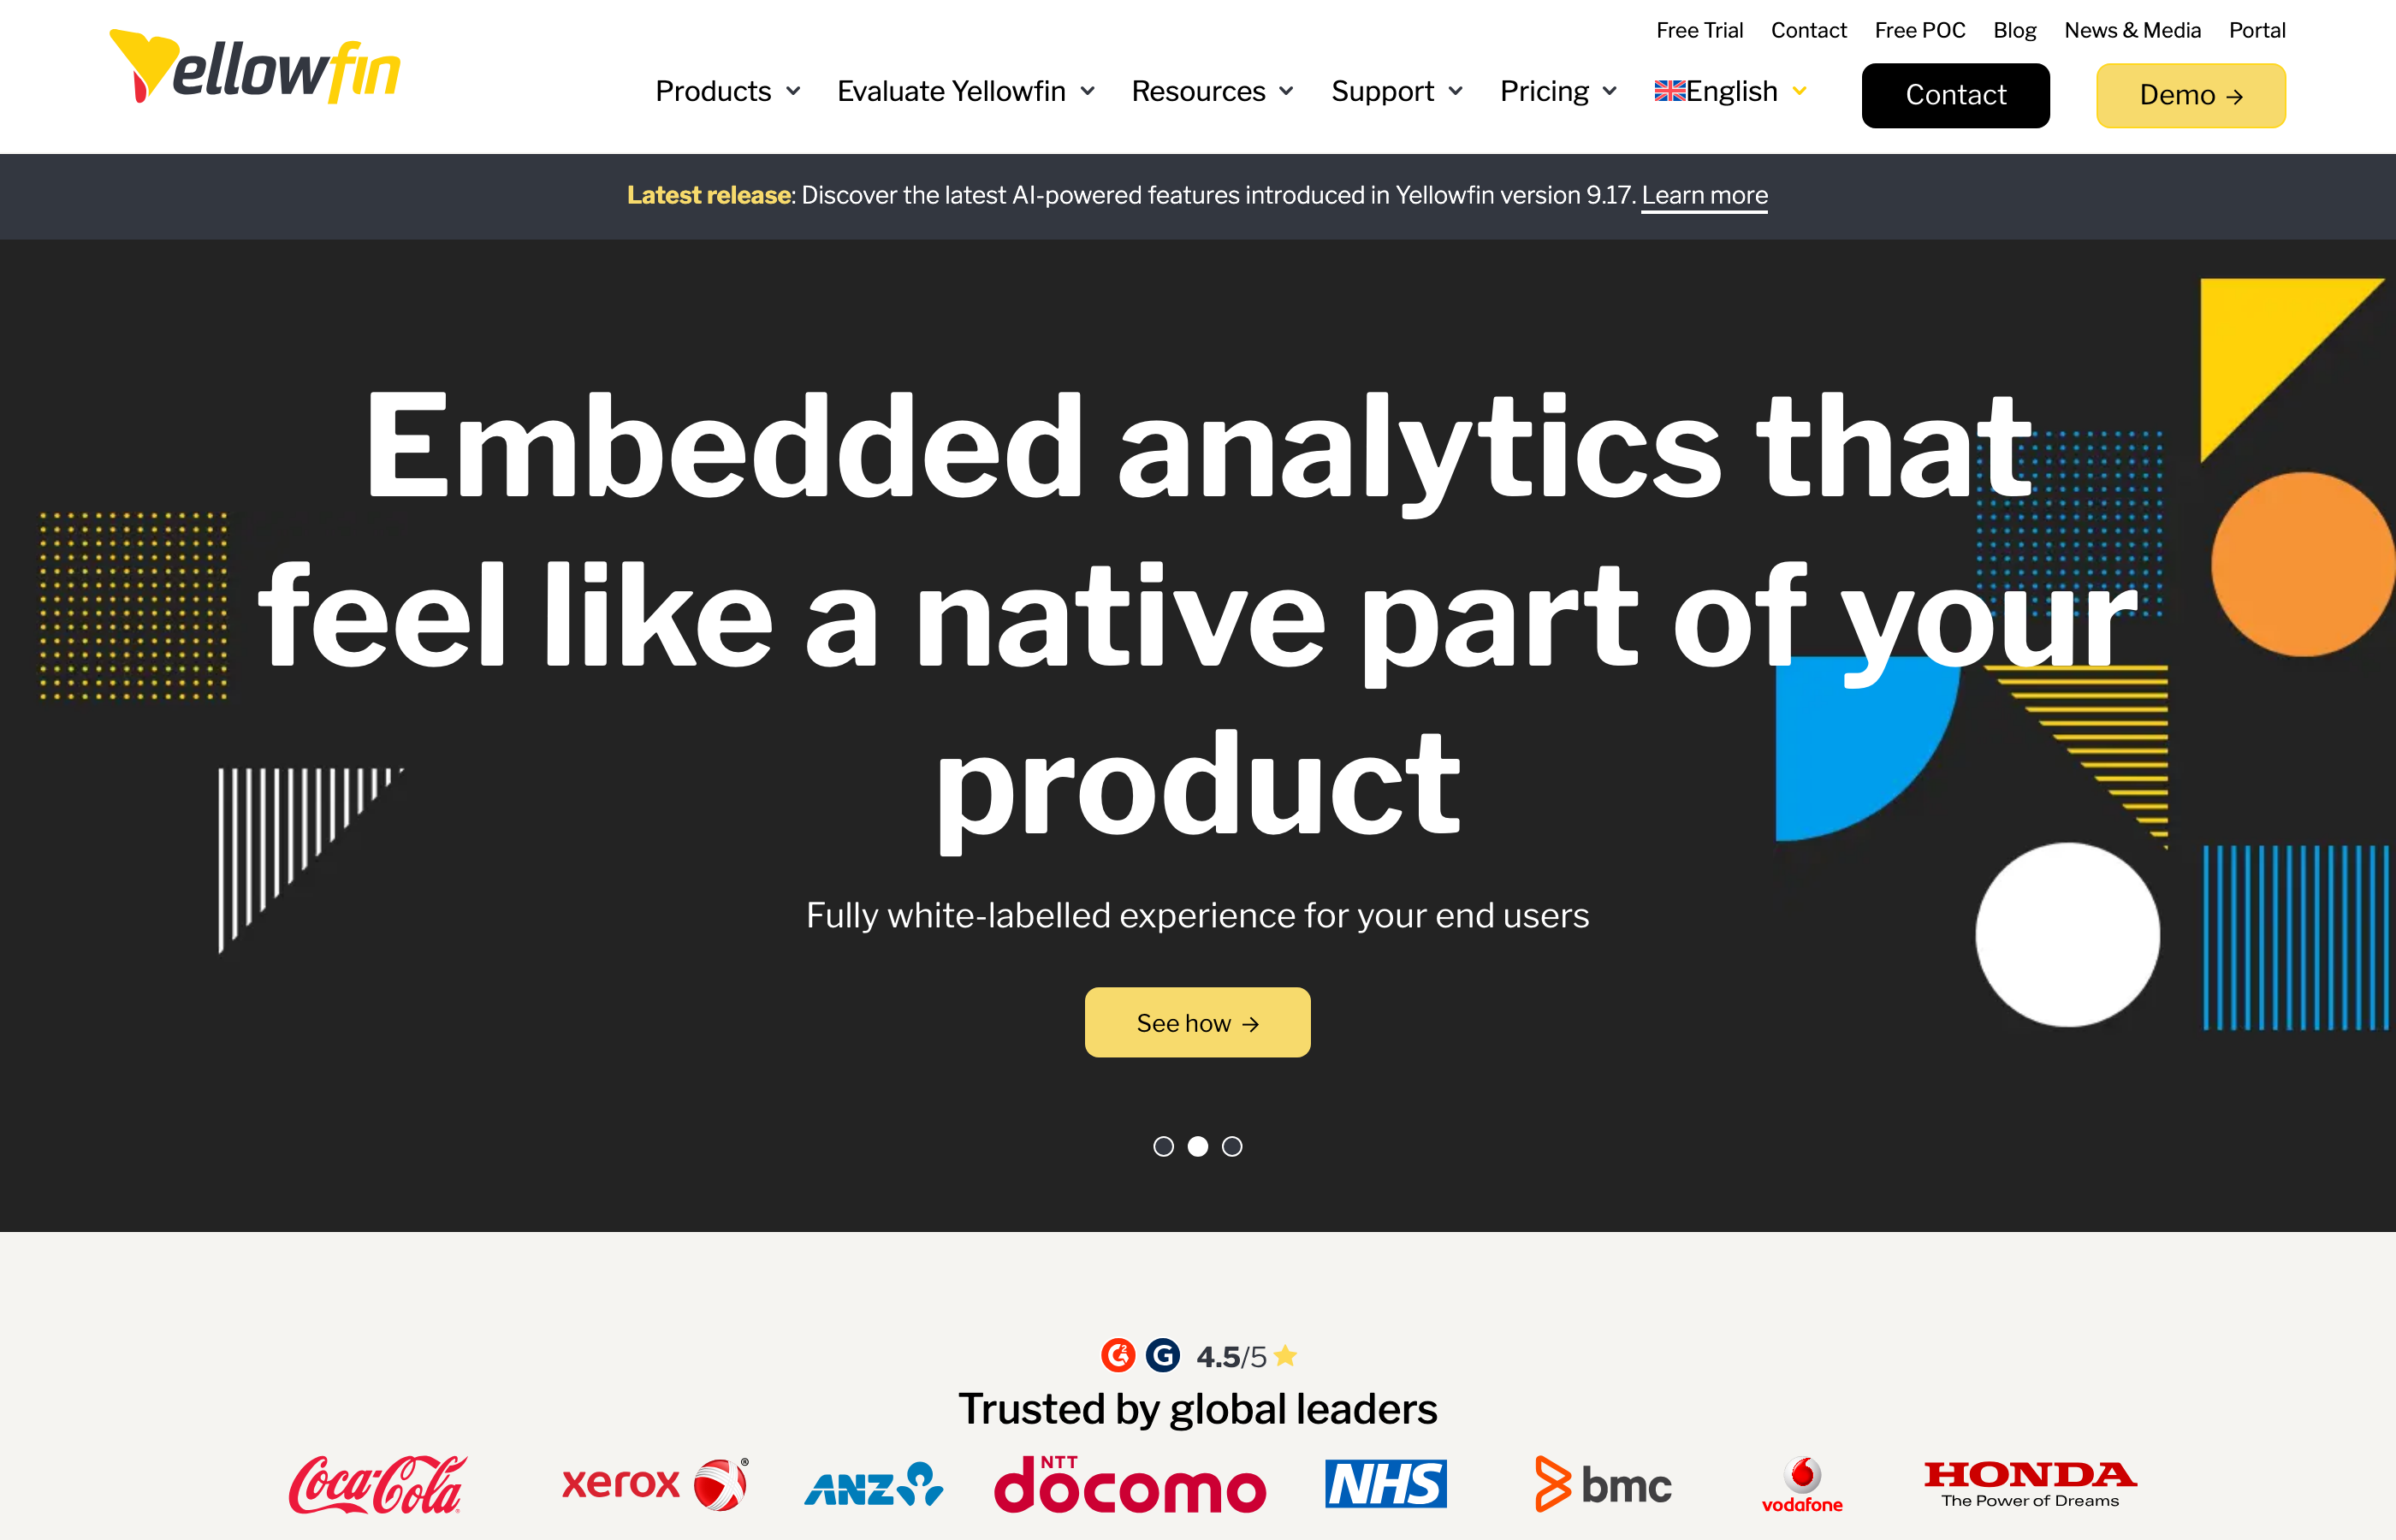
Yellowfin: Collaborative Analytics with Stories
Yellowfin is a business intelligence platform emphasizing collaboration and narrative-driven analytics. The platform includes AI features called Assisted Insights that automatically generate text explanations of data patterns, detect anomalies, and suggest follow-up questions. Yellowfin's differentiator is the Stories feature, which lets users create guided analytical narratives that combine data, visualizations, and annotations into shareable presentations.
For marketing teams, Yellowfin works well when analytics needs to be communicated across departments — building narratives that explain campaign performance to executives, documenting analytical findings for future reference, or creating guided tours of dashboards for new team members. The platform makes it easier to share context and insights beyond just displaying charts.
Stories Feature for Narrative Analytics
Stories is Yellowfin's collaborative analytics feature that lets users create slide-like presentations combining live data, visualizations, annotations, and commentary. Unlike static PowerPoint reports, Stories update automatically as underlying data changes. This bridges the gap between dashboards (which show current state but lack context) and slide decks (which provide context but become outdated immediately).
Marketing teams use Stories to document campaign analyses, build monthly performance reviews, and create analytical templates that guide users through complex metrics. However, creating effective Stories requires time investment — they're more valuable than simple dashboards but take longer to build and maintain.
Assisted Insights Capabilities
Assisted Insights automatically generates text descriptions of data patterns, identifies outliers, and suggests interesting comparisons. The system runs in the background, surfacing insights as you explore dashboards. However, the AI capabilities are less advanced than competitors — Yellowfin's natural language query requires more structured phrasing than conversational AI from Google or Microsoft, and anomaly detection uses statistical rules rather than adaptive machine learning.
Marketing platform connectivity is limited. Yellowfin includes some pre-built connectors through its marketplace, but coverage is sparse compared to specialized marketing analytics tools. Teams typically need third-party ETL tools to load data from advertising platforms before Yellowfin can visualize it. Implementation takes 2–4 months including data integration, dashboard development, and user training. Pricing is custom based on user count and deployment size, typically starting around $50 per user per month with annual contracts.
AI Dashboard Comparison Table
| Platform | Best For | AI Capabilities | Marketing Connectors | Implementation Time | Starting Price |
|---|---|---|---|---|---|
| Improvado | Enterprises with 1,000+ data sources, agencies managing client reporting | Conversational AI Agent, anomaly detection, 250+ data quality rules, pre-launch budget validation | 1,000+ native connectors including all major ad platforms, CRMs, and marketing automation tools | Typically operational within a week | Custom pricing |
| Tableau with Einstein | Large enterprises with Salesforce deployments and dedicated BI teams | Anomaly detection, natural language query via Tableau Pulse, predictive analytics | Limited; requires third-party connectors for most ad platforms | 2–4 months | ~$70/user/month |
| Power BI with Copilot | Organizations standardized on Microsoft ecosystem | Natural language query, anomaly detection, automated narrative generation | Some via AppSource; many require custom development | 1–3 months | $10/user/month + Fabric licensing |
| Looker with Gemini | BigQuery-first organizations with dedicated analytics engineering teams | Conversational query, SQL generation from natural language, automated insight generation | Requires ETL to load data into BigQuery first | 3–6 months | ~$3,000/month minimum |
| ThoughtSpot | Enterprises with existing data warehouses and search-first user preferences | Search-driven query, SpotIQ automated insights, natural language processing | Limited; connects to warehouses, not directly to ad platforms | 2–4 months | Custom pricing |
| Domo | Mid-market companies needing broad connector library | Domo Sage natural language query, anomaly detection, predictive forecasting | 1,000+ pre-built connectors including many marketing platforms | 4–8 weeks | Custom pricing, per-user model |
| Qlik Sense | Organizations needing exploratory analysis and associative discovery | Insight Advisor recommendations, anomaly detection, automated regression analysis | Limited; requires third-party connectors for ad platforms | 3–6 months | ~$30/user/month cloud |
| Sisense | Software companies embedding analytics into products | Natural language chatbot, anomaly detection via Sisense Pulse | Limited; requires ETL for marketing data | 3–6 months | Custom pricing, embedding premium |
| Klipfolio PowerMetrics | Small to mid-market teams needing quick setup | Smart Metrics automated alerting, basic anomaly detection | Pre-built templates for major marketing platforms | Days | $90/month for 10 users |
| GoodData | SaaS companies providing white-label analytics to customers | Automated insight generation, anomaly detection across tenants | Minimal; designed for warehouse connectivity | 2–4 months | ~$1,000/month minimum |
| Dundas BI | Enterprises with on-premise deployment requirements | Predictive analytics, anomaly detection, basic natural language query | Limited; focus on database and enterprise system connectivity | 3–6 months | Custom pricing, perpetual licensing available |
| Yellowfin | Teams prioritizing collaborative analytics and narrative storytelling | Assisted Insights text generation, anomaly detection, guided discovery | Some via marketplace; sparse coverage of ad platforms | 2–4 months | ~$50/user/month |
How Do You Get Started with AI Dashboards?
Getting started with an AI dashboard means auditing every marketing data source, defining 10-15 specific analytical questions the tool must answer, assessing data quality, running a proof of concept on real campaign data, calculating total cost of ownership, and preparing the team to interpret automated insights. Each step reduces implementation risk before you sign a contract.
Audit your current data sources. List every platform where marketing data lives — advertising platforms, analytics tools, CRMs, marketing automation systems, attribution tools, and any custom databases. Document the metrics you need from each source and how frequently data needs to refresh. This inventory determines which platforms have sufficient connector coverage for your needs. If you're running campaigns across 30+ platforms, you need a solution with comprehensive connector libraries, not a general-purpose BI tool that requires custom integration work for each source.
Define your analytical use cases. Be specific about what questions the AI dashboard needs to answer. "We need better reporting" is too vague. "We need to detect when campaign cost-per-acquisition increases more than 20% week-over-week and identify which creative variants are underperforming" is actionable. Document 10–15 specific analytical questions your team asks regularly. This list determines which AI features actually matter — if you need predictive forecasting, anomaly detection matters more than natural language query.
Assess your data quality. AI features only work with clean data. Run a data quality audit before evaluating platforms. Check what percentage of your campaigns have proper UTM parameters, whether conversion tracking is consistent across channels, if you have duplicate transaction records, and whether your customer IDs match between systems. If data quality issues are widespread, prioritize platforms with built-in data governance and cleaning capabilities over those with the fanciest AI features.
Run a proof of concept with real data. Don't evaluate AI dashboards based on vendor demos with sample data. Insist on POCs using your actual campaigns, real metrics, and genuine data quality issues. Test the AI features with questions your team actually asks. Check if anomaly detection flags the same issues your analysts spot manually. Verify that natural language query understands marketing terminology specific to your industry. Many AI capabilities look impressive in controlled demos but fail with messy real-world marketing data.
Calculate total cost of ownership. AI dashboard costs include more than platform licensing. Factor in: connector maintenance fees, data transformation work if the platform lacks marketing-specific data models, BI tool licenses if the platform requires separate visualization tools, implementation services to configure dashboards and train users, and ongoing support beyond basic tiers. The cheapest platform often becomes the most expensive when you account for engineering time building custom integrations and maintaining data pipelines.
Plan for organizational change. AI dashboards shift analytical workflows from manual to automated. Your team needs training not just on how to use the platform but on how to interpret AI-generated insights, when to trust anomaly detection alerts versus investigating manually, and how to maintain data quality standards that keep the AI accurate. Budget time for change management, not just technical implementation.
Conclusion
AI dashboards eliminate the manual work that consumes 80% of marketing analysts' time — exporting data, reconciling discrepancies, building reports, and investigating anomalies by hand. The best platforms detect problems automatically, answer analytical questions conversationally, and surface insights that would take days to find through manual exploration. But AI capabilities only deliver value when built on clean, complete data from all your marketing platforms.
The right AI dashboard depends on your organization's scale, technical resources, and data complexity. General-purpose BI tools like Tableau, Power BI, and Looker offer powerful AI features but require months of implementation and custom connector development for marketing platforms. Specialized marketing analytics platforms like Improvado include marketing-specific data models, governance rules, and 1,000+ native connectors, reducing implementation from months to weeks. Mid-market options like Domo and Klipfolio offer faster setup but lack the governance capabilities enterprises need for marketing data at scale.
Before committing to a platform, run a proof of concept with your actual data. Test whether the AI detects the same anomalies your analysts spot manually. Verify that natural language query understands your marketing terminology. Calculate total cost of ownership including connector maintenance, implementation services, and engineering time for custom integrations. The AI dashboard that looks best in vendor demos often isn't the one that works best with messy, real-world marketing data.
Frequently Asked Questions
What is an AI dashboard?
An AI dashboard is a data visualization platform that uses machine learning to automatically detect anomalies, predict outcomes, and answer analytical questions in natural language. Unlike traditional dashboards that display metrics you configure manually, AI dashboards actively monitor data, identify patterns, and alert you to statistically significant changes without human intervention. For marketing teams, this means the system flags campaign performance issues automatically, forecasts future results based on historical patterns, and surfaces correlations between marketing activities and revenue outcomes that would take analysts days to discover manually.
How do AI dashboards differ from traditional BI tools?
Traditional BI tools require users to build queries, configure visualizations, and manually investigate anomalies. AI dashboards automate these tasks — they detect outliers without predefined rules, generate visualizations from natural language questions, and recommend next-best analyses based on what you're viewing. The core difference is proactive versus reactive: traditional dashboards show what you ask them to display, while AI dashboards surface insights you didn't know to look for. However, AI dashboards still require clean, well-structured data to function effectively. The AI doesn't fix data quality problems; it surfaces patterns in the data it receives.
How long does it take to implement an AI dashboard?
Implementation time ranges from days to months depending on platform complexity and your data infrastructure. Marketing-specific platforms with pre-built connectors like Improvado or Klipfolio can be operational within a week because they handle data integration automatically. Enterprise BI platforms like Tableau, Looker, or ThoughtSpot typically require 3–6 months because they need data warehouse setup, semantic layer configuration, and custom connector development for marketing platforms. The key variable is connector coverage — platforms that connect directly to your advertising and marketing automation tools eliminate months of custom integration work.
What data quality requirements do AI dashboards have?
AI dashboards require consistent, complete data to generate accurate insights. Anomaly detection fails if your baseline data has gaps or inconsistencies. Natural language query struggles when field names are cryptic or metrics are calculated differently across sources. Predictive analytics produces unreliable forecasts when historical data contains errors. Before implementing an AI dashboard, audit your data for common issues: missing UTM parameters, inconsistent campaign naming conventions, duplicate transaction records, incomplete conversion tracking, and customer IDs that don't match between systems. Marketing-specific platforms like Improvado include data governance features that validate and clean data automatically, while general-purpose BI tools require manual data preparation.
Why does marketing platform connector coverage matter?
Every marketing platform you need to analyze — Google Ads, Meta, LinkedIn, TikTok, Salesforce, HubSpot, GA4 — requires a connector that extracts data via API and loads it into your analytics system. Building custom connectors takes weeks of engineering time per platform, and maintaining them as APIs change adds ongoing operational overhead. Platforms with 1,000+ pre-built connectors eliminate this work. The connector needs to support all the metrics and dimensions you require, not just basic data — many low-quality connectors provide only summary statistics, forcing you to build supplementary data pipelines for granular analysis. Connector quality directly determines implementation speed and total cost of ownership.
How accurate is natural language query in AI dashboards?
Natural language query accuracy varies dramatically between platforms and depends heavily on how well the semantic layer is configured. Systems like ThoughtSpot and Power BI Copilot interpret conversational questions reasonably well when your data model defines clear relationships, synonyms, and business terms. However, they struggle with ambiguous queries, marketing-specific jargon, or questions that require complex multi-step logic. Most natural language interfaces work best with explicit phrasing — "show me cost per acquisition by campaign for the last 30 days" works better than "how are my campaigns performing?" Test natural language features during proof-of-concept evaluations with questions your team actually asks, not simplified examples from vendor demos.
What types of anomalies can AI dashboards detect?
AI dashboards detect statistical outliers in metric values, unexpected changes in trends, and deviations from forecasted performance. For marketing teams, this includes: sudden spikes or drops in campaign cost, conversion rate changes that exceed normal variation, traffic sources that start behaving differently than historical patterns, budget pacing issues where spend is tracking significantly above or below plan, and performance divergence between similar campaigns or ad groups. Advanced platforms use machine learning models that account for seasonality, day-of-week patterns, and campaign lifecycles rather than simple threshold-based alerts. However, anomaly detection generates many alerts, and not all indicate actionable problems — teams need processes to triage notifications and focus on genuine issues versus expected variation.
How are AI dashboards typically priced?
AI dashboard pricing models vary widely. Some platforms charge per user (Tableau, Power BI, Domo), others by data volume or query count (ThoughtSpot, Sisense), and marketing-specific platforms often use custom pricing based on connector count and data sources (Improvado). Per-user pricing becomes expensive for large marketing teams but is predictable. Data volume pricing scales with usage but can spike unexpectedly during high-activity periods. Enterprise platforms typically require annual contracts with minimums starting around $10,000–$50,000 per year. Calculate total cost of ownership including: platform licensing, connector maintenance fees, implementation services, training, ongoing support tiers, and engineering time for custom integrations. The cheapest listed price often isn't the lowest total cost when you factor in operational overhead.
What are the best AI dashboard examples for marketing teams?
The best AI dashboard examples for marketing teams include Improvado for enterprises running 1,000+ data sources, Tableau with Einstein for Salesforce-centric organizations, Power BI with Copilot for Microsoft-standardized teams, Looker with Gemini for BigQuery-first analytics engineering, and Klipfolio PowerMetrics for small teams that need pre-built templates within days.
Which AI dashboard is best for marketing agencies?
Improvado and Sisense best fit marketing agencies: Improvado for agencies managing client reporting across 1,000+ connected data sources with governance rules built in, and Sisense for agencies that need to embed white-label analytics directly inside a client-facing product rather than run internal reporting.
What are common use cases for an AI forecasting dashboard?
AI forecasting dashboards are used to predict campaign performance based on historical patterns, flag budget-pacing issues before spend overruns, and account for seasonality and day-of-week effects that simple threshold alerts miss. Power BI with Copilot, Looker with Gemini, and Dundas BI all include predictive-analytics features built for this kind of forward-looking analysis.
What makes an AI dashboard different from a traditional dashboard?
AI dashboards actively monitor your data, identify patterns, and alert you to anomalies without human intervention. They use machine learning to automate insight discovery, predict outcomes, and answer questions in natural language, while traditional dashboards display static metrics you configure manually.
How much time do AI dashboards save marketing teams?
AI-powered dashboards reduce reporting time by up to 80% by automating data preparation, transformation, and visualization tasks that previously required dedicated analytics teams. Marketing teams using AI dashboards with native connectors spend 80% less time on data preparation.
What AI capabilities should marketing dashboards have?
Core AI capabilities include automated anomaly detection that identifies outliers in real-time, predictive analytics that forecast future performance, natural language processing for conversational queries, automated data preparation that cleans data without manual ETL work, and smart recommendations that suggest next-best actions.
Which AI dashboard is best for enterprises with many data sources?
Improvado is best for enterprises with 1,000+ data sources. It connects 1,000+ data sources, automatically transforms data into marketing-specific models, and includes an AI Agent that answers analytical questions conversationally. Implementation is typically operational within a week for standard connector configurations.
How long does it take to implement an AI marketing dashboard?
Implementation time varies dramatically. Enterprise BI platforms often require 3 to 6 months of data engineering work, while purpose-built marketing solutions like Improvado can be operational within a week. Marketing-focused solutions should be operational within weeks, and implementation time directly correlates to time-to-value.
“On the reporting side, we saw a significant amount of time saved! Some of our data sources required lots of manipulation, and now it's automated and done very quickly. Now we save about 80% of time for the team.”

Related reading: AI Accountability Framework for CFO Dashboards | Improvado