
Marketing analysts track campaigns across Google Ads, Meta, LinkedIn, TikTok, email platforms, and CRMs — and those platforms don't talk to each other. You spend hours exporting CSVs, reconciling attribution models, and explaining why the numbers in three different reports don't match.
A multi-channel marketing dashboard solves this by connecting all your data sources into one unified view. Instead of jumping between tabs and downloading files, you see campaign performance, customer journey metrics, and cross-channel attribution in real time — all in one place.
This guide shows you how to build and maintain a dashboard that actually works: what data to track, how to structure metrics for decision-making, and how to automate the manual work that eats your week.
Key Takeaways
✓ Multi-channel marketing dashboards aggregate data from all campaign platforms into a single view, eliminating manual reporting work and version control issues.
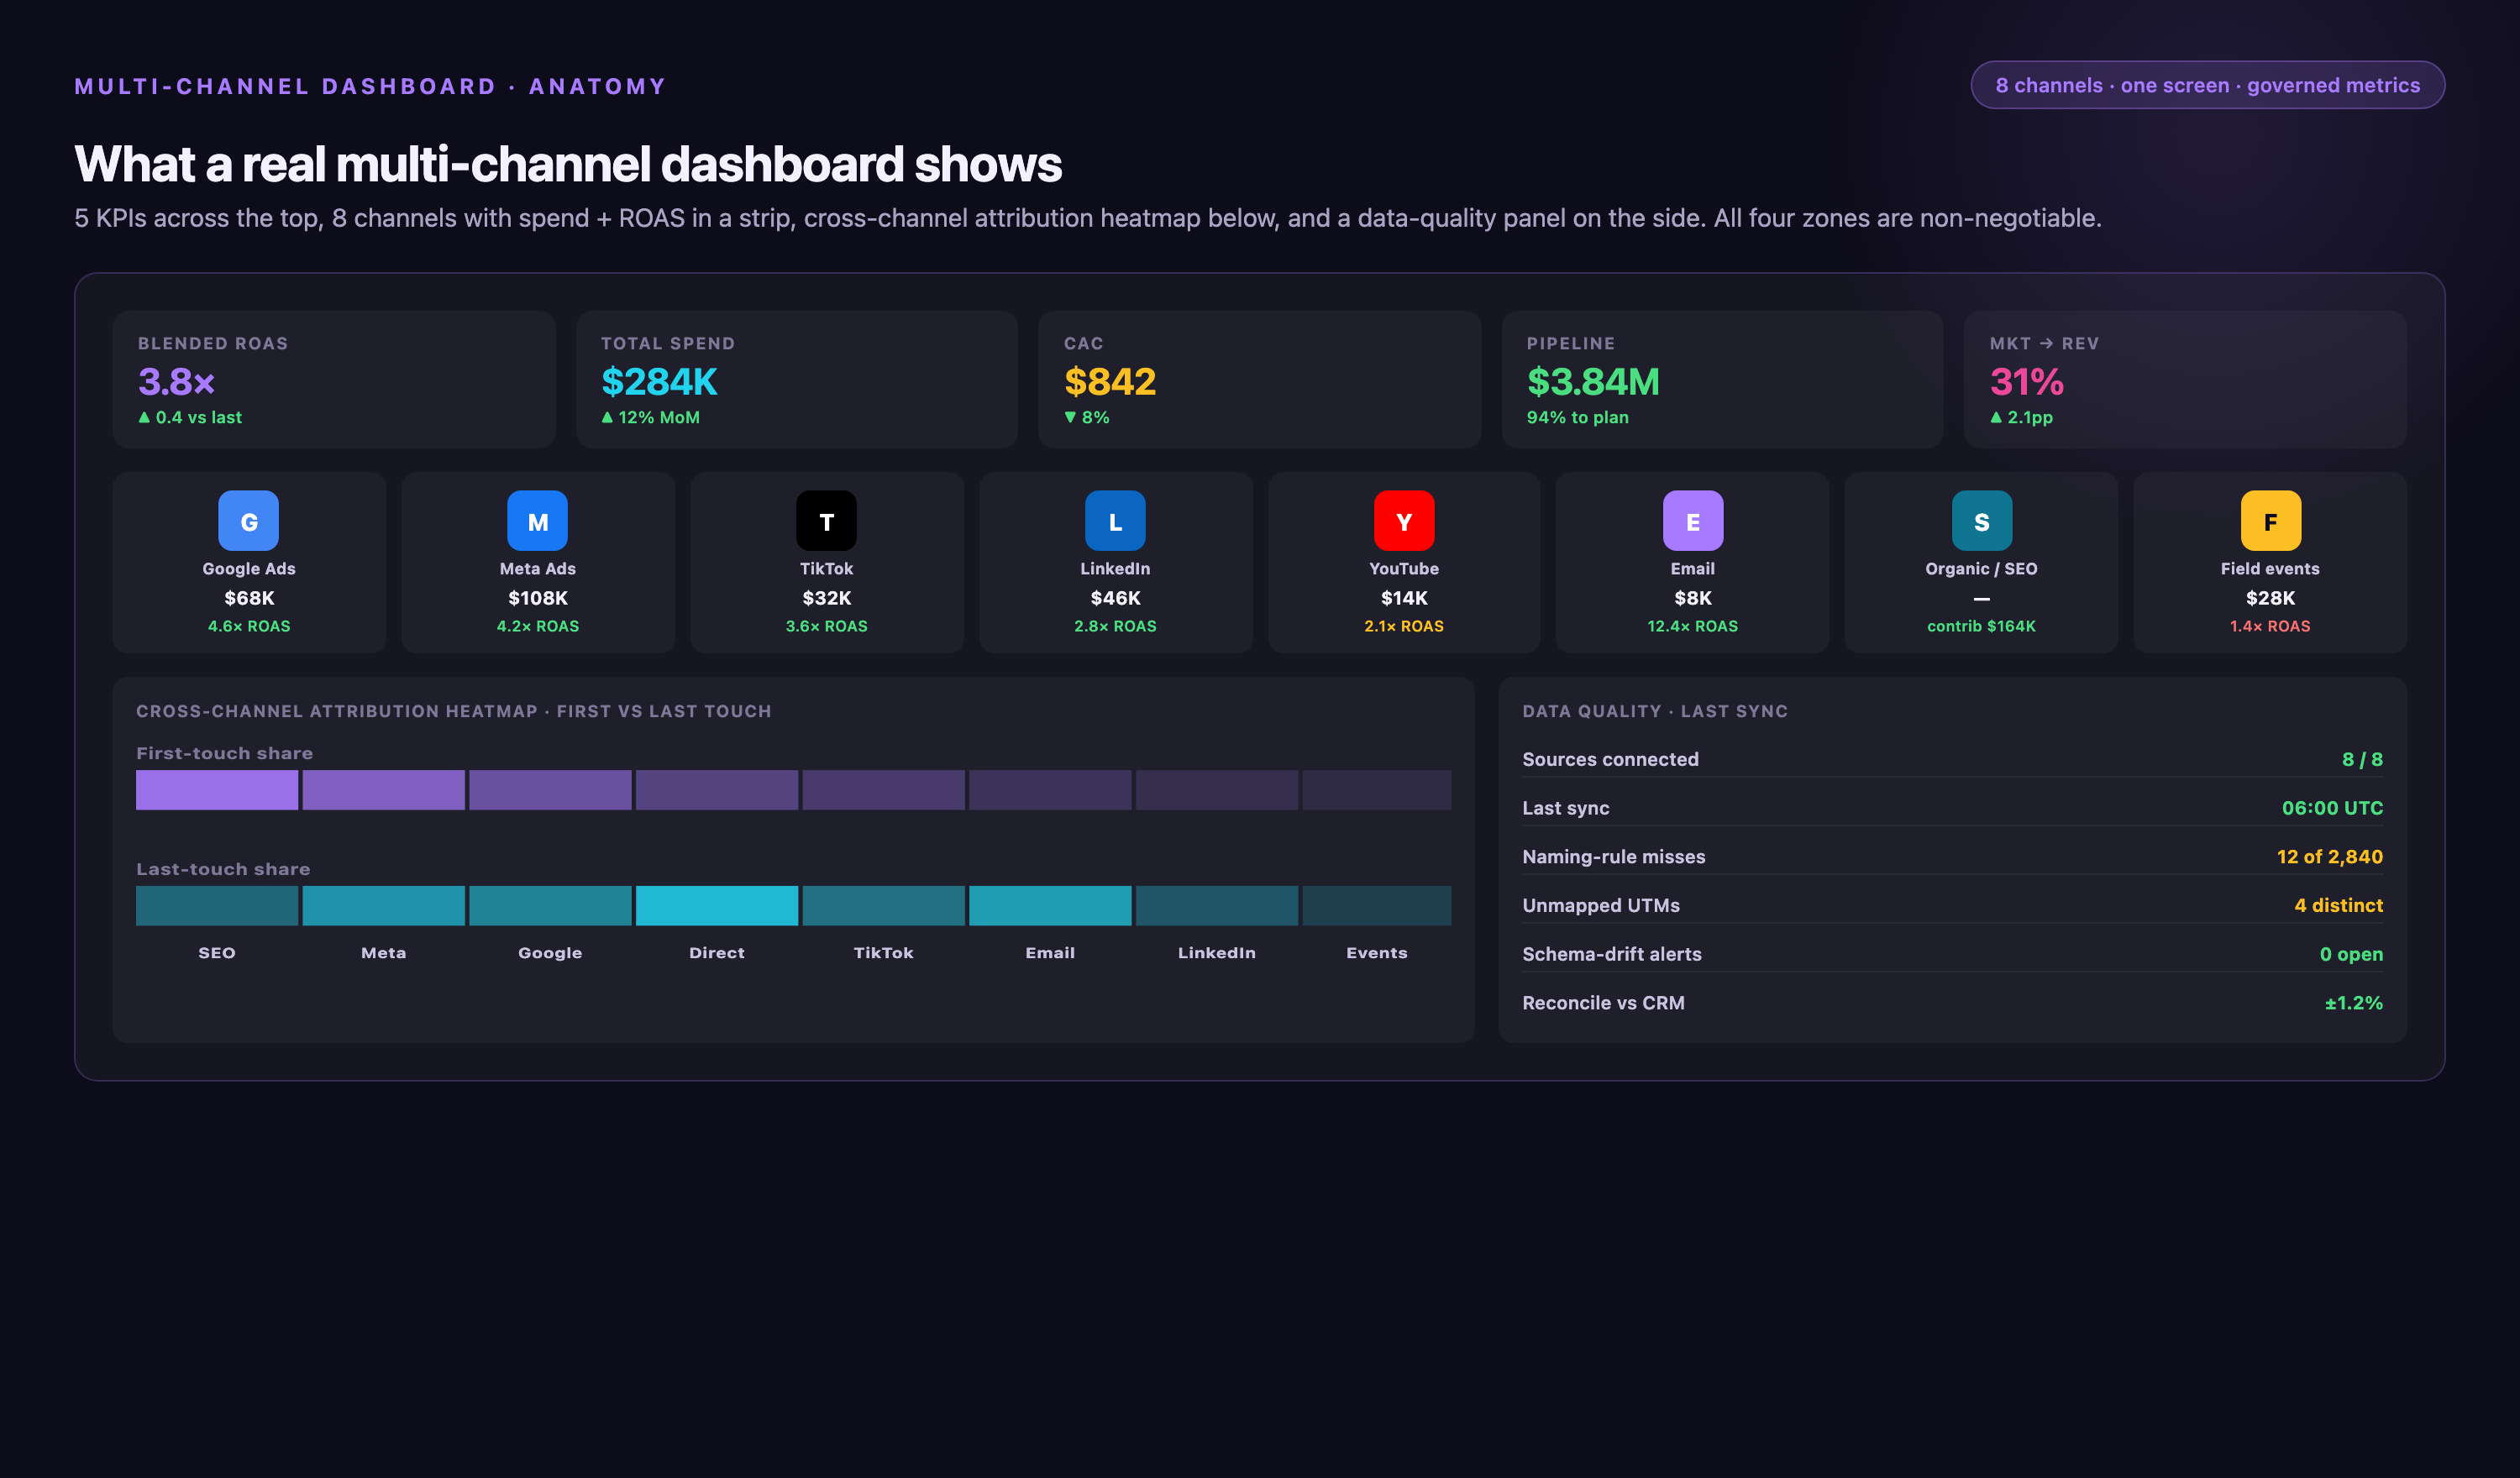
✓ Successful dashboards track three metric layers: acquisition (impressions, clicks, CPA), engagement (time on site, pages per session), and revenue (conversion rate, customer lifetime value).
✓ Automated data pipelines keep dashboards current without daily manual updates — the right infrastructure refreshes hourly and flags anomalies automatically.
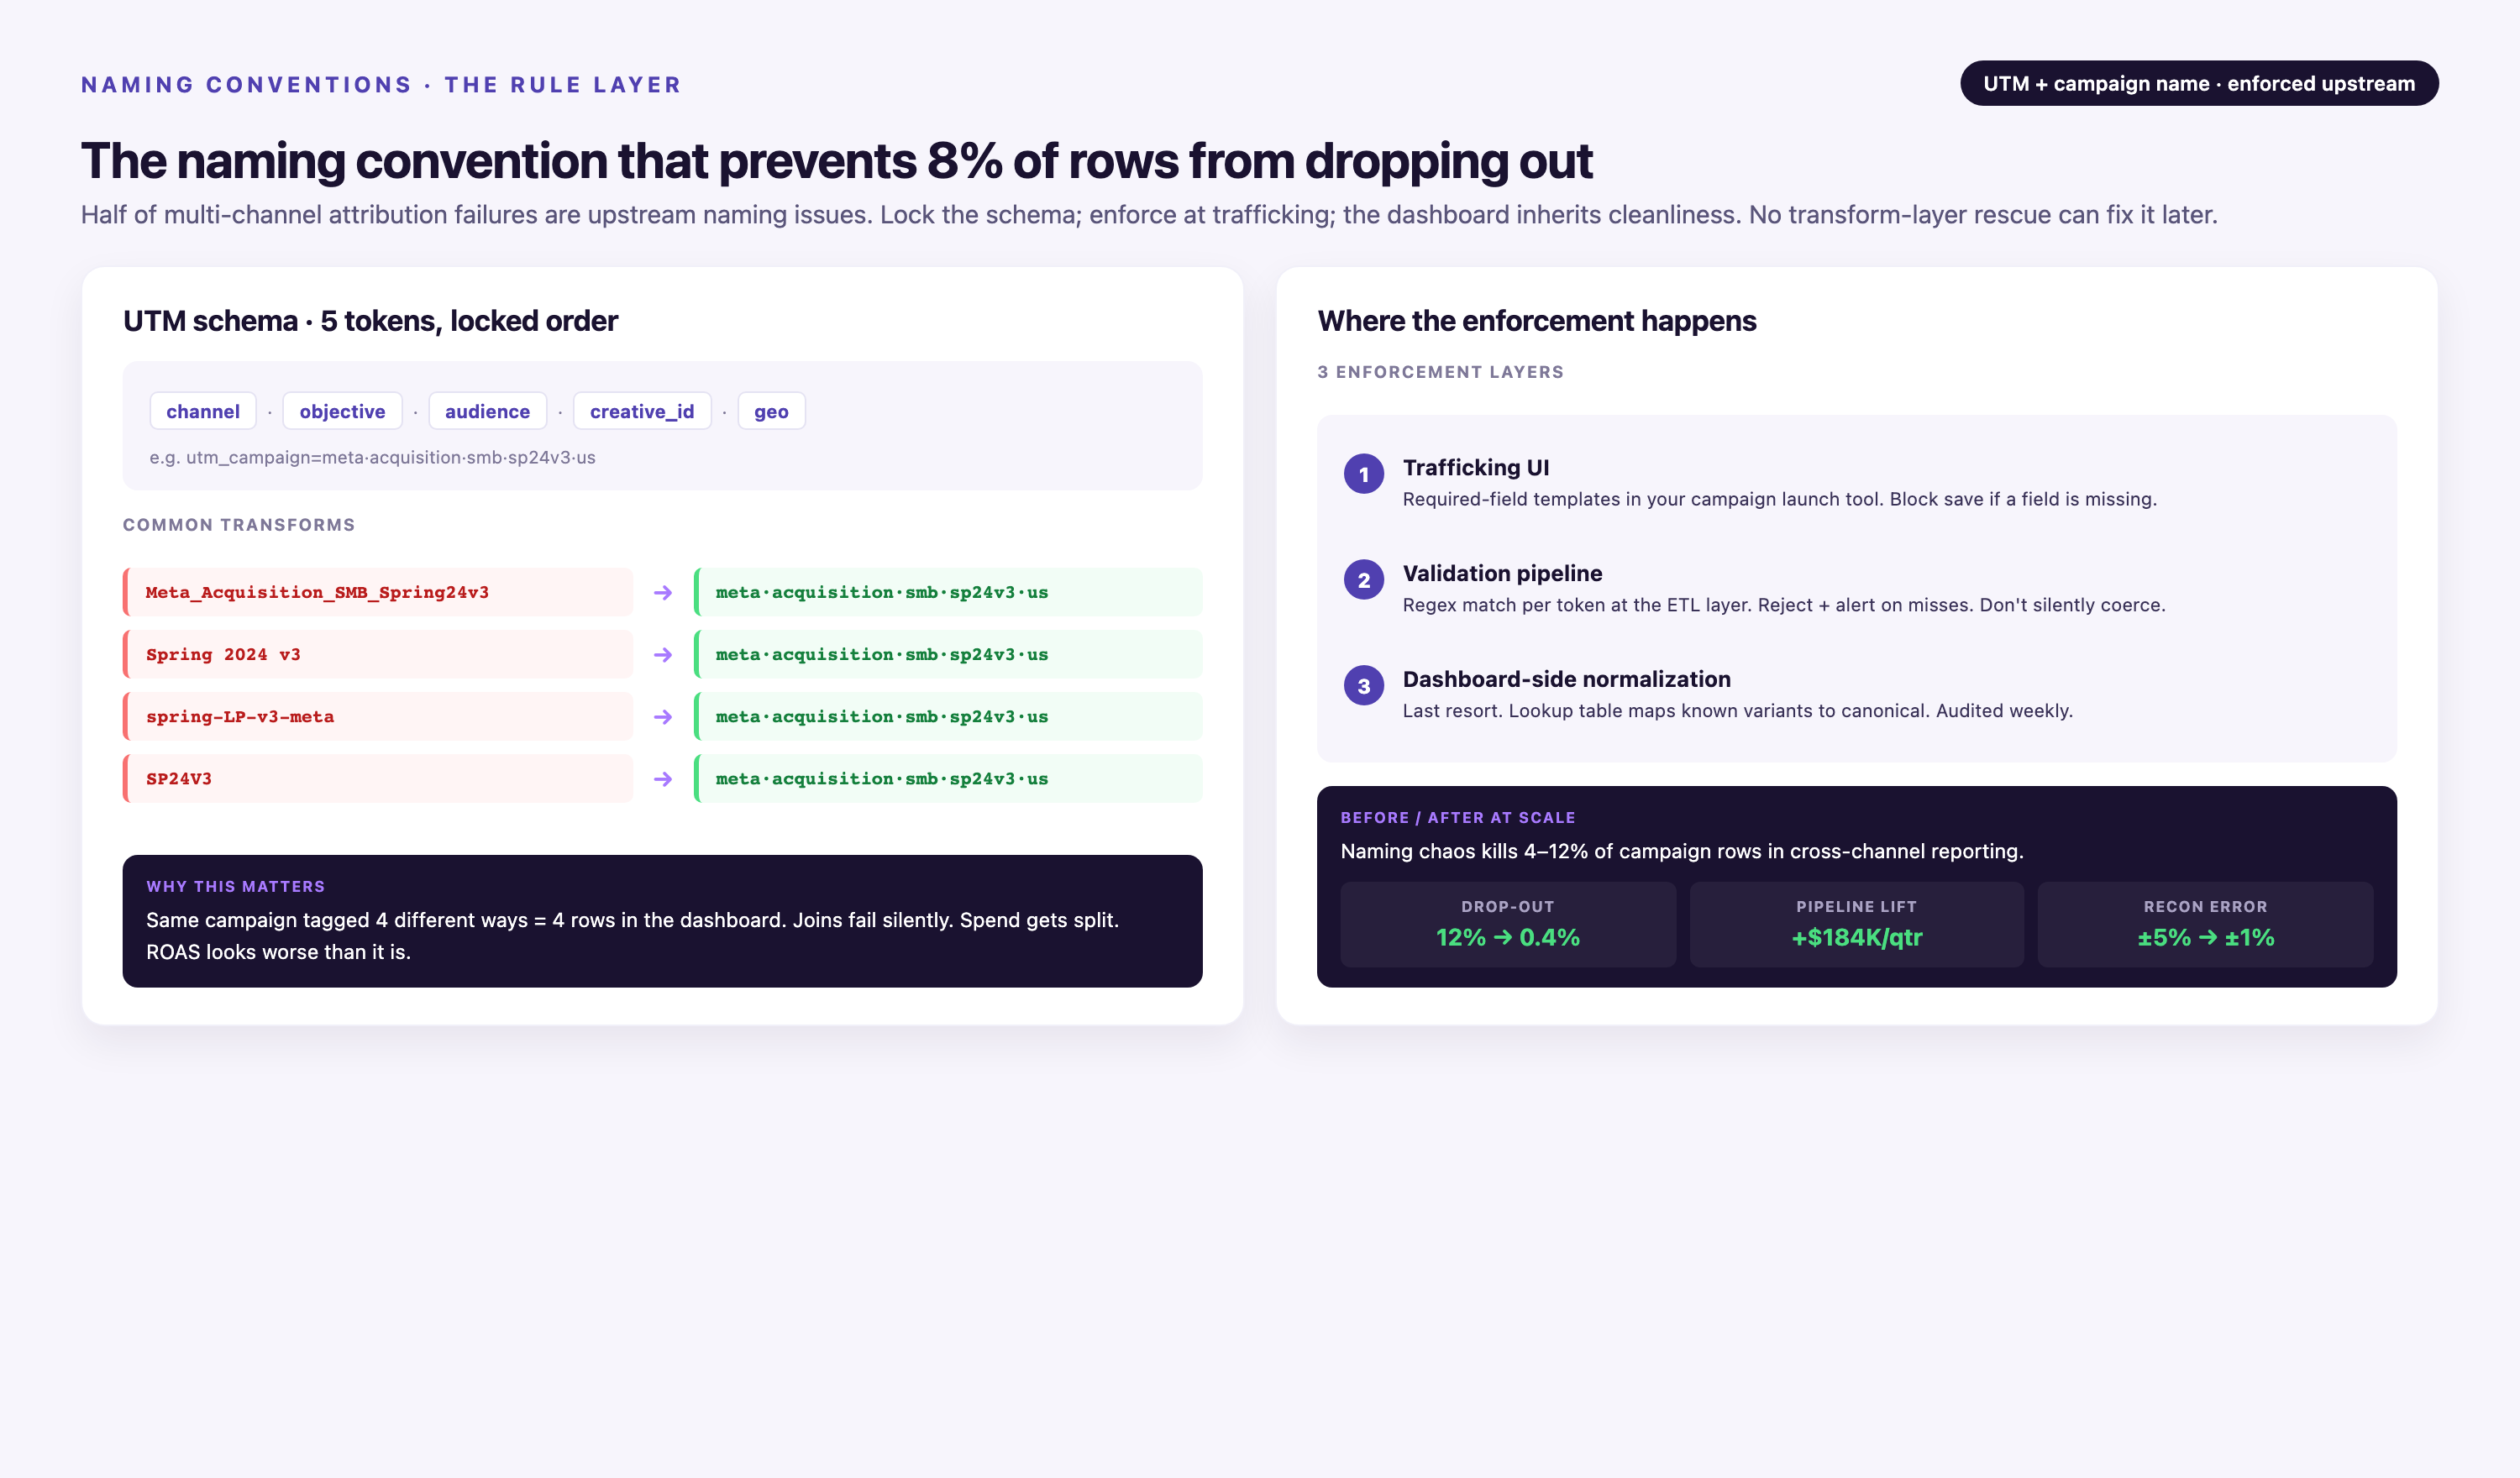
✓ Cross-channel attribution becomes actionable when you standardize UTM parameters, align naming conventions, and map customer touchpoints across platforms.
✓ Implementation typically requires connecting data sources, building transformation logic, and configuring visualization layers — most teams are operational within a week.
✓ Choosing the right toolchain depends on data volume, technical team capacity, and how many stakeholders need dashboard access.
What Is a Multi-Channel Marketing Dashboard?
A multi-channel marketing dashboard is a centralized reporting interface that pulls performance data from every platform where you run campaigns — paid ads, social media, email, search, affiliate networks, and offline channels — and displays it in one view.
Without this, you're logging into Google Ads to check CPC, then Meta for engagement, then Salesforce for lead quality, then manually combining everything in spreadsheets. That process introduces errors, creates version conflicts, and means yesterday's data isn't available until you finish building today's report.
The dashboard replaces that workflow with automated data connections. Your ad spend, impressions, conversions, and attribution data flow into one system automatically. You see which channels drive pipeline, where budget is wasted, and how campaigns perform against each other — updated hourly, not after three hours of manual work.
Why Marketing Teams Need Unified Dashboards
When your data lives in separate platforms, three problems compound fast:
• Delayed decisions: By the time you compile reports manually, campaign performance has already shifted. You're optimizing based on data that's already outdated.
• Attribution gaps: Platforms credit themselves for conversions. Google Ads and Meta both claim the same sale. Without unified tracking, you can't see the real customer journey or allocate budget accurately.
• Team misalignment: Marketing shows one set of numbers, sales references another, finance has a third version. Everyone's working from different data, so strategic conversations turn into debates about whose report is correct.
A unified dashboard fixes this by establishing a single source of truth. Everyone sees the same metrics, updated at the same time, with consistent definitions. That clarity lets teams move from arguing about data accuracy to discussing what the data means and what to do next.
For marketing analysts specifically, dashboards eliminate the repetitive work that fills your calendar. Instead of spending mornings pulling reports, you spend that time analyzing trends, building forecasts, and answering strategic questions.
Step 1: Define Which Metrics and KPIs to Track
Before connecting platforms, decide what you're measuring and why. Dashboards fail when they display every available metric — 50 numbers on one screen means nothing gets prioritized.
Start with three metric categories:
Acquisition Metrics
These show how efficiently you're bringing people into your funnel:
• Impressions and reach: How many people saw your ads across all channels.
• Click-through rate (CTR): Percentage of impressions that became clicks — indicates creative and targeting effectiveness.
• Cost per click (CPC) and cost per acquisition (CPA): What you're paying to get attention and convert it into leads or customers.
• Channel mix: How spend and traffic distribute across paid search, social, display, email, and other channels.
Engagement Metrics
Once someone clicks, these metrics show whether they're actually interested:
• Bounce rate: Percentage of visitors who leave immediately — high bounce rates signal poor message-match or landing page issues.
• Time on site and pages per session: How deeply visitors explore your content.
• Form completion rate: What percentage of people who start a form actually submit it.
• Email open and click rates: Whether your nurture sequences keep prospects engaged.
Revenue Metrics
These connect marketing activity directly to business outcomes:
• Conversion rate: What percentage of visitors take your desired action (demo request, purchase, trial signup).
• Customer acquisition cost (CAC): Total marketing and sales expense divided by new customers acquired.
• Customer lifetime value (CLV): Average revenue a customer generates over their entire relationship with your company.
• Return on ad spend (ROAS): Revenue generated per dollar spent on advertising.
Choose 8–12 KPIs that ladder up to business goals. If your company prioritizes pipeline growth, track MQLs, SQLs, and opportunity creation by channel. If it's brand awareness, focus on reach, engagement, and share of voice. The dashboard should answer your CEO's questions without explanation.
| Business Goal | Primary KPIs | Supporting Metrics |
|---|---|---|
| Pipeline growth | MQLs, SQLs, pipeline created | Conversion rate by channel, cost per MQL, time to opportunity |
| Revenue efficiency | CAC, ROAS, win rate | Deal size by source, sales cycle length, channel contribution to closed-won |
| Brand awareness | Reach, impressions, share of voice | Engagement rate, branded search volume, social mentions |
| Customer retention | Churn rate, net revenue retention | Product usage by acquisition channel, repeat purchase rate, CLV |
Step 2: Connect All Your Marketing Data Sources
Once you know what to measure, you need to get data from every platform into one place. Most teams run 8–15 marketing tools simultaneously — ad platforms, analytics, CRM, email, social schedulers — and each has its own API, data format, and refresh schedule.
You have three options for connecting them:
Native Platform Integrations
Some BI tools offer built-in connectors for popular platforms like Google Ads, Meta, and Salesforce. These work well for small data volumes and standard use cases, but they break when:
• Platforms change API schemas (happens frequently — connectors go down for days)
• You need custom fields or calculated metrics the native integration doesn't support
• You're pulling data from niche platforms without pre-built connectors
Custom API Scripts
Engineering teams sometimes build Python or Node scripts to pull data directly from platform APIs. This gives full control over data structure and transformation logic, but it requires ongoing maintenance. When Google Ads updates its API, your script breaks until someone fixes it. When your team adopts a new ad platform, someone needs to write a new script.
Custom development makes sense if you have dedicated engineering resources and highly specific data requirements. For most marketing teams, it creates a maintenance burden that compounds over time.
Dedicated Marketing Data Integration Platforms
Platforms built specifically for marketing data solve the maintenance problem. They maintain connectors for you — when APIs change, the platform updates its integration, not your scripts. When you add a new tool, you configure the connection through a UI instead of writing code.
Improvado is an example of this approach. It connects to over 1,000 marketing and sales platforms through pre-built integrations that stay current automatically. You select which sources to connect, map your fields once, and data flows into your dashboard or data warehouse without manual updates.
Step 3: Standardize Naming Conventions and UTM Parameters
Even with all platforms connected, dashboards become unusable if every team member names campaigns differently. One person writes "LinkedIn_Q1_Webinar", another uses "LI-Webinar-2026-Q1", a third just types "webinar promo". When you try to aggregate performance by campaign type or quarter, nothing groups correctly.
Set strict naming standards before launching campaigns:
UTM Parameter Structure
Use consistent UTM parameters across all channels so analytics platforms can attribute traffic correctly:
• utm_source: The platform sending traffic (google, facebook, linkedin, newsletter)
• utm_medium: The channel type (cpc, social, email, affiliate)
• utm_campaign: Specific campaign identifier (spring_sale_2026, product_launch_beta)
• utm_content: Ad variant or content version (video_ad_a, carousel_test_2)
• utm_term: Paid search keyword (only for search campaigns)
Create a UTM builder spreadsheet or use a tool that enforces your naming schema. When every link follows the same structure, your dashboard can automatically group performance by source, medium, or campaign without manual tagging.
Campaign Naming Convention
Apply the same logic to campaign names inside platforms. A structured format might look like:
[Channel]_[Campaign Type]_[Audience]_[Quarter]_[Variant]
Example: LinkedIn_LeadGen_Directors_Q2_TestA
When everyone follows this format, you can filter dashboards by any component — see all Q2 campaigns, all lead generation efforts, or all director-targeted ads — without manually tagging each one.
Step 4: Build Data Transformation Logic
Raw data from marketing platforms arrives inconsistent and incomplete. Google Ads calls it "conversions", Meta calls it "purchase events", LinkedIn says "lead gen forms" — but you need one unified "conversion" metric across all three.
Transformation logic standardizes data before it reaches your dashboard:
Field Mapping
Map equivalent fields from different platforms to common names:
| Platform Field | Unified Field Name |
|---|---|
| Google Ads: conversions | total_conversions |
| Meta: purchase | total_conversions |
| LinkedIn: lead_gen_form_submissions | total_conversions |
| Google Ads: cost | spend |
| Meta: spend | spend |
| LinkedIn: total_spend | spend |
Once mapped, you can sum total_conversions across platforms without worrying about what each platform calls it internally.
Calculated Metrics
Many KPIs require math across multiple fields. Define these calculations once in your transformation layer, not separately in every dashboard:
• CPA (Cost Per Acquisition): spend / conversions
• ROAS (Return on Ad Spend): revenue / spend
• CTR (Click-Through Rate): (clicks / impressions) × 100
When the logic lives in one place, every report calculates metrics identically. You avoid situations where two dashboards show different ROAS numbers because someone used gross revenue and someone else used net revenue in the formula.
Data Quality Rules
Set validation rules to catch errors before they reach dashboards:
• Flag campaigns with CPA above your maximum threshold
• Alert when daily spend exceeds budget by more than a set percentage
• Mark records with missing UTM parameters
• Detect sudden traffic spikes or drops that indicate tracking issues
Improvado's Marketing Data Governance includes over 250 pre-built rules that automatically validate data quality and flag anomalies. Instead of discovering tracking broke two weeks ago, you get alerted the day it happens.
Step 5: Design Dashboard Layouts for Different Audiences
Your CMO cares about different metrics than your paid search specialist. A single dashboard trying to serve both audiences ends up cluttered and hard to navigate.
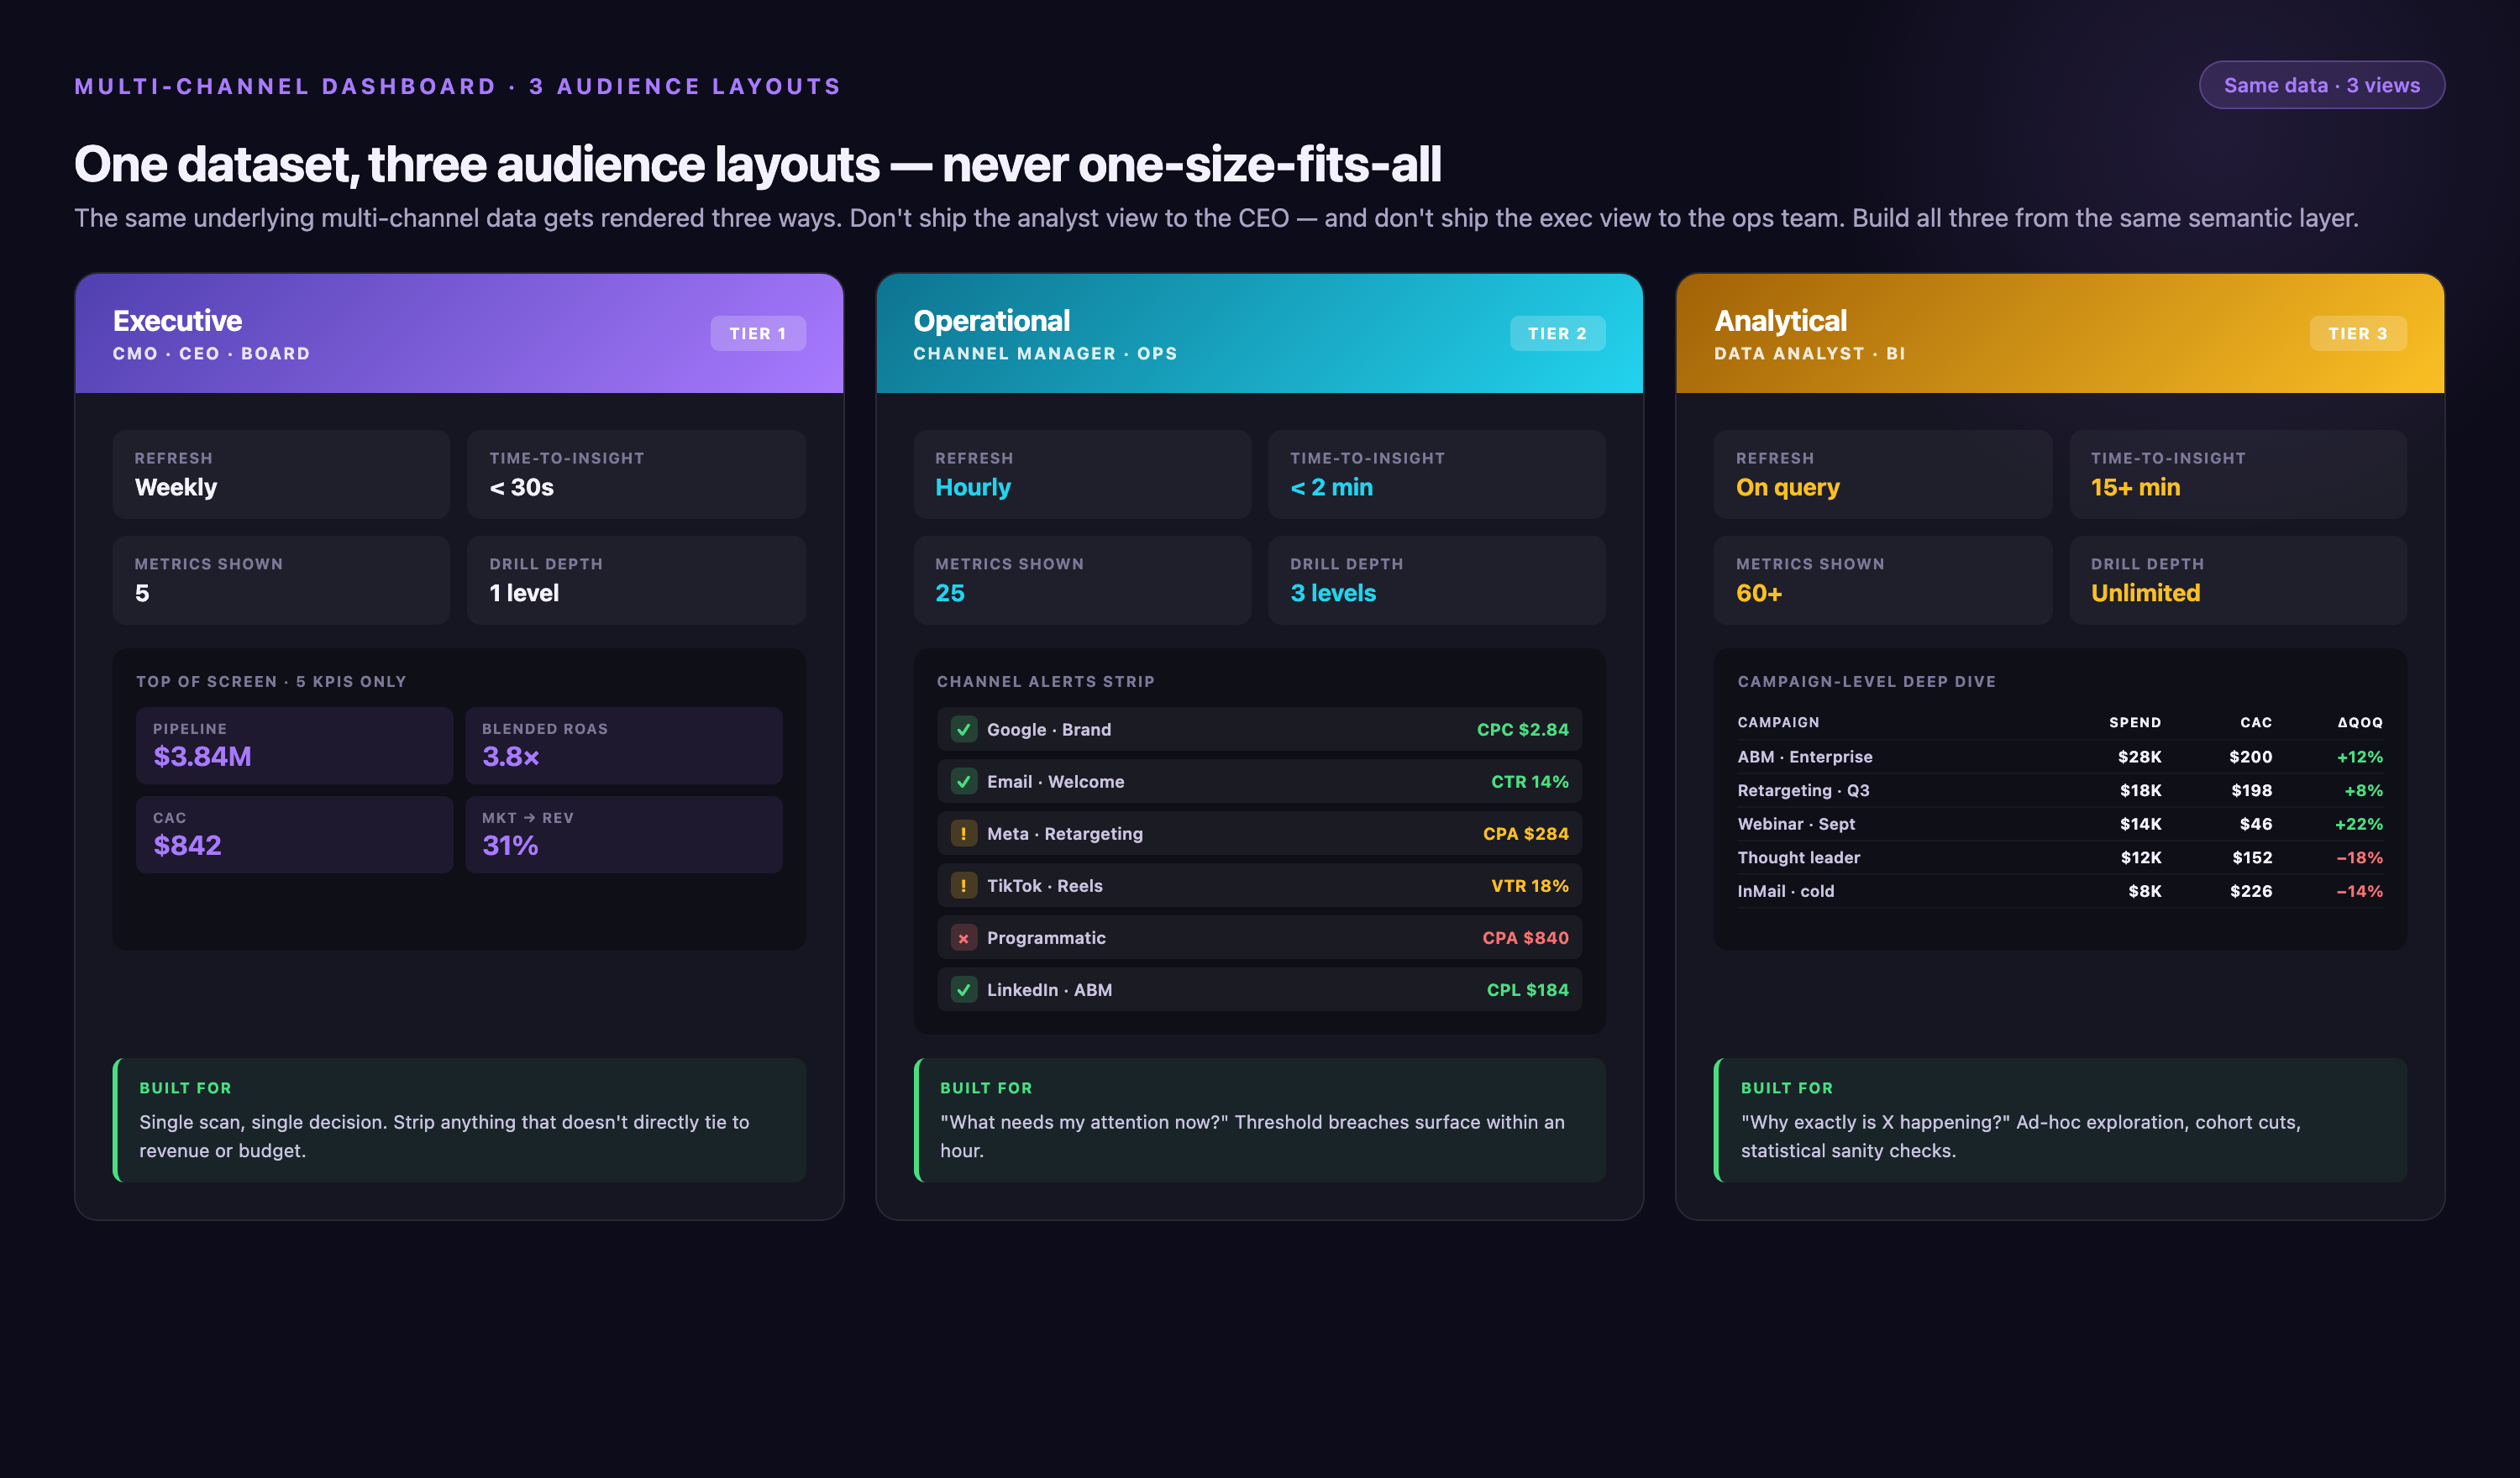
Build role-specific views:
Executive Dashboard
Leadership wants high-level trends and outcome metrics — not daily fluctuations in CTR. Show:
• Month-over-month and year-over-year performance trends
• Budget pacing: actual spend vs. planned spend by channel
• Pipeline and revenue contribution by marketing channel
• Top campaigns by ROAS or pipeline created
Keep this view simple — 6–8 visualizations maximum. Use large numbers and trend arrows so executives scan the page in under 30 seconds and understand if things are on track.
Marketing Analyst Dashboard
Analysts need granular data to diagnose issues and optimize campaigns:
• Campaign-level performance: CTR, CPC, conversion rate, CPA by campaign
• Day-over-day and week-over-week changes to spot trends early
• Drill-down capability: click a channel to see campaigns, click a campaign to see ad sets, click an ad set to see individual creatives
• Attribution model comparison: see how first-click, last-click, and multi-touch models affect channel credit
This dashboard can be denser — analysts spend hours here daily and need comprehensive data access.
Channel Specialist Dashboard
Specialists managing specific channels (paid search, paid social, email) want even more detail within their domain:
• Keyword-level performance for search campaigns
• Audience segment breakdown for social campaigns
• A/B test results for email campaigns
• Creative performance: which images, headlines, or videos drive best results
Let specialists customize their views. They know what micro-optimizations matter for their channel and should be able to add widgets or filters without needing analyst support every time.
- →Your analysts spend Monday mornings exporting CSVs instead of analyzing trends — manual reporting consumes 10+ hours per week
- →Campaign performance data is two days old by the time you compile it — optimization decisions lag behind reality
- →Marketing, sales, and finance all show different conversion numbers in meetings because each team pulls data differently
- →You can't answer "which channel drove this deal?" without manually tracking down UTM parameters and CRM logs
- →Platform API changes break your dashboards regularly — you spend more time fixing integrations than analyzing campaigns
Step 6: Automate Reporting and Alerts
Manual reporting isn't just slow — it's a delay between when something breaks and when you notice. If you pull reports every Monday, a campaign that stopped converting on Tuesday doesn't get flagged until the following week. You've spent five days of budget on a broken campaign.
Automation eliminates that gap:
Scheduled Reports
Set dashboards to email stakeholders automatically:
• Daily: Performance summary to analysts and channel managers — shows yesterday's spend, conversions, and any anomalies
• Weekly: Campaign roundup to marketing leadership — highlights top performers, budget pacing, and week-over-week trends
• Monthly: Executive report to CMO and CFO — full month performance, variance from goals, channel ROI analysis
When reports arrive in inboxes automatically, people check them. When someone has to remember to log in and pull data, they don't — and decisions get made without data input.
Real-Time Alerts
Configure alerts that notify you immediately when something's wrong:
• Campaign spend exceeds daily budget by more than 20%
• Conversion rate drops below historical average for two consecutive hours
• CPA increases by more than 50% day-over-day
• Impressions fall to zero (indicates campaign paused or tracking broken)
Send alerts to Slack, email, or your team's preferred communication platform. This turns your dashboard into an active monitoring system, not just a reporting tool.
Step 7: Implement Cross-Channel Attribution
A prospect clicks your LinkedIn ad, visits your site, leaves, sees a Google search ad three days later, clicks it, still doesn't convert, then opens your email a week later and finally requests a demo. Which channel gets credit for that conversion?
Attribution modeling answers this by assigning value to each touchpoint in the customer journey. Different models distribute credit differently:
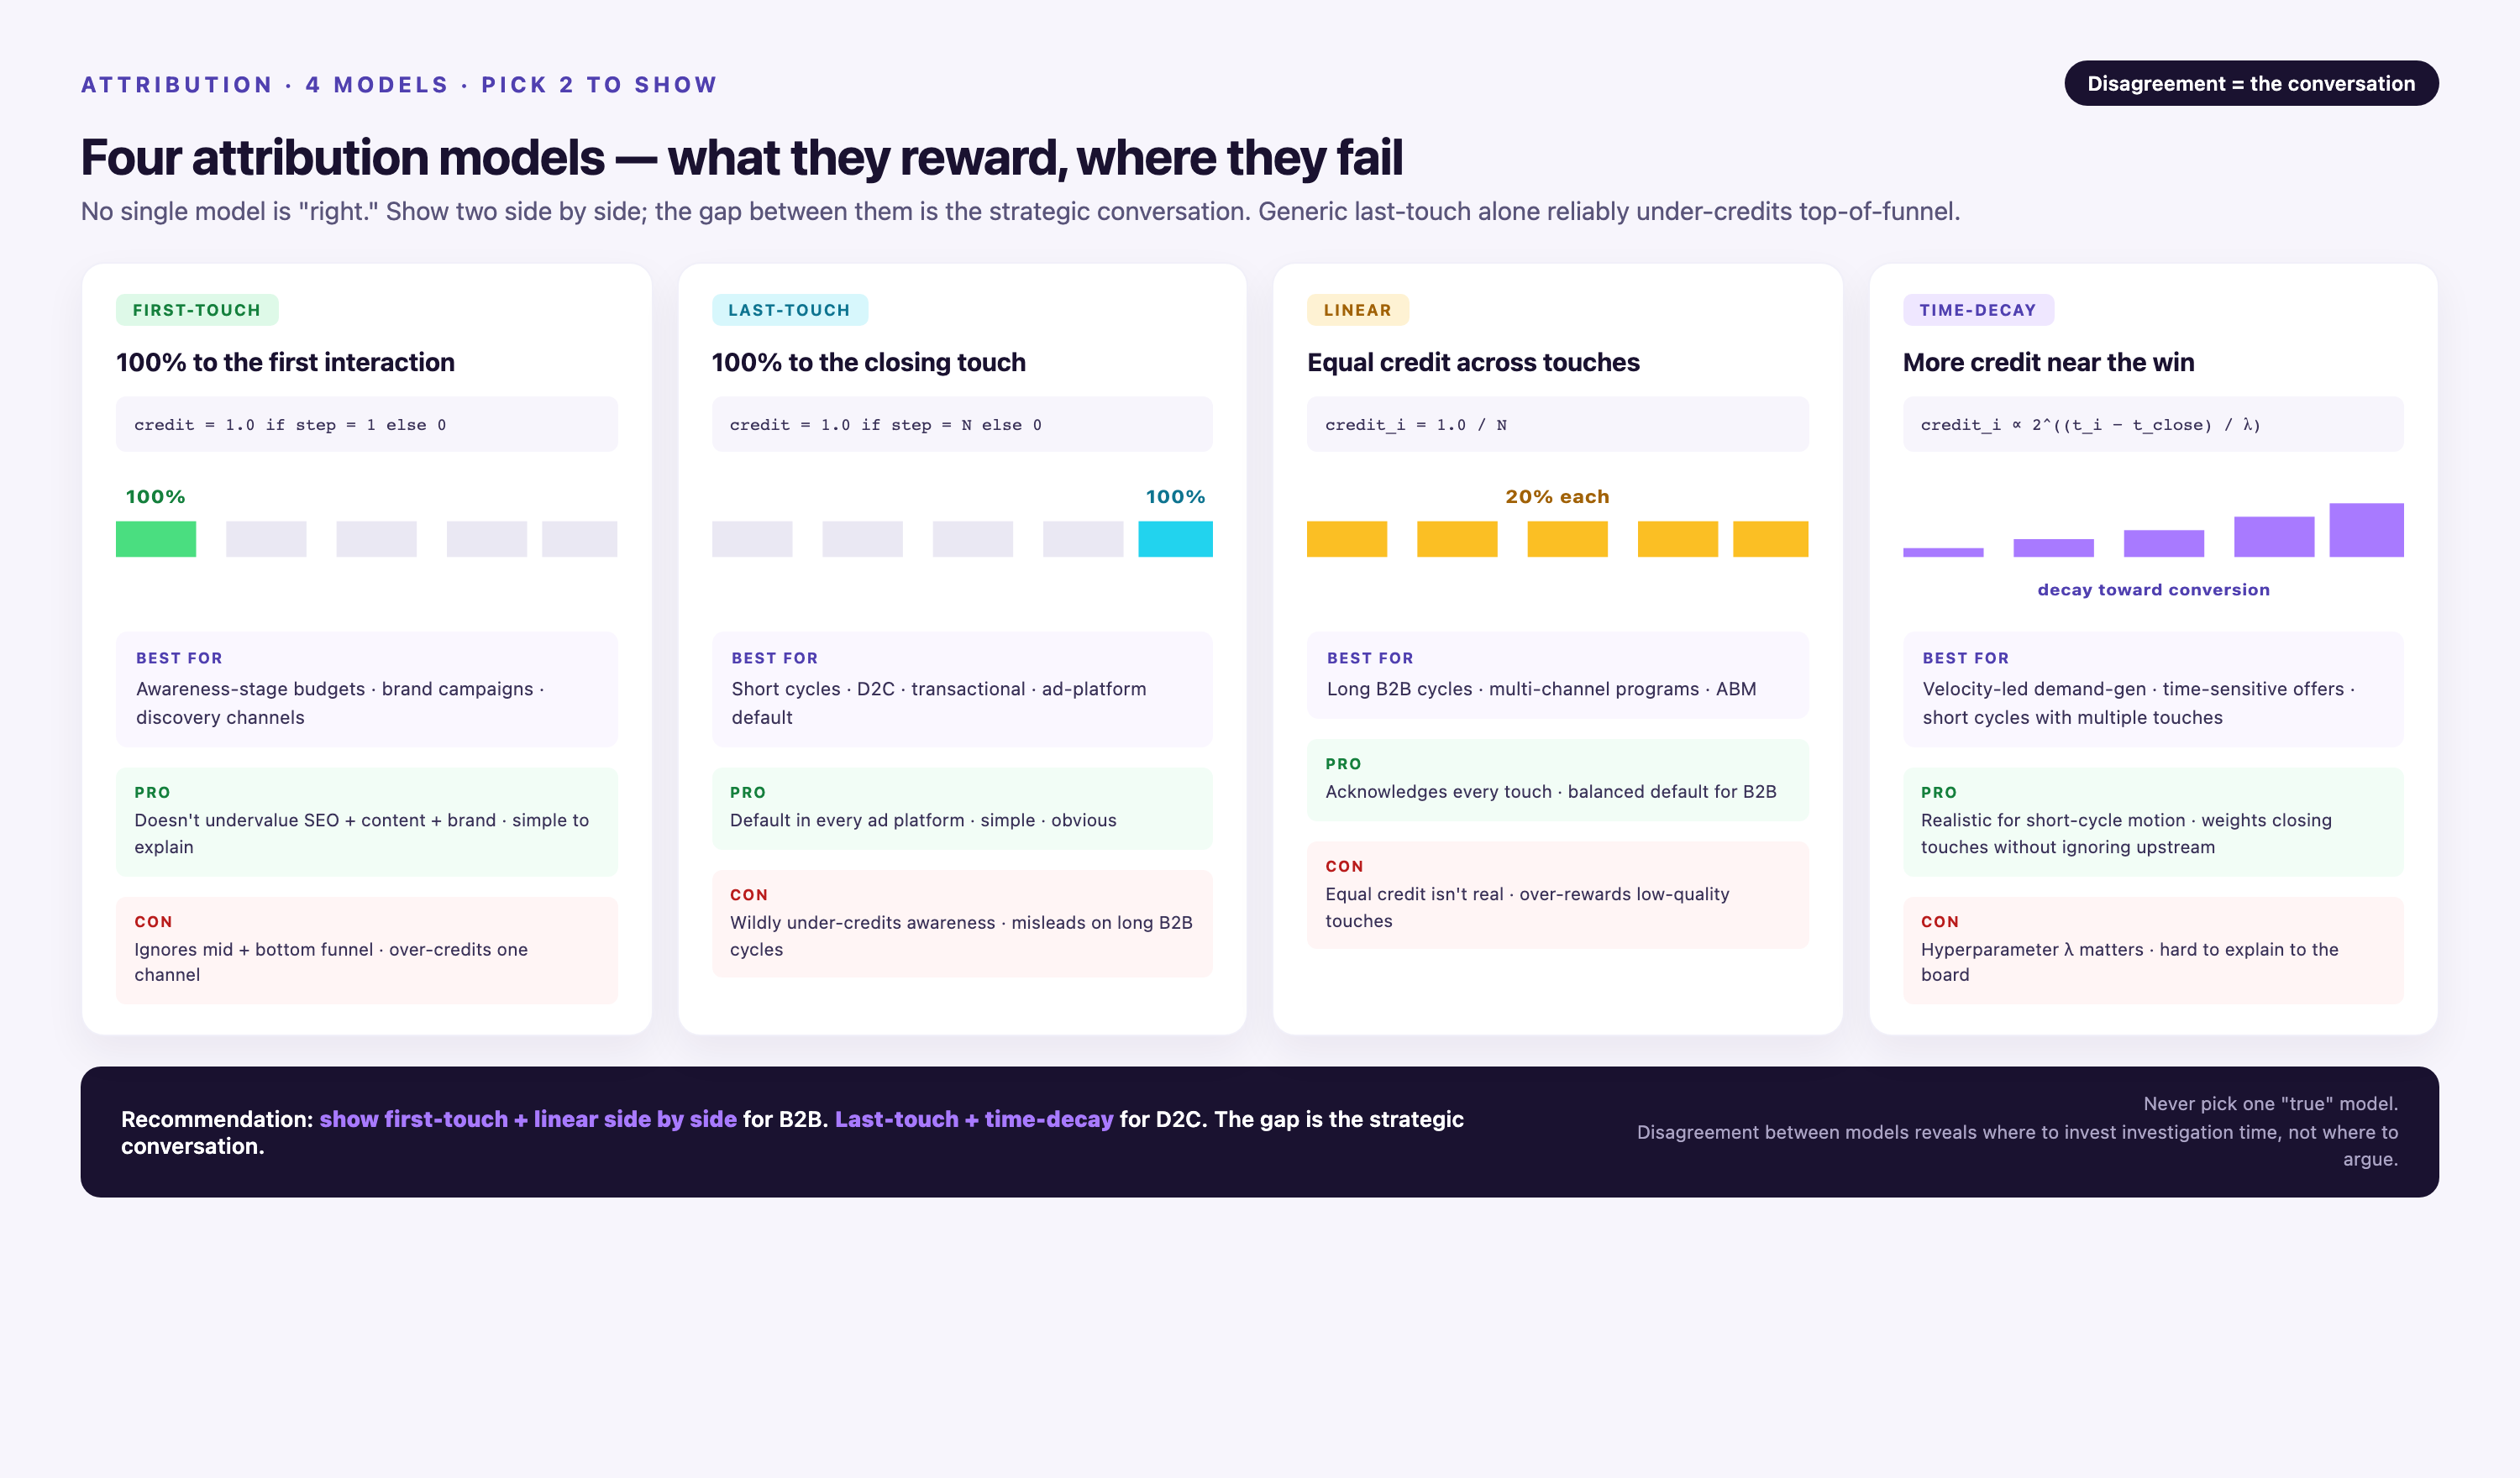
Common Attribution Models
• First-click attribution: Gives 100% credit to the first touchpoint. Good for understanding what initially drove awareness.
• Last-click attribution: Gives 100% credit to the final touchpoint before conversion. Simple but ignores the journey that built trust.
• Linear attribution: Splits credit equally across all touchpoints. Fair, but doesn't recognize that some touchpoints matter more than others.
• Time-decay attribution: Gives more credit to recent touchpoints. Useful for longer sales cycles where late-stage touches close deals.
• Position-based (U-shaped) attribution: Assigns 40% to first touch, 40% to last touch, and splits remaining 20% among middle touchpoints.
No single model is universally correct. The right choice depends on your sales cycle and what questions you're trying to answer.
Implementing Multi-Touch Attribution
To track full customer journeys, you need:
1. Unified user identity: Connect anonymous website visitors to known contacts. When someone fills a form, link their earlier anonymous sessions to their CRM record.
2. Touchpoint logging: Capture every interaction — ad clicks, website visits, email opens, webinar attendance, demo requests — with timestamps.
3. Journey stitching: Reconstruct paths from first touch to conversion. This requires joining data from web analytics, ad platforms, CRM, and marketing automation.
4. Model application: Apply your chosen attribution model to distribute conversion value back across touchpoints.
Most analytics platforms offer basic attribution. Google Analytics shows some multi-touch paths. Dedicated attribution platforms like Improvado's AI Agent go further — they connect data across all platforms, apply custom attribution models, and show you channel contribution at every funnel stage.
Common Mistakes to Avoid
Even well-designed dashboards fail when teams make these errors:
Tracking Too Many Metrics
Dashboards with 40 widgets don't get used — they're overwhelming. People can't tell what's important, so they ignore the whole thing. Limit each dashboard view to 8–12 core KPIs. If someone needs more detail, let them drill down or create a secondary view.
Ignoring Data Latency
Different platforms report data on different schedules. Google Ads updates hourly. Some affiliate networks report daily with a 48-hour delay. If you don't account for latency, your dashboard shows incomplete data and people make decisions based on partial information. Label metrics with last-updated timestamps so viewers know what's current and what's still processing.
Skipping Data Governance
Without governance, "conversions" means different things to different teams. Marketing counts form fills. Sales counts closed deals. Finance counts recognized revenue. When everyone uses the same term for different events, dashboards become useless. Document metric definitions in a data dictionary and enforce consistent usage.
Building Static Dashboards
Your marketing strategy changes. You launch new channels, retire underperforming campaigns, shift budget allocations. If your dashboard doesn't evolve with your strategy, it becomes a historical record instead of a decision tool. Schedule quarterly dashboard reviews to add new metrics, remove irrelevant ones, and reorganize layouts based on how teams actually use them.
Forgetting Mobile Access
Leadership often reviews dashboards on phones during commutes or between meetings. If your dashboard requires a 27-inch monitor to read, it won't get checked. Design with mobile in mind — larger fonts, fewer widgets per screen, touch-friendly navigation.
Tools That Help You Build Multi-Channel Marketing Dashboards
The right toolchain depends on your data volume, technical resources, and how many platforms you're connecting. Here's how leading solutions compare:
| Tool | Best For | Data Sources | Pricing | Technical Skill Required |
|---|---|---|---|---|
| Improvado | Enterprises with 10+ data sources needing automated pipelines and governed data | 1,000+ marketing, sales, and analytics platforms | Custom pricing | Low — no-code interface with SQL option for advanced users |
| Google Data Studio (Looker Studio) | Small teams using mostly Google products | ~20 native connectors, limited third-party options | Free | Low for basic dashboards, medium for custom connectors |
| Tableau | Teams with strong BI resources who need flexible visualization | Hundreds via native connectors and custom API builds | $70/user/month and up | Medium to high — requires BI analyst expertise |
| Power BI | Microsoft-centric organizations with existing Azure infrastructure | Hundreds of connectors, strong Microsoft ecosystem integration | $10–$20/user/month | Medium — easier than Tableau, still requires training |
| Supermetrics | Smaller teams pulling data into Google Sheets or Data Studio | ~100 marketing platforms | $39/month and up | Low — designed for marketers, not engineers |
Why Improvado for Marketing Dashboards
Improvado is built specifically for marketing data — it's not a general BI tool adapted for marketing use. That focus shows up in:
• Pre-built marketing data model: Instead of manually mapping every field from every platform, Improvado's Marketing Cloud Data Model (MCDM) automatically structures data according to marketing semantics. Impressions, clicks, conversions, and spend map consistently across all platforms without custom configuration.
• Connector maintenance: When Google Ads changes its API (happens frequently), Improvado updates its connector. You don't write error-handling code or debug broken pipelines — data keeps flowing.
• No-code and full-code options: Marketers configure dashboards through a visual interface. Data engineers access full SQL for complex transformations. Both groups work in the same platform without fighting over who owns the data pipeline.
• AI-powered analytics: Improvado's AI Agent lets you ask questions in plain language — "which campaigns drove the most pipeline last quarter?" or "show me CPA trend by channel" — and get answers instantly without building new dashboard views.
Improvado isn't ideal for teams running fewer than five marketing platforms or organizations that need general-purpose BI beyond marketing analytics. But for marketing teams managing complex, multi-channel campaigns at scale, it eliminates the integration and maintenance work that typically consumes analyst time.
How to Measure Whether Your Dashboard Is Working
A dashboard isn't successful just because it exists. It's successful when it changes decisions. Track these signals to know if your dashboard delivers value:
• Daily active users: How many team members open the dashboard each day? If it's not checked regularly, it's not useful.
• Time to insight: How long does it take someone to answer a question using the dashboard? If analysts still spend 30 minutes finding basic information, the layout needs work.
• Decision velocity: Are campaign optimizations happening faster? Can leadership approve or reject initiatives in meetings instead of waiting for follow-up analysis?
• Report request volume: Has the number of ad-hoc "can you pull this data?" requests decreased? If not, the dashboard isn't surfacing the information people need.
Survey your team quarterly: what questions does the dashboard answer well? What questions require workarounds? Use that feedback to guide iteration.
Conclusion
Multi-channel marketing dashboards eliminate the manual reporting work that keeps analysts from doing strategic work. Instead of spending hours exporting data and reconciling spreadsheets, you see unified performance across all channels in real time.
The key is treating dashboard development as infrastructure, not a one-time project. Connect platforms reliably, standardize naming conventions, build transformation logic that ensures consistent metrics, and design views for each audience's needs. When the foundation is solid, dashboards evolve with your strategy instead of becoming outdated artifacts.
For teams managing complex, multi-platform campaigns, purpose-built marketing data platforms handle integration, transformation, and governance automatically. That frees analysts to focus on insights — what the data means and what to do about it — instead of fighting with data pipelines.
Frequently Asked Questions
How long does it take to build a multi-channel marketing dashboard?
Implementation time depends on how many data sources you're connecting and whether you're building custom transformation logic. Teams using pre-built connectors and standard metrics typically have functional dashboards within a week. Custom API integrations or complex attribution models can extend that to several weeks. The biggest delays come from poor data governance — if your campaigns lack consistent naming conventions or UTM parameters, you'll spend significant time cleaning data before it's dashboard-ready.
How often should dashboard data refresh?
It depends on how quickly you need to react to changes. Real-time dashboards refresh hourly or more frequently — useful for performance marketing teams making daily optimization decisions. Executive dashboards often refresh daily or weekly since leadership isn't making hour-by-hour tactical changes. Balance freshness with infrastructure cost — more frequent refreshes consume more API calls and processing resources.
What's the best attribution model for multi-channel campaigns?
There's no universal best model — the right choice depends on your sales cycle and business goals. B2B companies with long, complex sales cycles often prefer time-decay or position-based attribution because they recognize that multiple touches over weeks or months contribute to conversion. E-commerce companies with short purchase cycles might use last-click attribution since buying decisions happen faster with fewer touchpoints. Most teams benefit from comparing multiple models side-by-side to understand how attribution methodology affects channel valuation.
Do I need a data warehouse for marketing dashboards?
Not necessarily, but warehouses help when you're connecting many platforms or storing historical data long-term. Dashboards can pull data directly from platform APIs for small-scale implementations. As data volume grows, API rate limits and latency become bottlenecks — warehouses solve this by storing a copy of your data locally where dashboards can query it faster. Warehouses also enable complex joins and transformations that are difficult to perform in real-time API calls.
Can I use Google Analytics 4 as my multi-channel dashboard?
GA4 works well for website behavior and traffic source analysis, but it has limitations for cross-platform marketing analytics. It doesn't natively pull spend data from ad platforms — you'll see clicks and sessions but not how much you paid for them unless you import cost data manually. It also lacks deep integration with CRM, email platforms, and non-Google ad networks. GA4 is a strong component of your analytics stack, but most teams need additional tools to get a complete multi-channel view.
Why do my dashboard numbers not match platform numbers?
Data discrepancies happen for several reasons: platforms count conversions differently (some count view-through conversions, others only count clicks), attribution windows vary (7-day vs 28-day lookback periods), time zones differ across platforms, and some platforms update data retroactively while others finalize immediately. To minimize discrepancies, standardize conversion definitions, use consistent attribution windows across platforms, align time zones, and understand each platform's reporting methodology. Perfect alignment across all platforms is rare — focus on consistent definitions within your dashboard so trend analysis remains valid even if absolute numbers differ slightly from platform UIs.
What's the first step if I'm starting from scratch?
Start by documenting your current reporting process. What questions do stakeholders ask weekly? Which platforms do you log into daily? What metrics appear in every executive presentation? That audit shows you what your dashboard must include to replace manual workflows. Then prioritize connecting your highest-volume platforms first — typically Google Ads, Meta, and your CRM. Get those three flowing into a simple dashboard before expanding to additional sources. Early wins build momentum and prove ROI before you invest in comprehensive integration.

