
Marketing teams invest heavily in campaigns but often can't pinpoint where prospects disappear. A typical B2B funnel loses 75% of MQLs before they're accepted as SQLs, yet most dashboards only show aggregate traffic or revenue — not the stage-by-stage leakage that matters.
A marketing funnel dashboard is built to solve this visibility gap. It transforms disconnected data from ad platforms, CRMs, and web analytics into a unified view of how prospects move through each stage — from first touch to closed deal. When designed correctly, it reveals not just what's broken, but exactly where to intervene.
This guide walks you through the architecture, metrics, build process, and tool selection for funnel dashboards that actually change behavior. You'll see the KPIs that matter at each stage, the data integration challenges that trip up most implementations, and how analytics teams at mid-market and enterprise companies structure dashboards for both executive reporting and operational troubleshooting.
Key Takeaways
✓ A marketing funnel dashboard tracks stage-by-stage conversion rates across the buyer journey — from anonymous visitor to closed customer — and surfaces drop-off points that aggregate metrics hide.
✓ 68% of businesses have not fully defined or documented their sales funnel strategy, which makes building a dashboard harder than the technical integration itself.
✓ The most actionable dashboards segment funnels by campaign, channel, persona, and time cohort — not just a single aggregate view — because conversion rates vary dramatically by source.
✓ Data integration is the highest-effort component: ad platforms, web analytics, marketing automation, and CRM must feed a unified schema with consistent UTM tagging and lead lifecycle definitions.
✓ Effective funnel dashboards require governance rules — duplicate lead handling, attribution window logic, and deal stage progression validation — or the visualizations mislead more than they inform.
✓ Marketing Data Analysts should design two dashboard layers: an executive summary for stakeholders focused on pipeline health, and an operational view for campaign managers focused on tactical fixes.
What Is a Marketing Funnel Dashboard and Why It Matters
A marketing funnel dashboard is a data visualization interface that tracks prospects as they move through defined stages of the buying journey. Unlike a generic marketing dashboard that aggregates metrics like impressions or clicks, a funnel dashboard is stage-aware: it measures conversion rates between each step and calculates time-to-progress for cohorts.
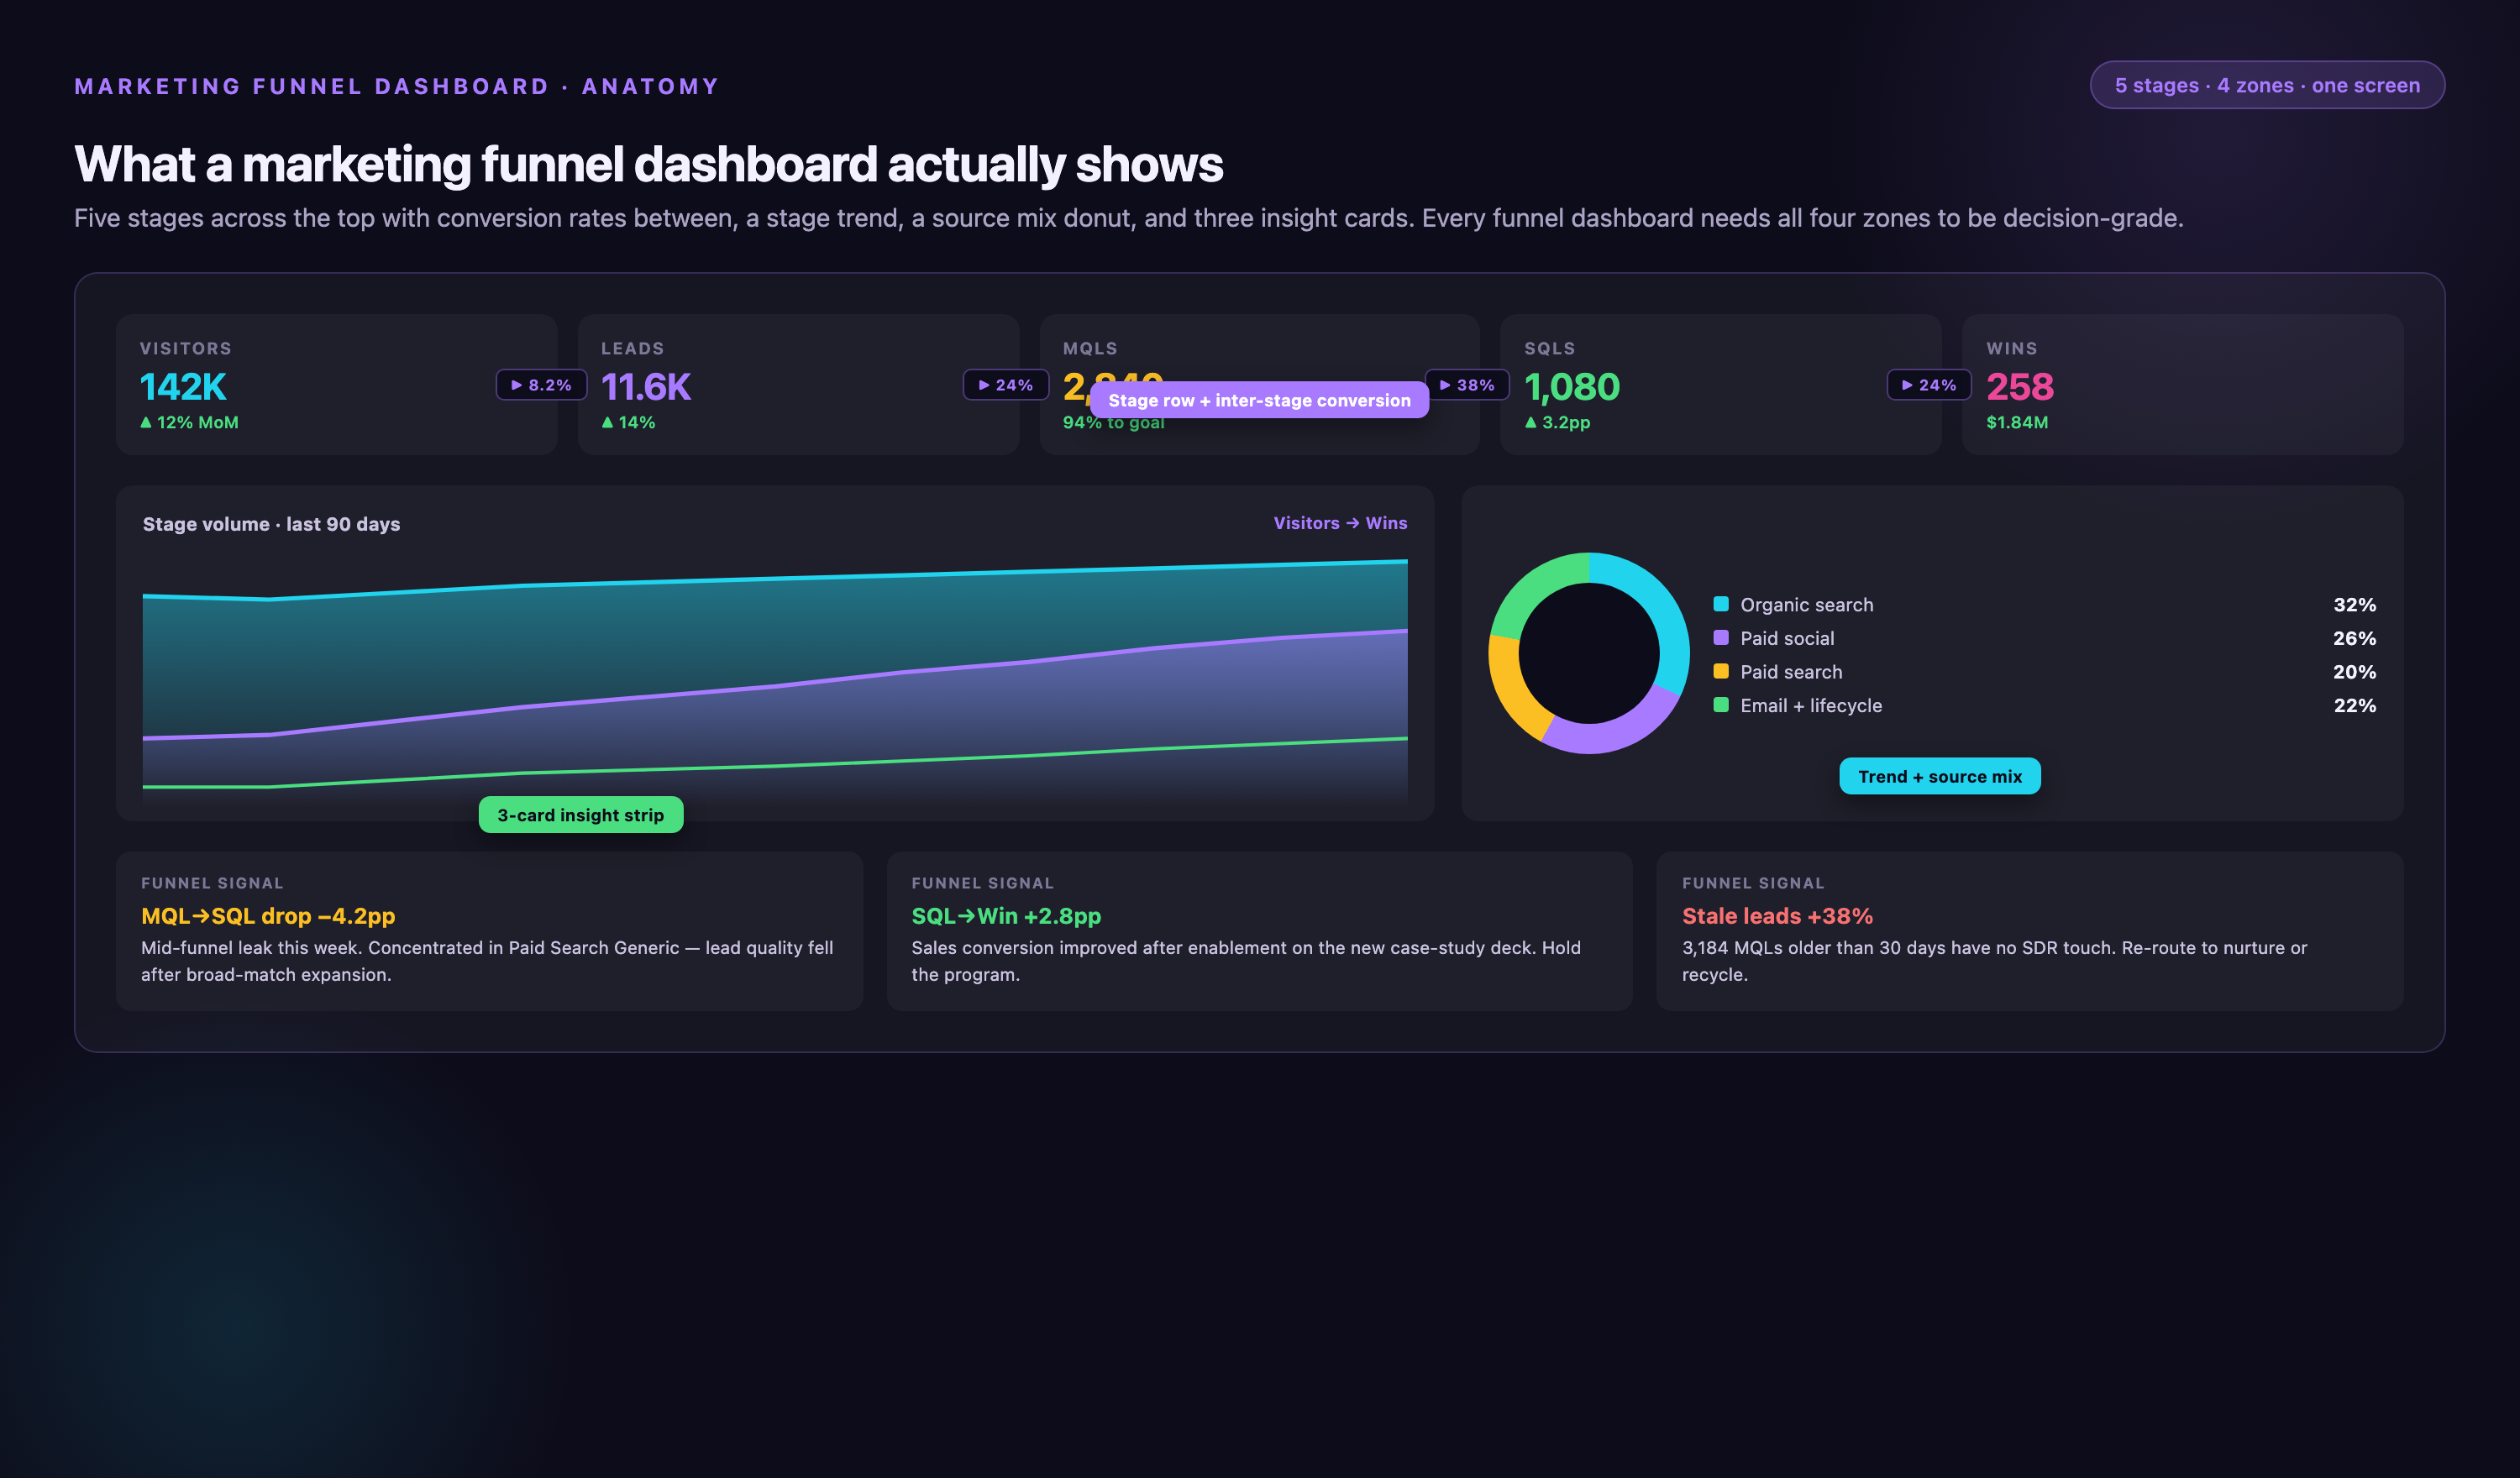
The core job of the dashboard is to answer three questions most marketing reports ignore: Where are we losing the most prospects? Which campaigns or channels generate leads that actually convert downstream? How long does it take a lead to move from one stage to the next, and is that timeline accelerating or decelerating?
For Marketing Data Analysts, the funnel dashboard is both a diagnostic tool and a strategic asset. When a VP of Marketing asks why pipeline is down, the dashboard should point to a specific stage — not just "traffic is flat" but "MQL-to-SQL conversion dropped 8 points in Q4, isolated to paid search cohorts." That level of specificity changes the conversation from vague optimization talk to concrete intervention.
The tactical value is equally high. Campaign managers use funnel dashboards to kill underperforming experiments faster, double down on channels with strong late-stage conversion, and reallocate budget mid-quarter based on cohort performance. Without stage-level visibility, teams optimize for vanity metrics — more MQLs, more traffic — that don't correlate with revenue.
Stage Definitions and Conversion Metrics That Actually Matter
Before you build the dashboard, you need a documented funnel model. 68% of businesses haven't done this, which is why most funnel dashboards end up as glorified traffic charts. Your data model must define what qualifies a prospect for each stage, what event or score triggers stage progression, and who owns the handoff logic.
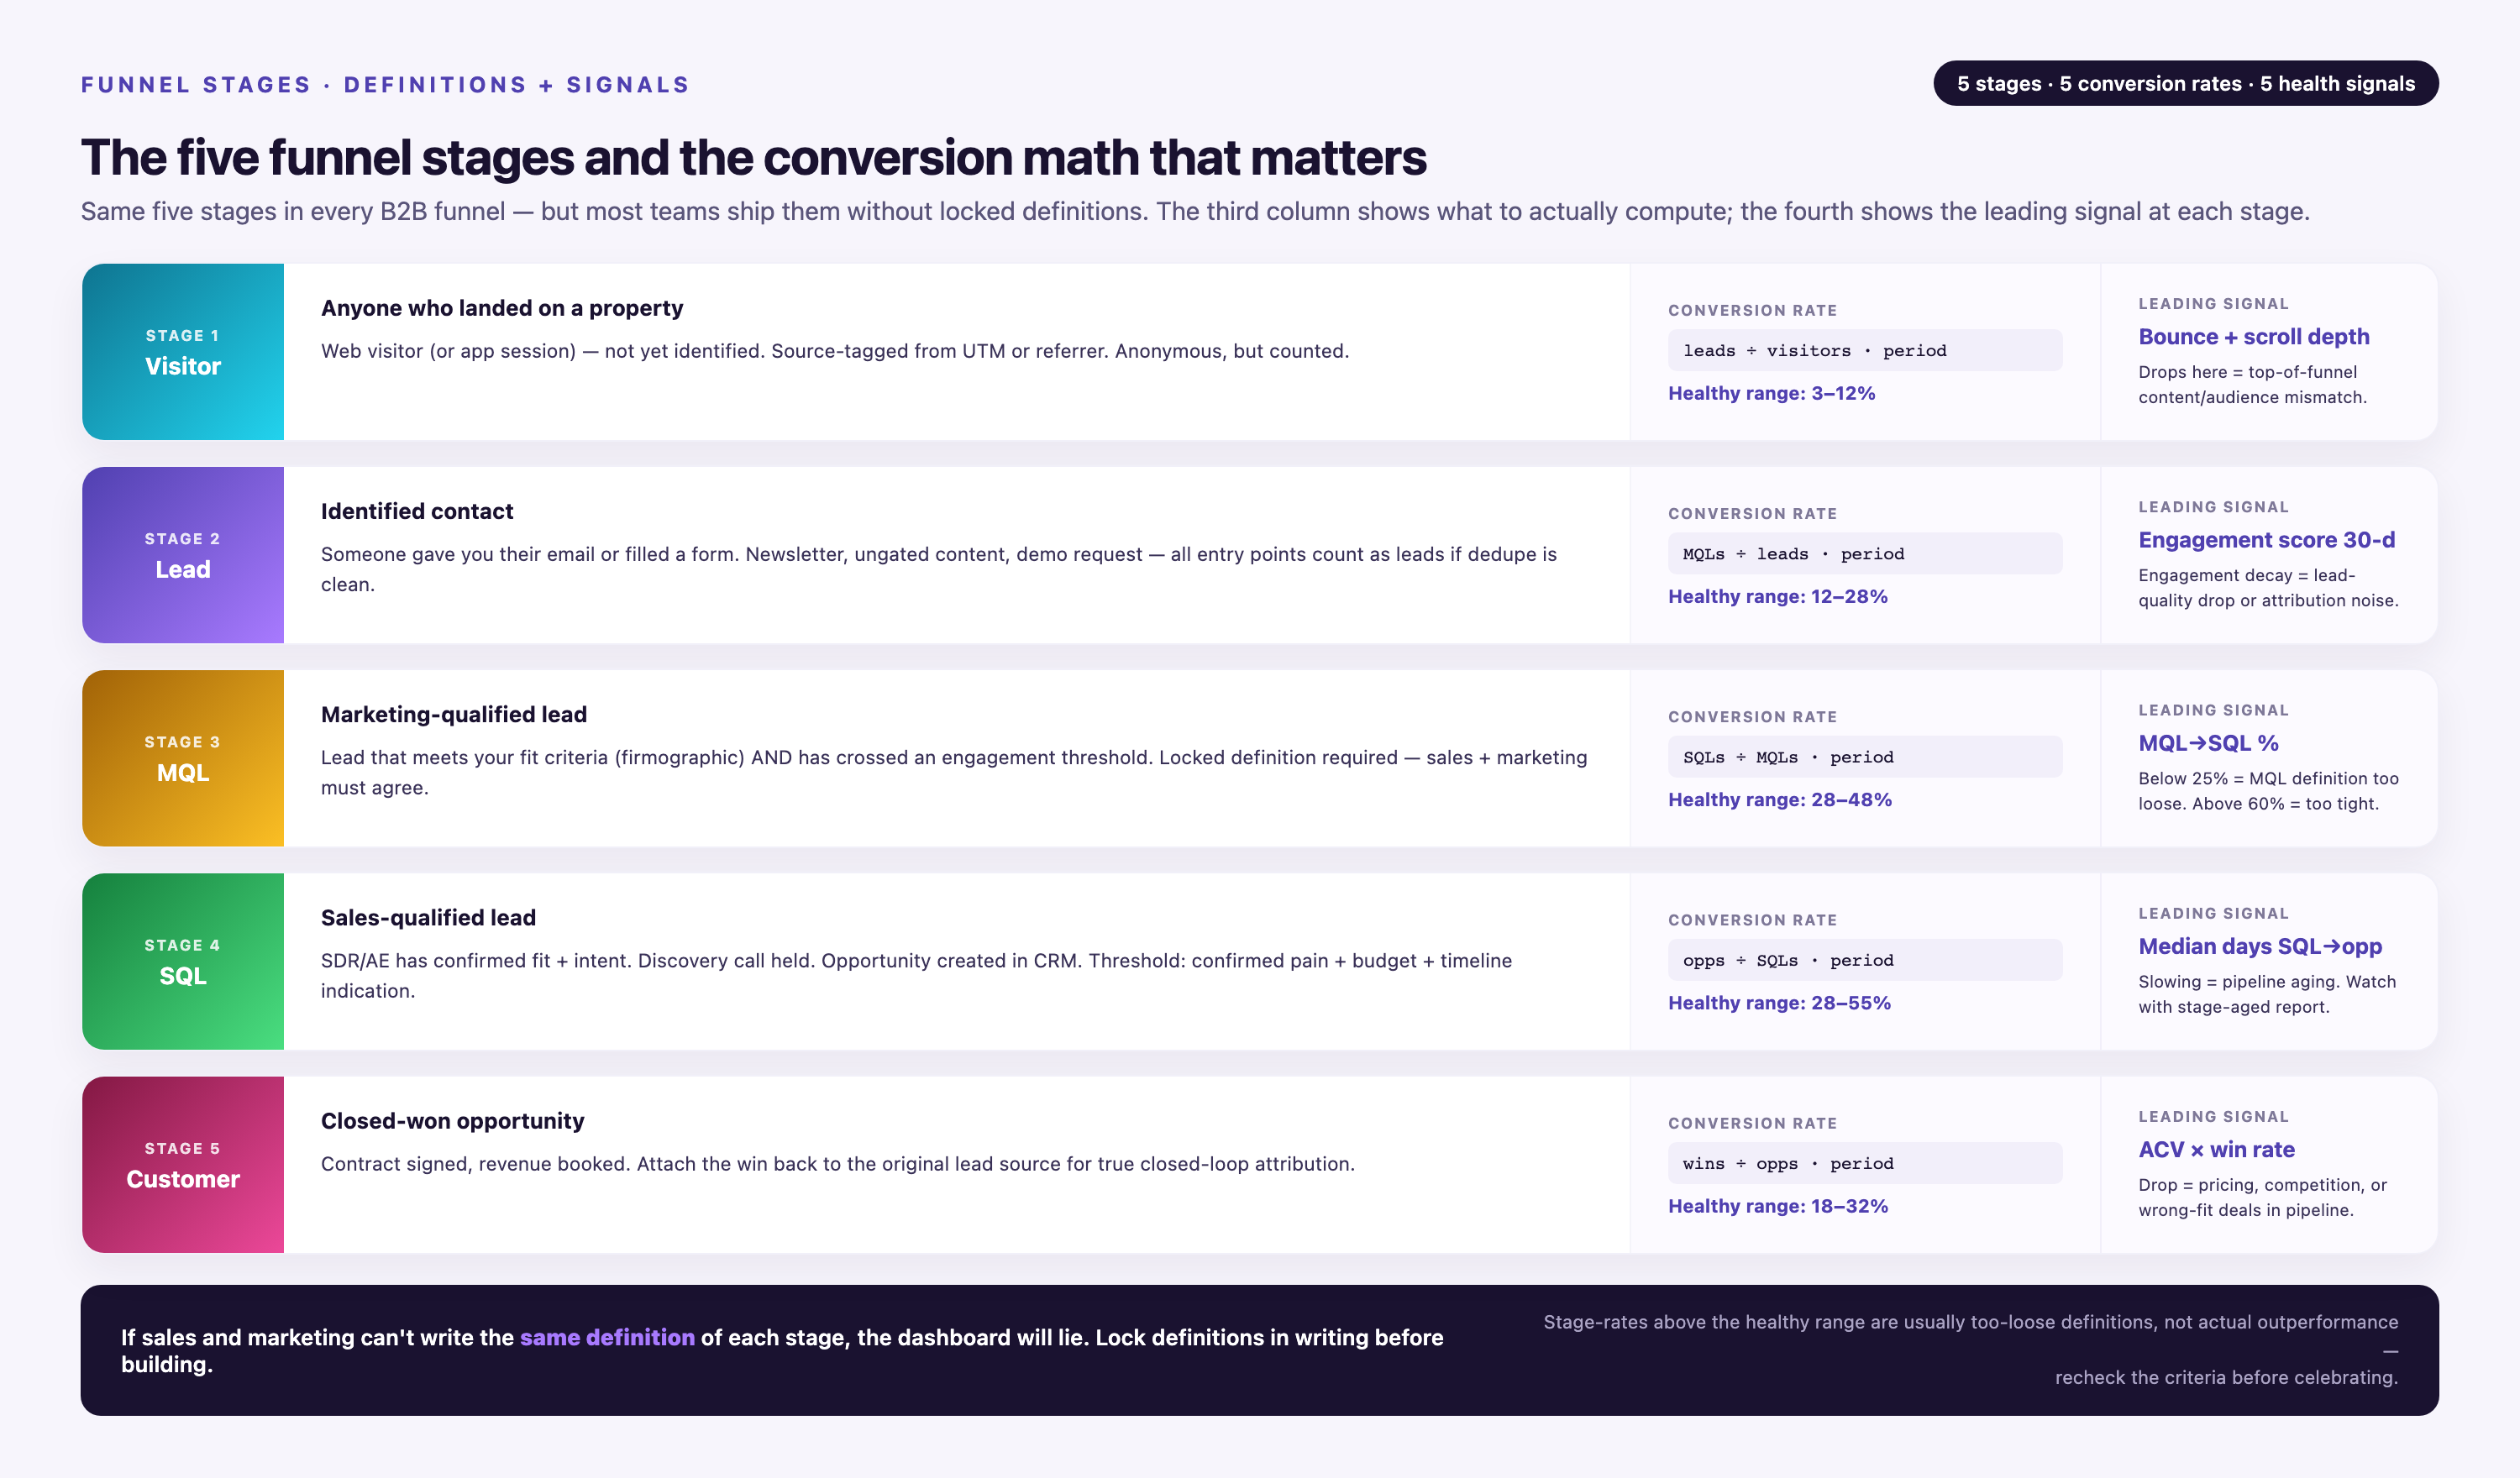
Common B2B Funnel Stages and Benchmark Conversion Rates
| Stage | Definition | Conversion to Next Stage (Benchmark) | Key Drop-off Signal |
|---|---|---|---|
| Visitor | Anonymous web traffic from any source | 1.2–2.8% to Lead | High bounce rate on key landing pages |
| Lead | Contact info captured (form, demo request, content download) | 10–14% to MQL | Low engagement score or no follow-up activity |
| MQL | Marketing-qualified based on behavior score or firmographic fit | 28–32% to SQL | 75% never accepted by sales |
| SQL | Sales-accepted lead, outreach initiated | 45–55% to Opportunity | No meeting booked within 7 days of acceptance |
| Opportunity | Active deal in CRM with defined value and close date | 24–28% to Closed-Won | Stalled deals beyond average sales cycle length |
| Customer | Closed-won, contract signed | Net Revenue Retention (NRR) 115–125% for SaaS | Low product adoption or no expansion activity in first 90 days |
These benchmarks vary by industry, deal size, and sales motion. Enterprise deals close at 31% versus 39% for SMB, and average sales cycles range from 90 to 180 days for mid-market B2B. Your dashboard should display your actuals alongside these benchmarks so stakeholders can assess performance in context.
Metrics to Track at Each Stage
• Visitor → Lead: Conversion rate by traffic source, landing page performance, form abandonment rate, time on site before conversion.
• Lead → MQL: Lead scoring distribution, engagement velocity (number of touches before qualification), lead source contribution to MQL volume.
• MQL → SQL: Sales acceptance rate, time to accept, reason codes for rejected MQLs, lead quality scores assigned by sales reps.
• SQL → Opportunity: Meeting-booked rate, discovery call completion rate, time from SQL to first opportunity creation, win rate by lead source.
• Opportunity → Closed-Won: Sales cycle length, deal size distribution, win/loss reasons, pipeline velocity (change in opportunity value over time).
• Customer Retention: Churn rate, expansion revenue, Net Revenue Retention, customer lifetime value (LTV), product usage metrics tied to renewal likelihood.
The dashboard should calculate these metrics not just in aggregate, but segmented by campaign, channel, persona, and time cohort. A single funnel view hides the fact that paid search converts to SQL at half the rate of organic, or that enterprise deals from field events take 40% longer to close than inbound demos.
Step 1: Define Your Funnel Model and Data Sources
Start with a documented funnel definition that all stakeholders agree on. This sounds obvious, but most dashboard projects fail here. Marketing thinks an MQL is anyone with a score above 50. Sales thinks an MQL is only someone who requested a demo. The CRM has five different "lead status" values that map to three funnel stages. Without alignment, your dashboard will produce numbers no one trusts.
Convene a working session with Marketing Ops, Sales Ops, and Revenue Operations. Map every lead lifecycle stage in your CRM to a funnel stage in the dashboard. Document the entry criteria: what score threshold, what form submission, what sales action triggers stage progression. Agree on attribution rules: first-touch, last-touch, multi-touch, or a custom model. Write it down in a shared document and get VP-level sign-off.
Data Sources You'll Need to Integrate
A complete marketing funnel dashboard pulls from at least six systems:
• Web analytics (Google Analytics, Adobe Analytics): Anonymous visitor traffic, session data, landing page performance, UTM parameter capture.
• Advertising platforms (Google Ads, Meta Ads, LinkedIn Ads): Campaign spend, impressions, clicks, attributed conversions, ad creative performance.
• Marketing automation (HubSpot, Marketo, Pardot): Lead records, behavior scores, email engagement, form submissions, campaign membership.
• CRM (Salesforce, HubSpot CRM, Microsoft Dynamics): Lead, contact, and opportunity records; sales rep activity; deal stages and close dates; win/loss data.
• Attribution tools (Bizible, Dreamdata, HockeyStack): Multi-touch attribution models, revenue attribution by channel, influenced pipeline.
• Data warehouse or customer data platform (Snowflake, BigQuery, Redshift): Unified customer profiles, deduplicated lead records, historical snapshots for cohort analysis.
The integration challenge is not just connectivity — it's schema alignment. Google Ads calls a conversion one thing, HubSpot calls it another, and Salesforce uses a third field name. UTM parameters are inconsistent across campaigns. Lead records exist in both the marketing automation platform and the CRM, sometimes with conflicting stage values. 72% of marketing teams struggle with funnel attribution because their data isn't clean enough to trust.
Marketing Data Analysts spend more time wrangling these integrations than building visualizations. If you're starting from scratch, budget several weeks just for data pipeline work. If you're using a platform like Improvado, the pre-built connectors and unified schema reduce this to days — but you still need to validate that your UTM tagging is consistent and your CRM lifecycle stages match your funnel definition.
Step 2: Build the Data Model and Transformation Layer
Once data is flowing from source systems, you need a transformation layer that normalizes field names, deduplicates records, and calculates stage conversions. This is where SQL, dbt, or an ETL tool does the heavy lifting.
Your data model should create a unified leads table with one row per unique contact, enriched with:
• First touch attribution (campaign, channel, UTM parameters, landing page)
• Last touch attribution (same fields, but for the most recent interaction before conversion)
• Multi-touch attribution weights (if you're using a custom model)
• Stage history (timestamp for each funnel stage entry, calculated dwell time)
• Campaign membership (all campaigns the lead interacted with, not just first or last)
• Firmographic and demographic data (company size, industry, role, geography)
The transformation logic must handle edge cases:
• Duplicate leads: Same person submits forms on multiple devices or browsers, creating multiple records. Your model should merge these based on email address and assign a single funnel progression.
• Stage regressions: A lead moves from SQL back to MQL because sales rejected it. Your dashboard should track rejection volume and reasons, not just forward progression.
• Attribution windows: A lead converts to opportunity 90 days after first touch. Should the dashboard credit the original campaign, or only interactions in the last 30 days? Document your logic and apply it consistently.
• Closed-loop reporting: Revenue data lives in the CRM, but campaign spend lives in ad platforms. Your model must join these datasets on a common key (usually lead ID or opportunity ID) to calculate ROI and cost-per-acquisition by channel.
If you're using a data warehouse, write these transformations in SQL or dbt and schedule them to run daily. If you're using a marketing analytics platform, the transformation layer may be pre-built — but you still need to configure your business rules.
Governance Rules That Prevent Garbage Dashboards
Improvado's Marketing Data Governance module includes over 250 pre-built validation rules that catch data quality issues before they reach the dashboard. These rules check for:
• Missing or malformed UTM parameters in campaign URLs
• Budget overruns flagged in real time (campaign spend exceeds approved budget)
• Duplicate lead records across systems with conflicting stage values
• Stale data (source systems haven't synced in over 24 hours)
• Schema drift (a platform API changes field names or data types without warning)
For Marketing Data Analysts building funnel dashboards without a governance layer, you'll need to write these checks manually. At minimum, add data quality tests that run before your dashboard refreshes: row counts by source, null value checks on critical fields, and anomaly detection for sudden conversion rate drops that signal broken tracking.
- →Sales and marketing report different MQL counts in the same meeting — no one trusts the numbers
- →You can see total lead volume but have no idea which campaigns generate leads that actually close
- →It takes your team 3+ hours to manually pull funnel data from five different tools for a single report
- →Your CRM shows opportunity pipeline but you can't tie it back to the campaigns that sourced the leads
- →Conversion rates look fine in aggregate, but you suspect certain channels are hemorrhaging prospects and you can't prove it
Step 3: Design the Dashboard Layout and Visualizations
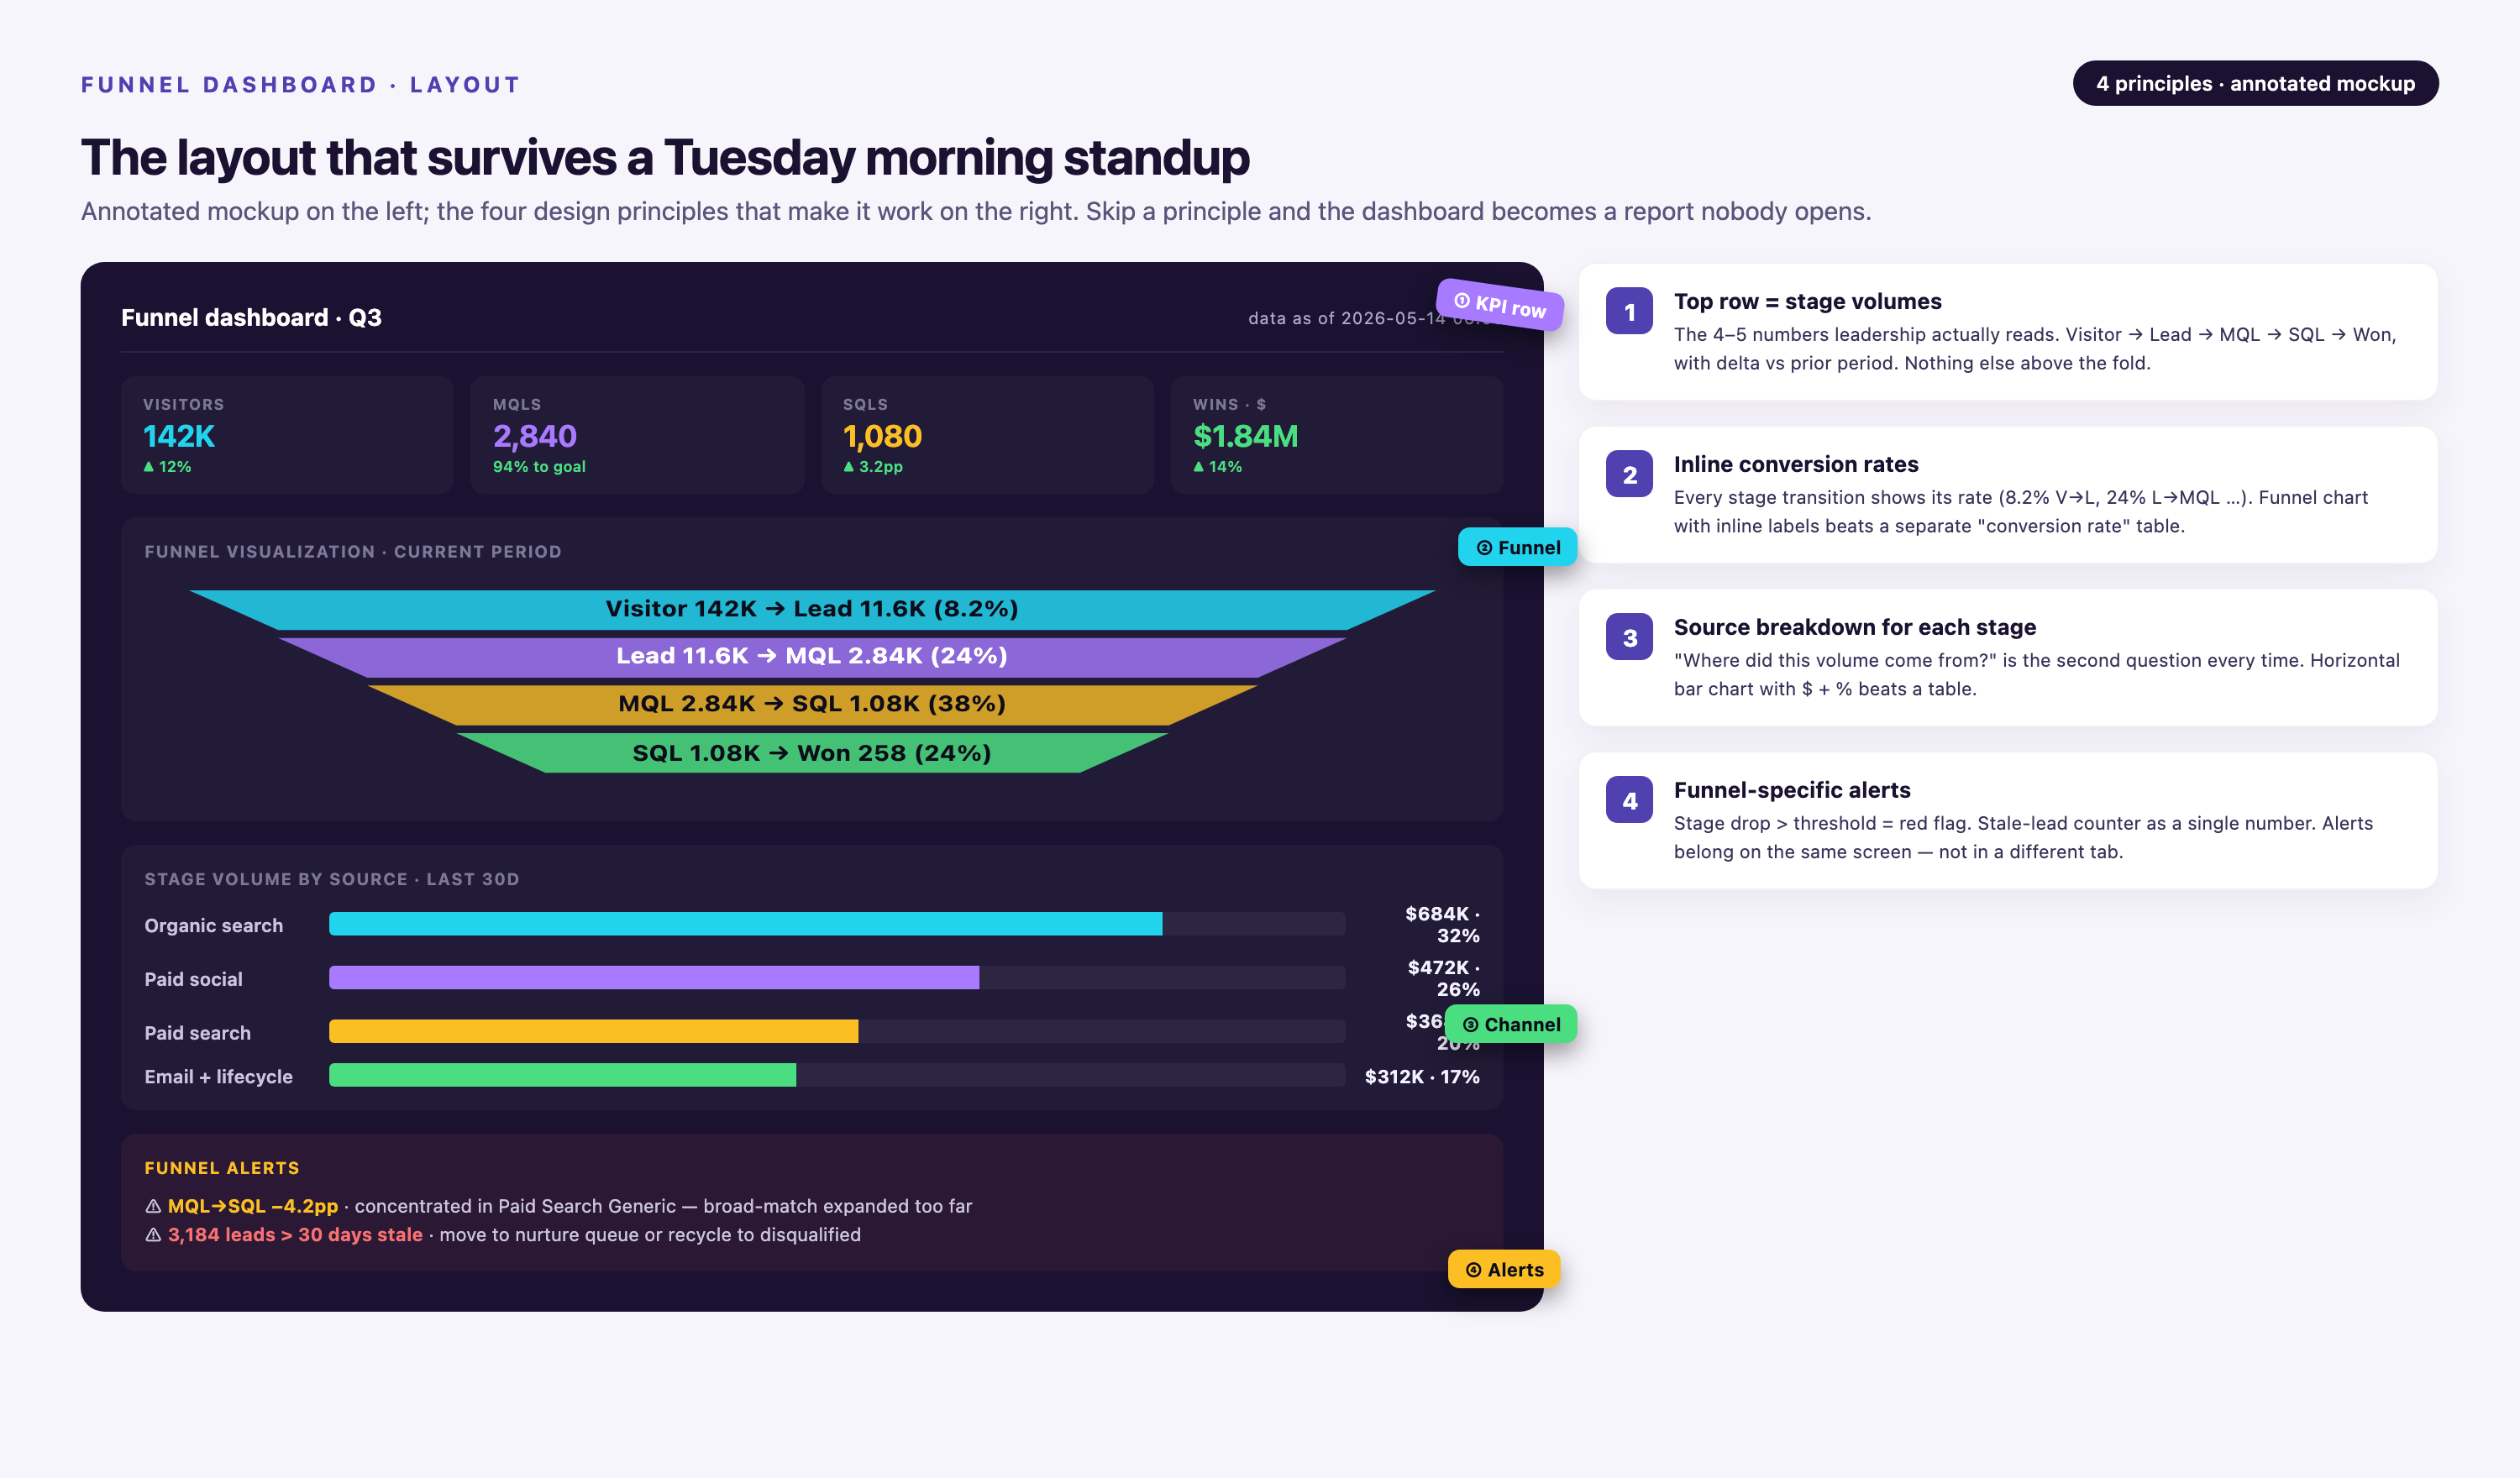
A marketing funnel dashboard should have two views: an executive summary and an operational drill-down. The executive view shows funnel health at a glance — total volume at each stage, conversion rates, and trend lines. The operational view lets campaign managers filter by channel, campaign, time period, and cohort to diagnose specific problems.
Executive Summary Layout
Top section: overall funnel visualization (horizontal or vertical bar chart showing volume at each stage, with conversion rates displayed between bars). Use color coding: green for stages exceeding benchmark, red for underperforming stages.
Second section: key metrics in scorecards — total pipeline generated this quarter, average sales cycle length, cost per SQL, overall lead-to-customer conversion rate. Each scorecard should show current value, prior period comparison, and year-over-year change.
Third section: trend charts — funnel volume and conversion rates over time (weekly or monthly). Stakeholders want to see if performance is improving or degrading. Add a benchmark line so they can compare your actuals to industry standards.
Operational Drill-Down Layout
Left sidebar: filters for campaign, channel (paid search, paid social, organic, email, events, direct), lead source, persona, geography, and date range. These filters should cascade — selecting a campaign auto-filters to the relevant channel.
Main panel: segmented funnel views. Show multiple funnels side-by-side so users can compare paid search versus organic, or enterprise versus SMB. This reveals that organic traffic has a 3x higher SQL conversion rate, or that enterprise deals take twice as long to close.
Bottom panel: detailed data table with one row per lead or opportunity, filterable and sortable. Campaign managers use this to export lists of stalled opportunities or rejected MQLs for follow-up.
Right sidebar: drop-off analysis. For each funnel stage, display the top reasons leads don't progress: low engagement score, missing contact info, sales rep didn't follow up, or lead requested "not now." This turns the dashboard from a reporting tool into a prioritization tool.
Chart Types That Work for Funnel Data
• Horizontal funnel chart: Classic funnel shape, width of each bar represents volume, arrows show conversion rates.
• Sankey diagram: Shows lead flow from multiple sources through stages, with branch thickness representing volume. Useful when you have many entry points (paid, organic, referral, event, etc.).
• Cohort retention grid: Rows are time cohorts (leads acquired in Jan, Feb, Mar), columns are weeks or months since acquisition, cells show what percentage of each cohort reached SQL, Opportunity, or Closed-Won. Reveals if recent cohorts are converting faster or slower than older ones.
• Waterfall chart: Displays cumulative pipeline growth over time, with bars showing how much pipeline was added each period and how much converted or churned out.
• Scatter plot: X-axis is cost per lead, Y-axis is lead-to-customer conversion rate, each point is a campaign. Helps identify high-ROI campaigns (low cost, high conversion) versus vanity plays (cheap leads that never close).
Step 4: Implement Refresh Cadence and Alerting
Funnel dashboards are useless if the data is stale. Ad spend updates every hour. Web analytics updates near real-time. CRM opportunity data might only sync once a day. Your refresh cadence should match the urgency of the decisions being made.
For operational dashboards used by campaign managers, refresh every 4–6 hours. They need to see yesterday's performance to adjust today's budget. For executive dashboards reviewed in weekly pipeline meetings, daily refresh is sufficient.
Set up automated alerts for anomalies:
• Conversion rate at any stage drops below threshold (e.g., MQL-to-SQL falls below 25%)
• Campaign spend exceeds approved budget by more than 10%
• No new leads generated from a major channel in the last 24 hours (signal of broken tracking)
• Average time-to-progress increases by more than 20% week-over-week (signal of process bottleneck)
Alerts should go to the person who can fix the issue — not just a generic email alias. If paid search conversion drops, notify the paid search manager. If sales reps aren't accepting MQLs, notify the sales operations lead.
Step 5: Validate and Iterate with Stakeholders
Before you roll out the dashboard to the full marketing and sales org, run a pilot with 3–5 power users. Give them access for two weeks and ask them to use it in their daily workflow. Schedule a feedback session at the end of the pilot.
Common issues that surface in pilots:
• Conversion rate calculations don't match what stakeholders see in their source systems (usually caused by attribution window differences or date range mismatches)
• Critical filters are missing (e.g., campaign managers need to filter by ad creative or audience segment, not just campaign name)
• Dashboard is too slow to load (query optimization needed, or data model needs pre-aggregated summary tables)
• Stakeholders don't trust the numbers (usually a data quality issue upstream — UTM tagging is inconsistent, or CRM stage definitions changed mid-quarter without documentation)
Fix these issues before the full rollout. A dashboard that's "close enough" will be ignored. Stakeholders need to trust the numbers completely, or they'll default back to their old spreadsheets.
After launch, schedule monthly review sessions with the marketing and sales leadership team. Review which metrics they're actually using, which views they ignore, and what questions the dashboard still doesn't answer. Add new segments or metrics based on this feedback. A funnel dashboard is never "done" — it evolves as your marketing strategy and data sources change.
Common Mistakes to Avoid When Building Funnel Dashboards
Even experienced Marketing Data Analysts make predictable errors when building funnel dashboards. Here are the failure modes to watch for:
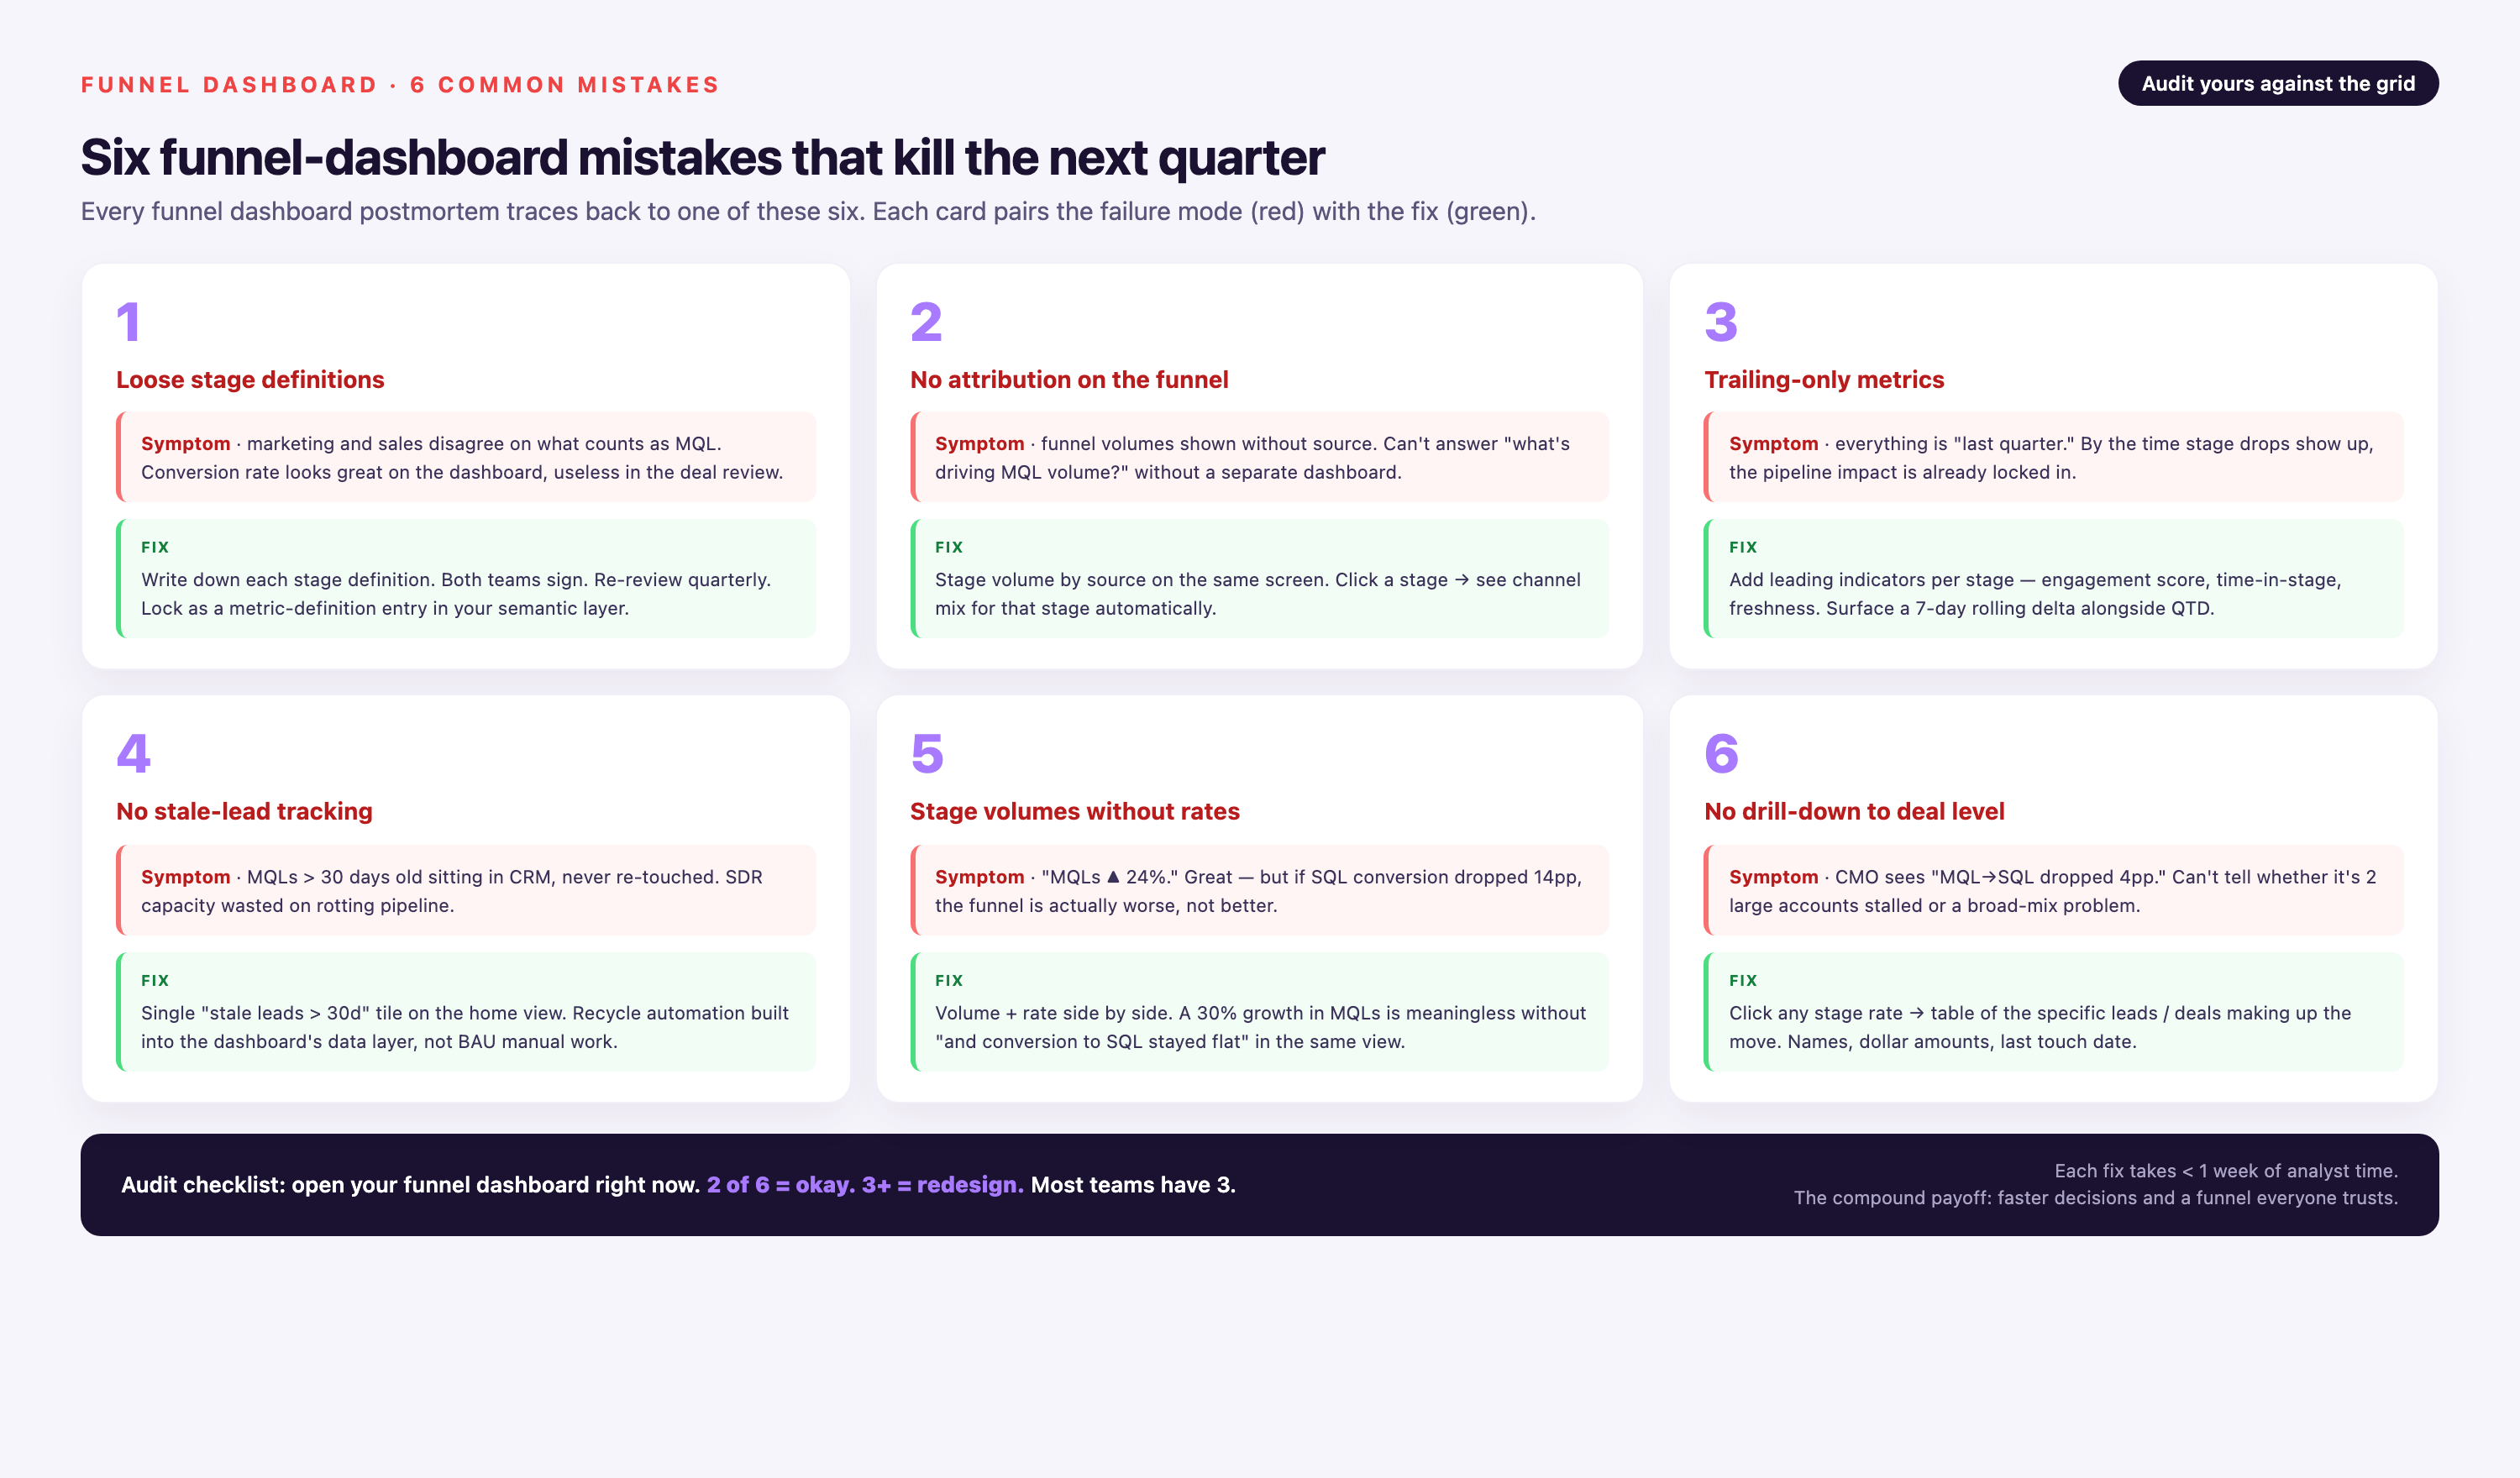
Mistake 1: Building the dashboard before defining the funnel model. You can't visualize stage progression if you haven't documented what each stage means and what triggers a lead to move between stages. Start with the business logic, then build the technical implementation.
Mistake 2: Using only aggregate funnels. A single funnel view that combines all traffic sources and campaigns hides the performance differences that matter. Paid search might convert to SQL at 5%, while organic converts at 15%. Your dashboard must support segmentation by channel, campaign, persona, and time cohort.
Mistake 3: Ignoring time-to-convert metrics. Volume and conversion rates tell you how many leads progress, but not how fast. A campaign that generates 100 MQLs in a week looks great — until you discover those leads take 6 months to close, while another campaign's leads close in 30 days. Track dwell time at each stage and surface it prominently.
Mistake 4: Not validating data quality before launch. Stakeholders will immediately spot discrepancies between the dashboard and their source systems. If your Salesforce report shows 500 SQLs this quarter but the dashboard shows 485, trust evaporates. Run reconciliation checks and document any differences before you share the dashboard.
Mistake 5: Making the dashboard read-only. The most valuable funnel dashboards let users drill down into the underlying data, export lists of leads for follow-up, and save custom views. If users can't interact with the data, they'll build their own spreadsheets instead of using your dashboard.
Mistake 6: Overcomplicating the visualizations. A funnel dashboard should answer questions in 10 seconds. If stakeholders need training to interpret a chart, simplify it. Use standard chart types (bar, line, funnel) and reserve exotic visualizations (Sankey, sunburst) for advanced users.
Mistake 7: Not accounting for lead recycling. Leads that are rejected by sales often get nurtured and re-qualified later. If your dashboard only tracks forward progression, you're undercounting the true value of nurture programs. Track stage transitions in both directions and measure re-qualification rates.
Mistake 8: Treating all conversions equally. A visitor who converts to a lead by downloading a white paper is not the same as one who requests a demo. Your funnel model should distinguish between high-intent and low-intent conversions, and your dashboard should segment accordingly.
Tools and Platforms for Marketing Funnel Dashboards
You have three paths to building a marketing funnel dashboard: custom-built in a BI tool, templated in a marketing analytics platform, or pre-built in a marketing data platform with native funnel models. Each has trade-offs.
Option 1: Custom-Built in a BI Tool
If you have a data engineering team and a mature data warehouse, you can build funnel dashboards in Looker, Tableau, Power BI, or Metabase. This gives you total control over data models and visualizations, but requires the most engineering effort.
You'll need to:
• Write ETL pipelines to extract data from ad platforms, web analytics, marketing automation, and CRM
• Transform and normalize data in your warehouse (SQL, dbt, or Airflow)
• Build a semantic layer that defines funnel stages, conversion logic, and attribution rules
• Design dashboard views and set up refresh schedules in the BI tool
This path works if you already have data engineers on staff and a modern data stack (Snowflake, BigQuery, Fivetran, dbt). It doesn't work if marketing needs the dashboard in the next two weeks and IT has a 6-month backlog.
Option 2: Templated in a Marketing Analytics Platform
Platforms like Google Analytics 4, HubSpot, and Marketo offer built-in funnel reports. These are fast to set up — often just enabling a feature flag — but limited in flexibility. You're constrained by the platform's stage definitions, can't customize attribution logic, and can't pull in data from systems the platform doesn't integrate with.
Google Analytics 4 has a funnel exploration report that tracks visitor-to-conversion paths on your website, but it doesn't know about your CRM opportunity data. HubSpot's deal stage reporting shows pipeline progression, but doesn't tie back to ad spend in Google Ads unless you manually upload cost data. These tools are fine for small teams with simple funnels, but break down at scale.
Option 3: Purpose-Built Marketing Data Platform
Platforms like Improvado, Funnel.io, and Windsor.ai are designed specifically for marketing analytics. They handle data integration, transformation, and funnel modeling out of the box, so Marketing Data Analysts can focus on insights instead of ETL.
| Tool | Best For | Funnel Capabilities | Pricing | Limitations |
|---|---|---|---|---|
| Improvado | Mid-market and enterprise B2B companies with complex multi-touch attribution needs | Pre-built Marketing Cloud Data Model with funnel stages and conversion logic. 1,000+ data connectors, governed data pipeline with 250+ validation rules, AI Agent for conversational analytics. Compatible with any BI tool. | Custom pricing based on data volume and connector count | Not ideal for small teams with simple funnels that only need basic Google Analytics reporting |
| Funnel.io | Mid-market B2C and e-commerce teams focused on paid advertising performance | Aggregates ad spend and conversions from major platforms. Strong on ROAS and CAC by channel, weaker on CRM and late-stage funnel. | Starts around $1,000/month, scales with data sources | Limited support for B2B CRM data and custom attribution models |
| Windsor.ai | Small to mid-market teams needing fast setup for ad channel reporting | Pre-built connectors for major ad platforms, simple funnel views for traffic to conversion. Limited customization. | Starts around $200/month | Shallow integration depth, no data governance layer, weak on multi-stage B2B funnels |
| Google Analytics 4 | Website-focused conversion tracking for teams with no budget for paid tools | Funnel exploration reports for on-site behavior, event-based conversion tracking | Free | No CRM data, no multi-touch attribution, data sampling at scale, limited to Google ecosystem |
| HubSpot | Small to mid-market B2B teams already using HubSpot CRM | Deal stage reporting, campaign attribution within HubSpot ecosystem | Included with Marketing Hub Professional ($800/month) or Enterprise ($3,200/month) | Siloed to HubSpot data, 4.2/5 on G2 with users citing limited reporting flexibility |
Improvado stands out for enterprise teams because of its depth. The platform doesn't just connect data sources — it normalizes them into a marketing-specific schema (the Marketing Cloud Data Model) that includes pre-built funnel logic. When you connect Salesforce, Google Ads, and HubSpot, Improvado automatically maps lead stages, attribution touchpoints, and conversion events without custom SQL. The governance layer catches data quality issues before they reach your dashboard, and historical data is preserved even when source platforms change their APIs.
For Marketing Data Analysts, this means you spend time analyzing funnel performance instead of debugging why Google Ads conversions don't match HubSpot form submissions. The platform supports any BI tool on the back end — Looker, Tableau, Power BI, or custom dashboards — so you're not locked into a proprietary visualization layer.
The trade-off is cost. Improvado is priced for mid-market and enterprise companies with significant ad spend and complex data needs. If you're a 10-person startup spending $5,000/month on ads, a lighter-weight tool or a custom Google Sheets setup makes more sense.
Advanced Funnel Dashboard Techniques for Mature Teams
Once you have a working funnel dashboard, there are several advanced techniques that unlock deeper insights.
Cohort Analysis for Conversion Velocity
Track leads not just by when they converted, but by when they entered the funnel. Group leads into monthly cohorts (all leads acquired in January, all leads acquired in February) and track what percentage of each cohort reaches SQL, Opportunity, and Closed-Won over time. This reveals if your funnel is getting faster or slower.
Example insight: February cohort converted to SQL at 35% within 30 days, but March cohort is only at 22% after 30 days. Dig into what changed — new lead sources with lower quality, scoring model adjustment, or sales team capacity issue.
Multi-Segment Funnels
Don't just segment by channel. Segment by persona, deal size, geography, and product line. Research shows that multi-funnel segmentation drives 23% higher revenue per lead. A SaaS company might discover that enterprise prospects from field events convert at 50% to opportunity, while SMB prospects from paid search convert at 15% — but the SMB deals close faster and have higher NRR.
Attribution Model Comparison
Run multiple attribution models in parallel — first-touch, last-touch, linear, time-decay, and custom — and display them side-by-side in the dashboard. This shows how much credit each channel gets under different models. You might find that paid search looks great on last-touch (it's the final click before conversion) but contributes little on first-touch (prospects discover you through organic content). This informs budget allocation strategy.
Predictive Funnel Scoring
Use historical conversion data to train a lead scoring model that predicts which MQLs are most likely to become customers. Surface these scores in the dashboard so sales reps prioritize high-probability leads. Over time, track whether your scoring model's predictions match reality and retrain the model as needed.
Closed-Loop ROI by Campaign
Join ad spend data from ad platforms with closed-won revenue data from the CRM, attributed back to the original campaign. Calculate true ROI: revenue generated divided by campaign cost. Rank campaigns by ROI and surface the top and bottom performers. This is harder than it sounds because you need clean attribution data and a long enough time window for deals to close — but it's the metric that justifies marketing budget.
Real-World Use Cases: How Teams Use Funnel Dashboards
Use Case 1: Diagnosing MQL rejection rate spike
A B2B SaaS company saw SQL volume drop 20% quarter-over-quarter. The marketing team insisted lead volume was up. The funnel dashboard revealed the issue: MQL volume was indeed up 15%, but sales was rejecting 60% of MQLs (up from 40% the prior quarter). Drilling into rejection reasons, the majority were flagged as "not a fit" or "unresponsive." Root cause: marketing had loosened lead scoring thresholds to hit a volume target, flooding sales with low-quality leads. The team tightened scoring rules and SQL volume recovered within 4 weeks.
Use Case 2: Reallocating budget from high-volume to high-conversion channels
An enterprise software company ran a dashboard analysis comparing paid search, paid social, and sponsored content. Paid social generated 3x more MQLs than sponsored content, so marketing had been shifting budget toward social. The funnel dashboard showed that sponsored content MQLs converted to opportunity at 45%, while paid social MQLs converted at 12%. Switching the lens from MQL volume to opportunity volume, sponsored content was the better investment. The team reallocated 30% of paid social budget to sponsored content and saw a 15% increase in pipeline despite lower MQL volume.
Use Case 3: Identifying sales follow-up gaps
A mid-market company tracked time-to-first-touch after SQL acceptance. The dashboard showed that 35% of SQLs weren't contacted by a sales rep within 7 days. These leads had a 70% lower opportunity conversion rate than leads contacted within 48 hours. Sales operations used the dashboard to flag at-risk SQLs daily and reassign them to available reps. Opportunity conversion rate increased 8 points in two quarters.
Conclusion
A marketing funnel dashboard is the difference between guessing which campaigns drive revenue and knowing with precision where your funnel leaks and how to fix it. For Marketing Data Analysts, building one requires equal parts technical execution — data integration, transformation, visualization — and business alignment — defining stages, agreeing on metrics, and earning stakeholder trust in the numbers.
The most common failure mode is building the dashboard before defining the funnel model. The most common success factor is stakeholder buy-in: when marketing and sales leadership agree on stage definitions and use the dashboard to make decisions, it becomes the single source of truth for pipeline health.
Start with a pilot. Pick one segment — a single campaign, a single channel, or a single persona — and build a minimum viable dashboard that tracks that funnel from top to bottom. Validate the data, test it with stakeholders, and iterate. Once the pilot proves valuable, expand to the full marketing funnel and layer in advanced techniques like cohort analysis and multi-touch attribution.
The goal is not a perfect dashboard on day one. The goal is a dashboard that changes behavior: campaigns get killed faster, budget flows to high-ROI channels, and sales follows up on the leads most likely to close. When your dashboard does that, it stops being a reporting tool and becomes a strategic asset.
Frequently Asked Questions
What is a marketing funnel dashboard?
A marketing funnel dashboard is a data visualization tool that tracks prospects as they move through defined stages of the buyer journey — from initial awareness to closed customer — and displays conversion rates, volume, and time-to-progress at each stage. Unlike generic marketing dashboards that show aggregate metrics, funnel dashboards are stage-aware and reveal where prospects drop off, which campaigns generate leads that actually convert downstream, and how long it takes cohorts to move through the funnel. For B2B marketing teams, this visibility is critical for diagnosing pipeline problems and reallocating budget to high-ROI channels.
What metrics should a marketing funnel dashboard track?
A complete marketing funnel dashboard tracks stage-by-stage conversion rates (visitor-to-lead, lead-to-MQL, MQL-to-SQL, SQL-to-opportunity, opportunity-to-closed-won), time spent at each stage, cost per stage progression, drop-off volume and reasons, pipeline velocity (rate of change in opportunity value), and closed-loop ROI by campaign and channel. The dashboard should display these metrics both in aggregate and segmented by campaign, channel, persona, deal size, and time cohort. Advanced dashboards also track cohort retention curves and predictive lead scores to help sales prioritize follow-up.
How long does it take to build a marketing funnel dashboard?
Timeline depends on data maturity and tooling. If you have a data warehouse, clean UTM tagging, and aligned funnel definitions, a skilled Marketing Data Analyst can build a working dashboard in 2–3 weeks using a BI tool. If you're starting from scratch — integrating ad platforms, web analytics, marketing automation, and CRM; normalizing schemas; and defining stage logic — expect 2–3 months. Purpose-built platforms like Improvado reduce this timeline significantly because data connectors and funnel models are pre-built; teams are typically operational within a week, though full customization and governance setup may take a few weeks longer.
What is the difference between a marketing dashboard and a funnel dashboard?
A generic marketing dashboard aggregates high-level metrics like impressions, clicks, spend, and conversions across channels. It answers "how much did we spend" and "how much traffic did we get," but doesn't track prospect progression through buying stages. A marketing funnel dashboard is stage-aware: it measures how many prospects move from one defined stage to the next, calculates conversion rates between stages, and surfaces where drop-offs occur. The funnel dashboard connects top-of-funnel activity (ads, web visits) to bottom-of-funnel outcomes (opportunities, revenue), which is critical for understanding true campaign ROI.
Which tools integrate with marketing funnel dashboards?
A complete marketing funnel dashboard requires data from web analytics (Google Analytics, Adobe Analytics), advertising platforms (Google Ads, Meta Ads, LinkedIn Ads), marketing automation systems (HubSpot, Marketo, Pardot), CRM platforms (Salesforce, HubSpot CRM, Microsoft Dynamics), and attribution tools (Bizible, Dreamdata). Marketing data platforms like Improvado offer pre-built connectors to 1,000+ sources and normalize data into a unified schema, so Marketing Data Analysts don't have to write custom ETL. The dashboard itself can be built in any BI tool — Looker, Tableau, Power BI — or in the marketing platform's native reporting interface.
How do you calculate funnel conversion rates?
Funnel conversion rate for a stage pair (e.g., MQL-to-SQL) is calculated as (number of prospects who reached SQL) divided by (number of prospects who reached MQL) times 100. The calculation must account for time windows: use a cohort approach where you track all MQLs created in a given period and measure what percentage converted to SQL within a defined timeframe (e.g., 30 days, 90 days). Avoid mixing cohorts or you'll get inflated rates. Also decide whether to count only forward stage progression or include leads that regress and re-qualify later. Document your calculation logic so stakeholders understand what the dashboard is measuring.
What is a good MQL-to-SQL conversion rate?
Industry benchmarks for B2B MQL-to-SQL conversion range from 28% to 32%, though 75% of MQLs are never accepted as SQLs on average. Conversion rates vary significantly by lead source, deal size, and sales readiness criteria. Inbound demo requests convert at 60–80%, while content download leads convert at 10–20%. Enterprise leads convert slower than SMB. If your conversion rate is below 25%, investigate lead quality (scoring model too loose), sales acceptance criteria (sales rejecting qualified leads), or follow-up speed (leads going cold before contact). The funnel dashboard should segment conversion rates by source so you can compare performance across channels.

