
Your best-performing ad creative on Meta might be failing on TikTok. Your Google Display campaigns could be cannibalizing YouTube budgets. But you won't know — because each platform lives in its own silo.
Marketing teams today run campaigns across 10+ advertising networks. Each platform has its own dashboard, its own metrics, and its own version of the truth. Stitching together creative performance data means exporting CSVs, building pivot tables, and hoping your manual reconciliation didn't miss a zero.
A creative analytics dashboard solves this. It pulls creative-level performance data from every active channel into one unified view. You see which images, videos, headlines, and CTAs drive results — across platforms, not just within them. This guide shows you how to build one that actually works.
Key Takeaways
✓ A creative analytics dashboard aggregates ad creative performance data from multiple platforms into a single source of truth, eliminating manual CSV exports and reconciliation errors.
✓ Cross-platform creative analysis reveals patterns invisible in single-platform dashboards — the same visual might perform 3x better on Meta than Google, or a headline variation could drive conversions on LinkedIn but fail on TikTok.
✓ Marketing data platforms like Improvado connect 1,000+ data sources with pre-built connectors, eliminating the engineering bottleneck that blocks most dashboard projects.
✓ Creative-level metrics (ROAS by image, CPA by headline variant, engagement by video length) require granular data extraction that native platform APIs often don't expose without custom configuration.
✓ Segmentation by audience, device, placement, and time enables you to identify which creative elements work for specific contexts — not just aggregate performance.
✓ Automated data pipelines preserve 2 years of historical creative performance even when platforms change their schemas, protecting your ability to analyze long-term trends.
✓ Real-time dashboards catch underperforming creatives within hours, not days, allowing rapid reallocation of budget before significant waste occurs.
✓ Teams using unified creative dashboards report 38 hours saved per analyst per week compared to manual platform-by-platform reporting workflows.
What a Creative Analytics Dashboard Solves
Creative analytics dashboards exist because advertising platforms were never designed to talk to each other. Meta's Ads Manager shows you Meta data. Google Ads shows you Google data. TikTok Ads Manager shows you TikTok data. Each platform optimizes for its own ecosystem.
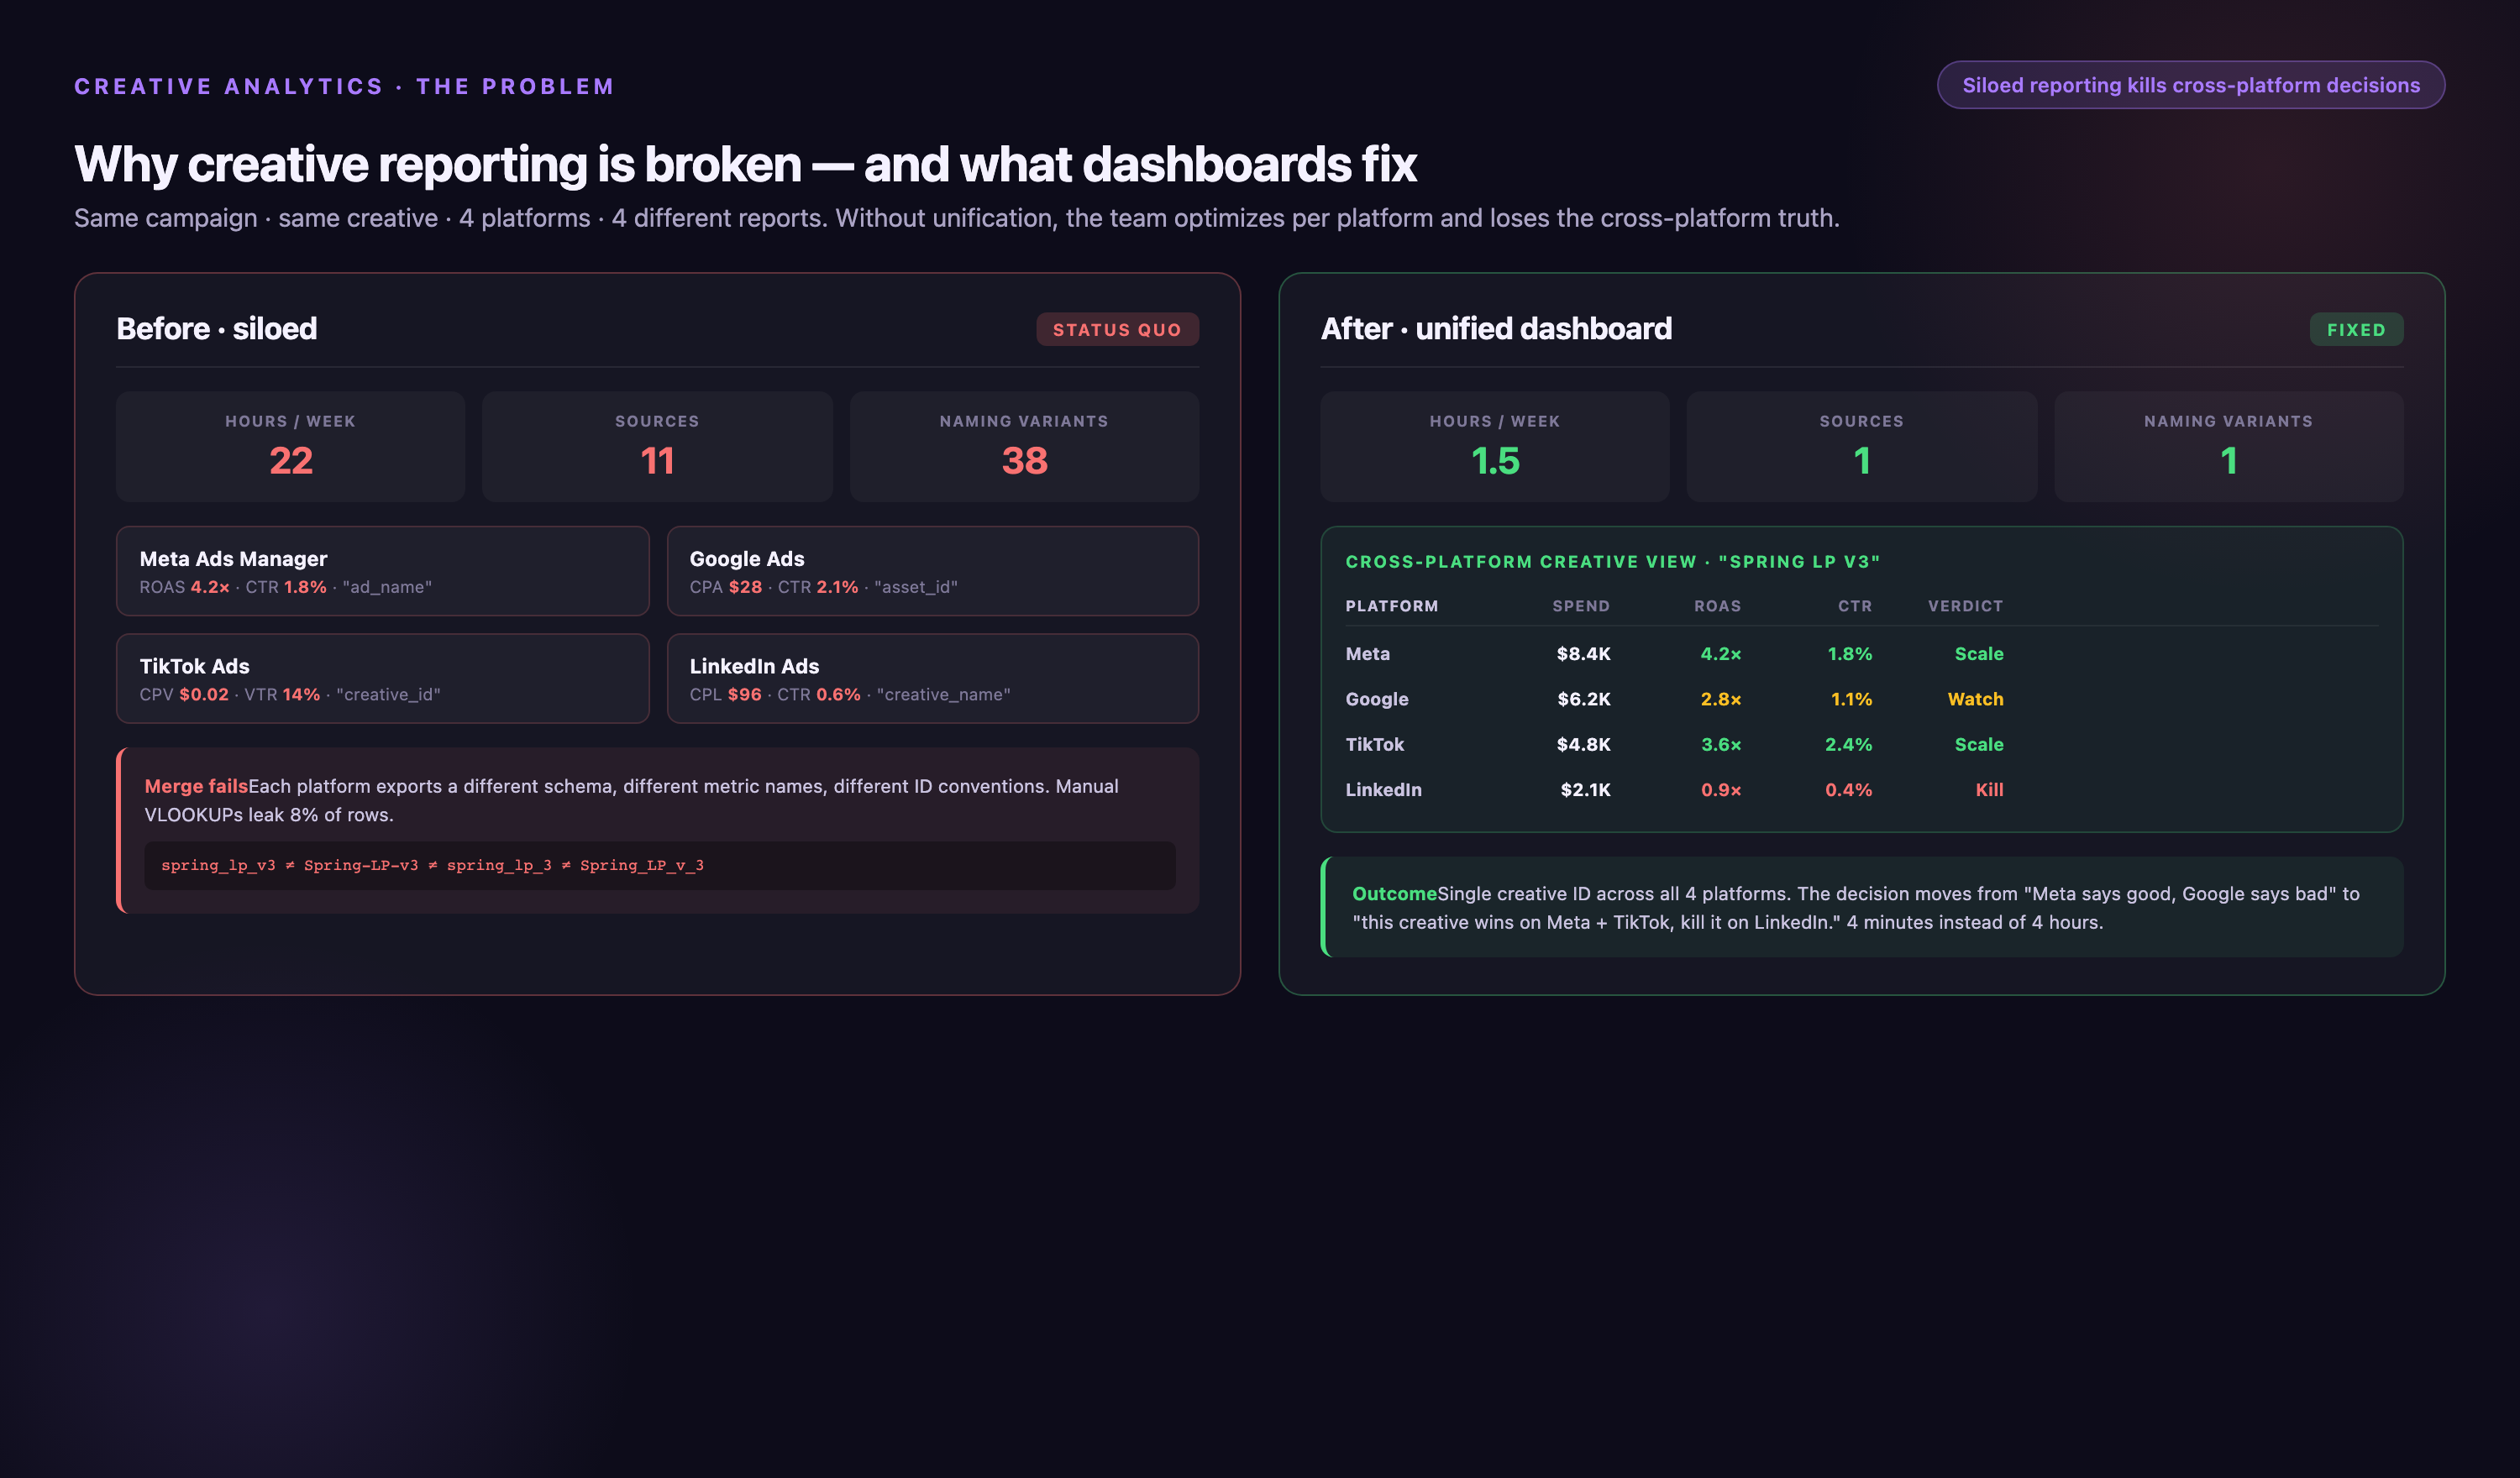
This fragmentation creates three core problems. First, you can't compare creative performance across platforms. A carousel ad might have a 2.8% CTR on Meta and a 1.4% CTR on Google Display, but you won't know which creative elements caused the difference unless you manually map asset IDs between platforms.
Second, you can't aggregate spend and results. If you're running the same video creative across YouTube, Meta, and TikTok with a combined $50K monthly budget, calculating true blended ROAS requires pulling data from three dashboards, normalizing currency and time zones, and reconciling attribution windows.
Third, you lose historical context when platforms update their APIs. Ad platforms periodically change or deprecate creative-level reporting endpoints. If you're pulling data manually or through basic connectors, schema changes can break your pipeline and leave gaps in historical creative performance data.
Cross-Platform Visibility
A creative analytics dashboard unifies data at the asset level. Instead of seeing "Campaign A spent $12K" across five platforms, you see "Video_v3.mp4 spent $4,200 on Meta (ROAS 3.2x), $3,800 on YouTube (ROAS 1.8x), $2,100 on TikTok (ROAS 4.1x), $1,400 on LinkedIn (ROAS 0.9x), $500 on Twitter (ROAS 2.3x)."
This granularity reveals where to double down and where to cut. The same creative asset can perform wildly differently depending on platform, audience, and placement. Without unified visibility, you're optimizing in the dark.
Cross-device context matters too. Single-device testing misses 40 to 60% of behavior in consumer industries because users see ads on mobile but convert on desktop, or vice versa. A creative dashboard that stitches cross-device journeys shows you which assets drive discovery versus which drive conversion.
Metric Standardization
Platforms define metrics differently. Meta's "CPC (all)" includes link clicks, post reactions, and comments. Google Ads' "CPC" counts only clicks to your landing page. TikTok's "CPC" includes profile visits. If you're comparing raw CPC across platforms without normalization, you're comparing apples to oranges.
A properly configured creative dashboard standardizes definitions. You define "link click" once, then map each platform's equivalent event to that unified metric. This consistency enables true cross-platform benchmarking.
Attribution windows also need alignment. Meta defaults to 7-day click, 1-day view. Google Ads defaults to 30-day click. LinkedIn defaults to 7-day click only. Without window harmonization, your ROAS calculations reflect platform defaults rather than actual business impact.
Core Components of a Creative Analytics Dashboard
Every functional creative analytics dashboard has four layers: data extraction, data transformation, data storage, and visualization. Most teams focus on visualization first — picking a BI tool, designing layouts, choosing colors. That's backwards. Visualization is the last 10% of the problem.
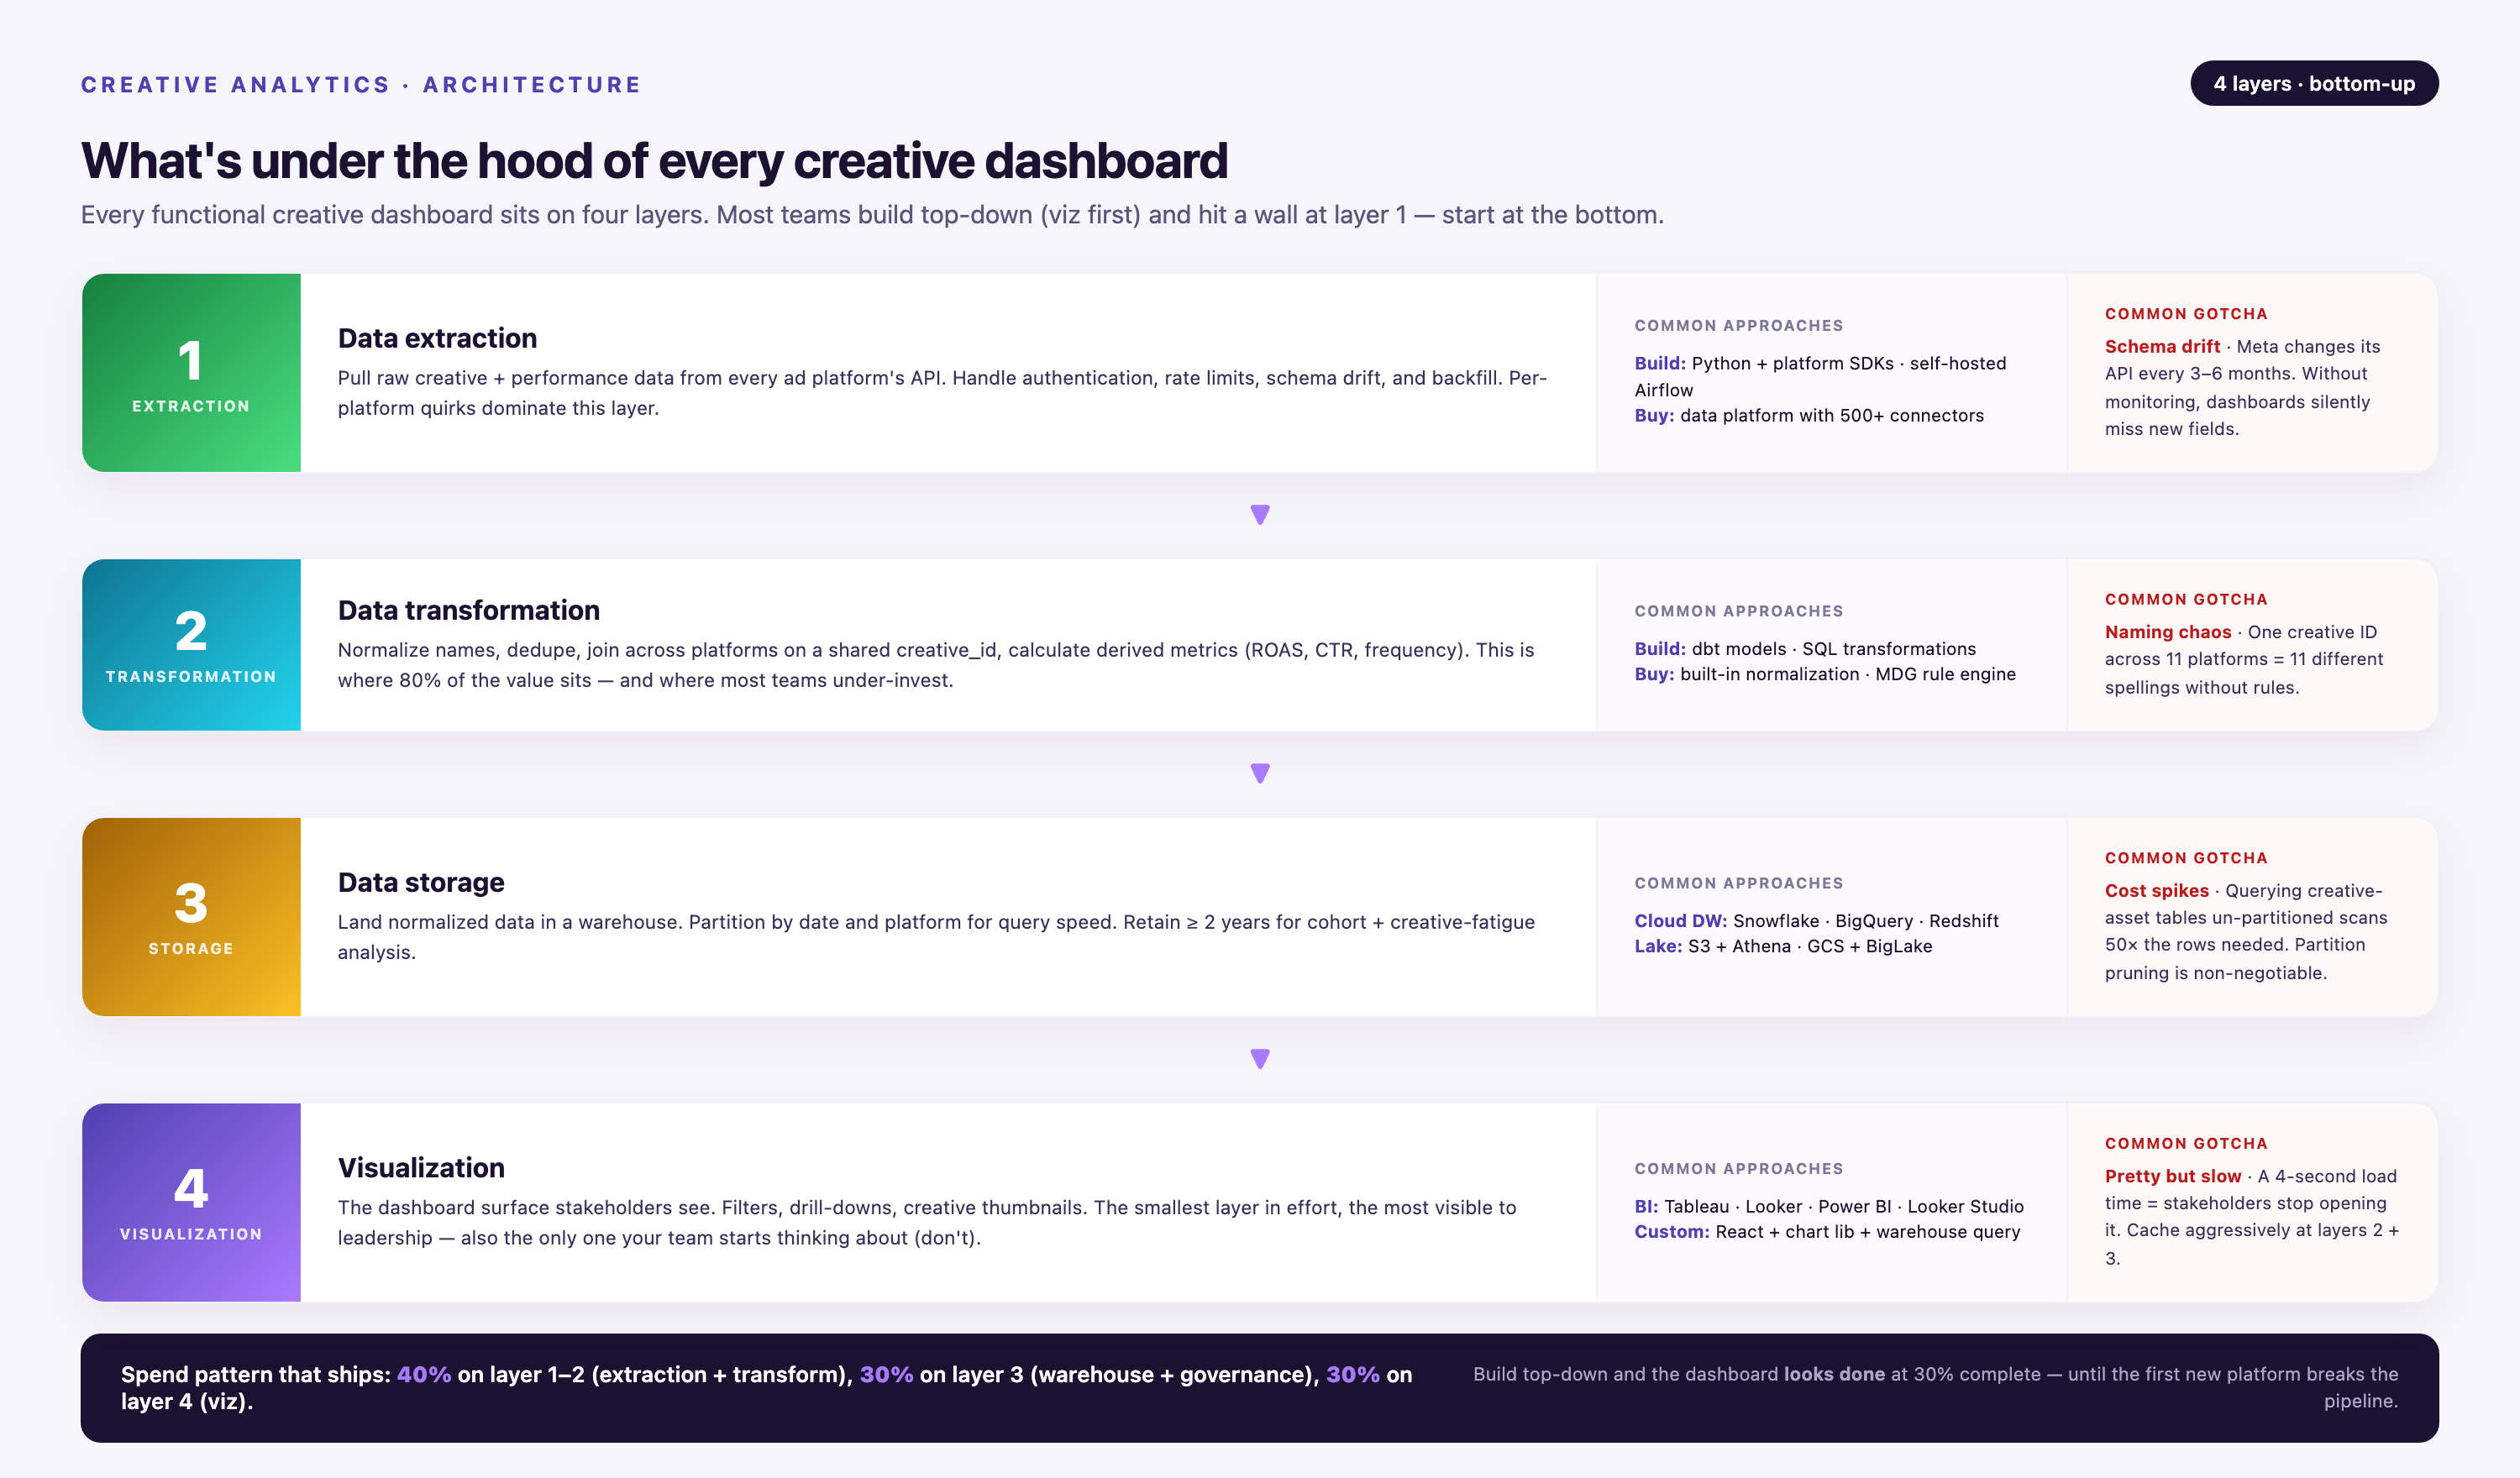
The real work happens in the first three layers. If your data extraction is incomplete, your dashboard shows incomplete results. If your transformation logic is wrong, your metrics are wrong. If your storage layer can't handle schema changes, your pipeline breaks every time a platform updates its API.
Data Extraction Layer
Data extraction pulls creative-level performance data from each advertising platform via API. This sounds simple. It's not. Platforms rate-limit API calls, paginate large result sets, and frequently deprecate endpoints without warning.
Meta's Marketing API has a complexity score system that throttles requests based on query structure. Google Ads API enforces daily query limits per developer token. TikTok's API returns paginated responses capped at 1,000 rows per call. If you're building connectors in-house, you're managing rate limits, retry logic, pagination loops, and error handling for every platform.
Pre-built connectors solve this. Improvado maintains 1,000+ data source connectors with built-in rate limit handling, schema mapping, and automatic retries. When Meta updates its API, the connector updates within days — not months. You don't rebuild extraction logic every quarter.
Granularity matters here. Many basic connectors pull campaign-level or ad-set-level data but skip creative-level breakdowns. For a creative analytics dashboard, you need asset-level extraction: which image, which video file, which headline variant drove each impression, click, and conversion. That requires configuring breakdowns and custom fields in the API request, which most no-code tools don't expose.
Data Transformation Layer
Raw API data is unusable. Meta returns timestamps in UTC. Google Ads returns them in your account time zone. TikTok returns them in ISO 8601 format with millisecond precision. Currency codes, date formats, null handling, and field naming conventions all differ.
Transformation normalizes this chaos. You convert all timestamps to a single time zone. You map all currency values to USD (or your reporting currency). You standardize field names so "ad_name" from Meta and "headline" from Google both map to "creative_asset" in your warehouse.
Marketing-specific transformation is harder. Calculating incrementality, deduplicating conversions across platforms, and attributing revenue to the correct touchpoint all require custom logic. If User A saw a Meta ad, clicked a Google search ad, then converted via a LinkedIn retargeting ad, which creative gets credit? Your transformation layer encodes that decision.
Improvado's Marketing Cloud Data Model (MCDM) provides pre-built transformations for 200+ common marketing metrics. Instead of writing SQL to calculate blended ROAS across platforms, you reference a pre-configured metric that's already been tested and validated.
Data Storage Layer
Transformed data lives in a data warehouse — Snowflake, BigQuery, Redshift, or Databricks. This is your single source of truth. Every dashboard, every report, and every analysis queries this warehouse.
Schema design determines query performance. A poorly indexed creative performance table can take 30 seconds to load a simple dashboard. A properly partitioned table with clustered indexes returns results in under 2 seconds.
Historical data preservation is critical. When ad platforms deprecate creative-level breakdowns, teams using basic ETL tools can lose access to granular historical data. Improvado preserves 2 years of historical data even when source schemas change, maintaining backward compatibility so your year-over-year creative analysis still works.
Visualization Layer
The visualization layer is where marketers actually interact with data. Tools like Looker, Tableau, Power BI, or custom dashboards query the warehouse and render charts, tables, and KPIs.
Dashboard design principles for creative analytics: lead with outcomes (ROAS, CPA, conversion rate), not activity metrics (impressions, clicks). Group by creative dimension first (image, video, headline), then by platform. Use conditional formatting to highlight outliers — creatives performing 2+ standard deviations above or below mean.
Interactive filters enable drill-down analysis. A marketer should be able to filter by date range, platform, audience segment, device type, and placement without waiting for a data analyst to rebuild the report. Self-service dashboards reduce dependency on technical teams.
Metrics That Matter in Creative Dashboards
Not all metrics belong in a creative analytics dashboard. Impressions, reach, and frequency are campaign-planning metrics. They tell you how many people saw your ad. They don't tell you whether your creative worked.
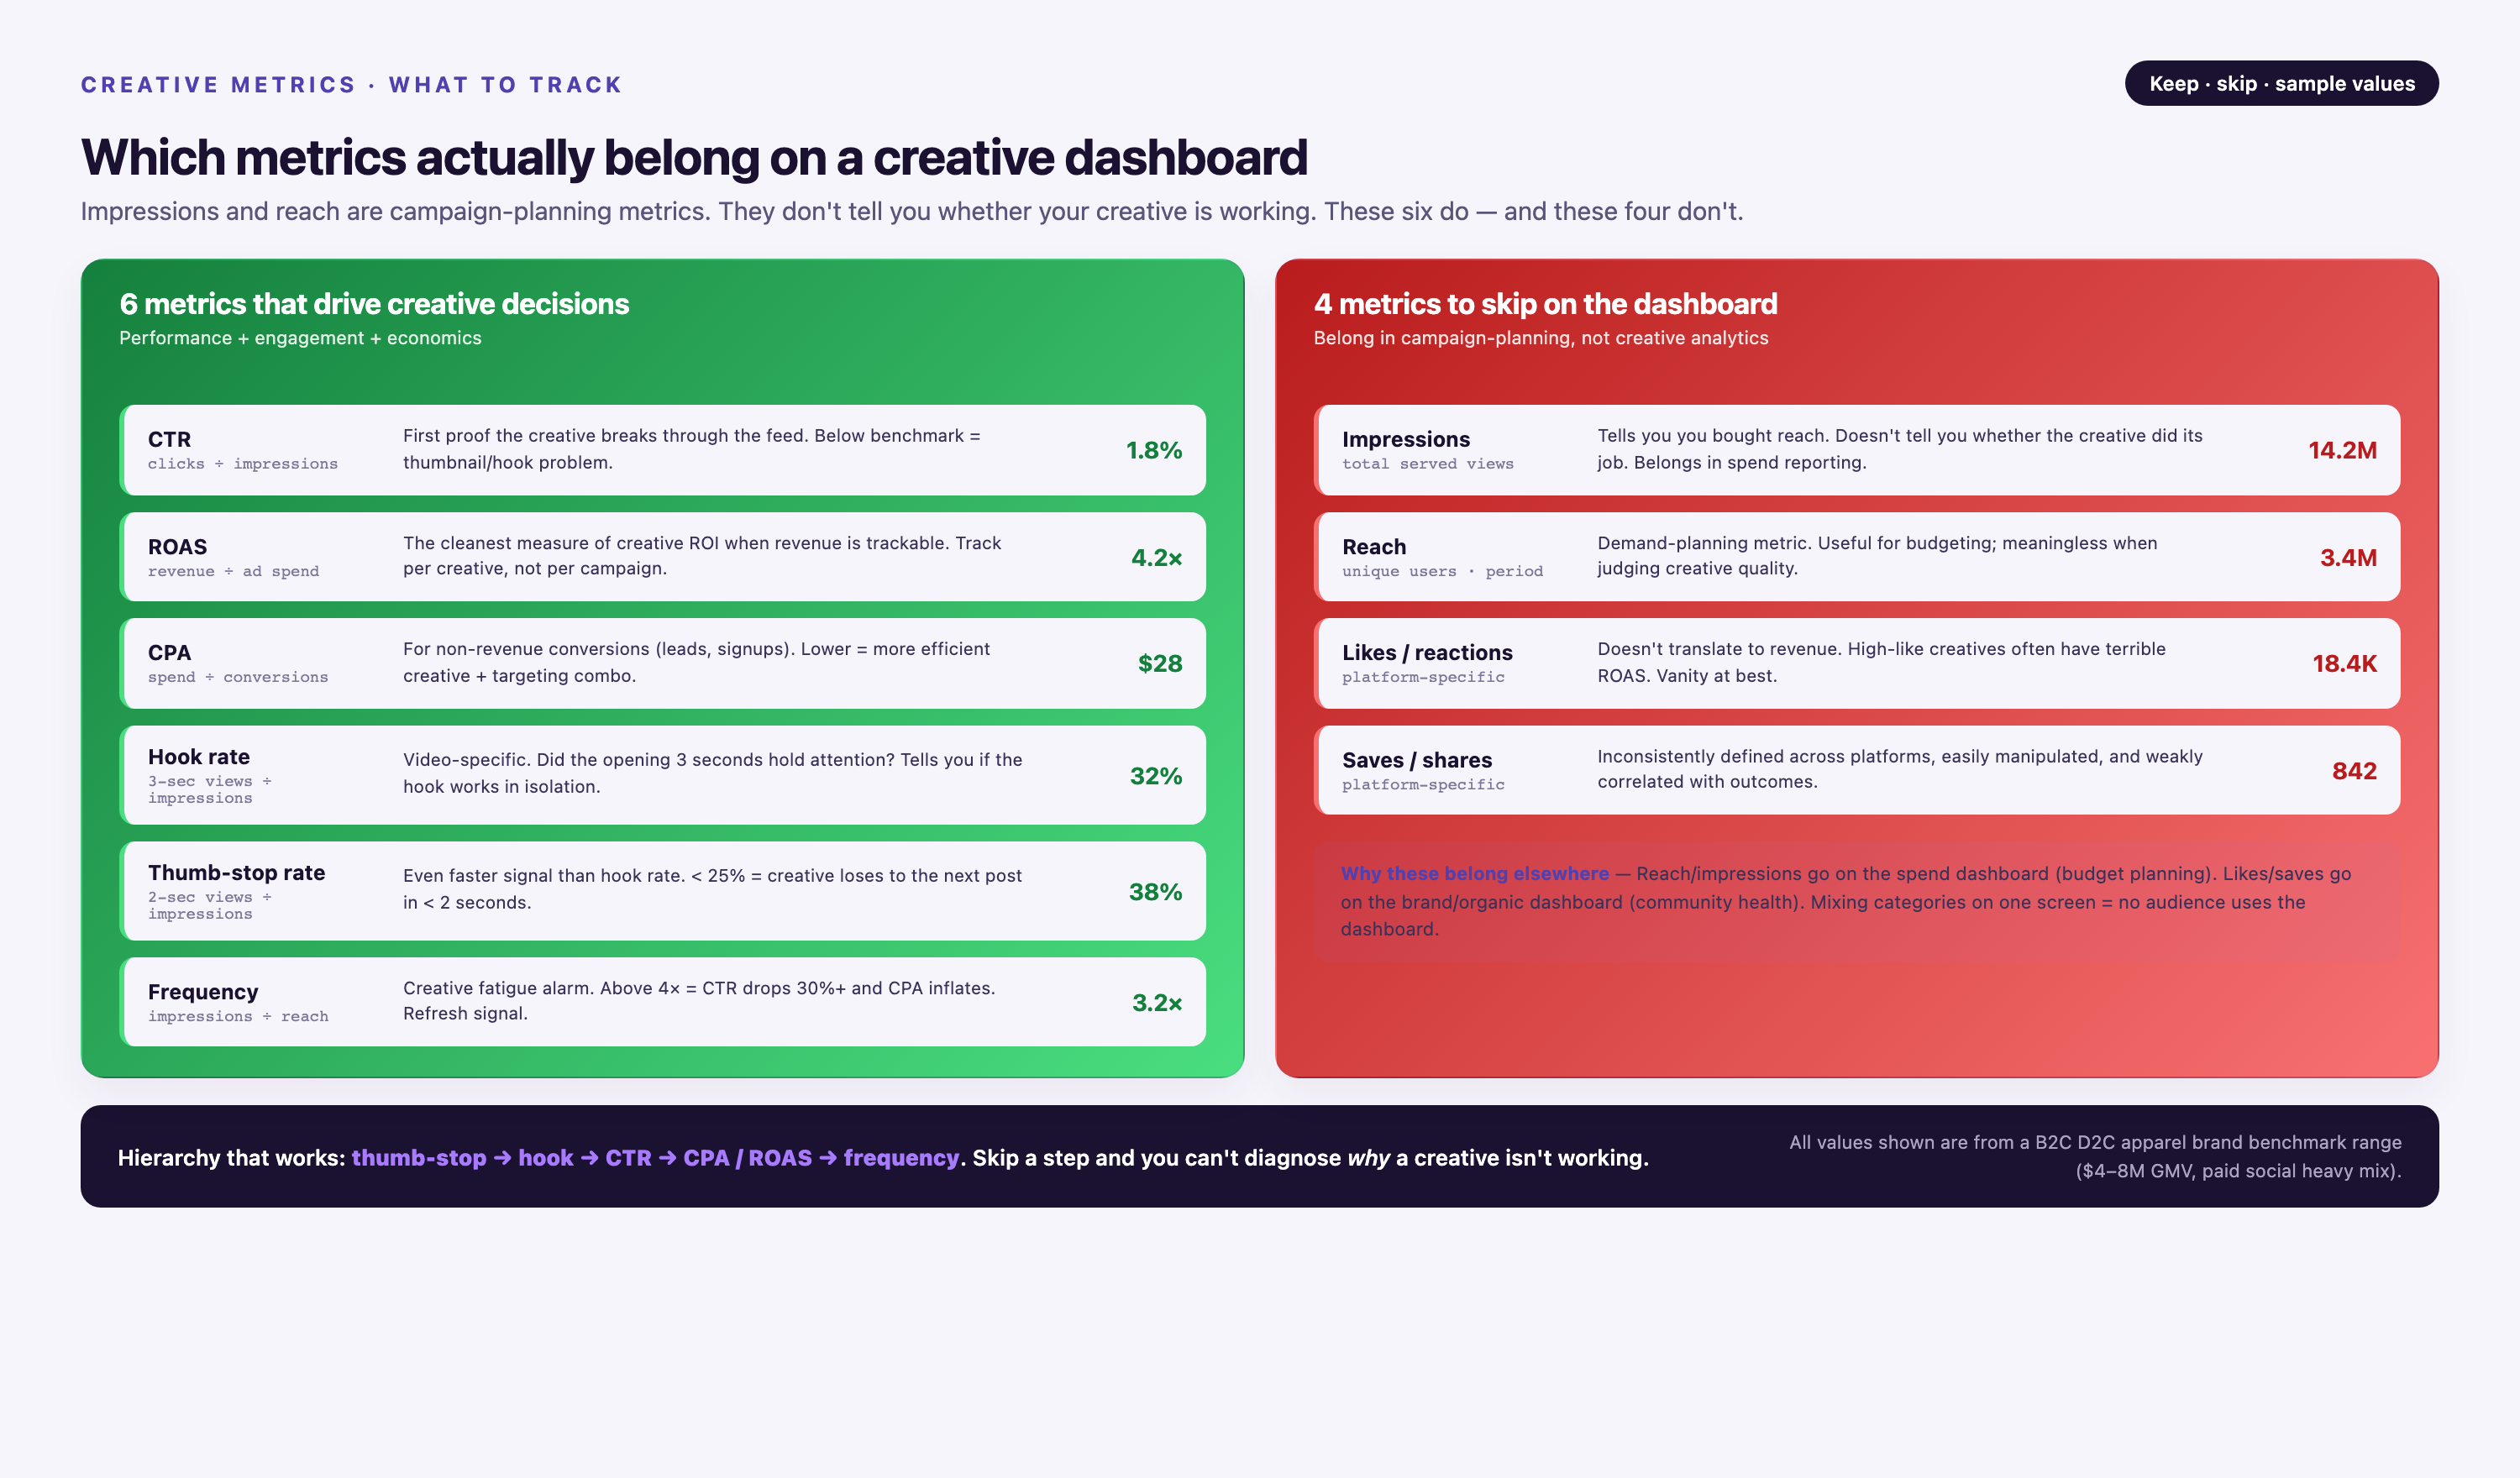
Creative performance metrics answer one question: which assets drive business outcomes? That means focusing on conversion metrics, efficiency metrics, and engagement metrics tied directly to revenue or pipeline.
Conversion Metrics
Conversions are the outcome your creative is designed to produce. For e-commerce, that's purchases. For SaaS, that's demo requests or trial sign-ups. For lead-gen, that's form submissions or phone calls.
Track conversions at the creative level, not just the campaign level. If Campaign A has three ad variants and drives 200 conversions, which variant drove 150 of them? Without asset-level attribution, you can't answer that question.
Conversion rate by creative (conversions divided by clicks) reveals which assets resonate with your audience after they engage. A high click-through rate with a low conversion rate means your creative attracted attention but failed to deliver on its promise. Misalignment between ad copy and landing page is the most common cause.
Multi-touch attribution assigns fractional credit to each creative touchpoint in the customer journey. If a user saw Creative A on Meta, clicked Creative B on Google, and converted after seeing Creative C on LinkedIn, first-touch attribution gives 100% credit to Creative A. Last-touch gives 100% to Creative C. Linear attribution splits credit equally. Your dashboard should support all three models so you can analyze which creatives drive discovery, consideration, and conversion.
Efficiency Metrics
Efficiency metrics measure cost per outcome. CPA (cost per acquisition) is the standard. ROAS (return on ad spend) is the inverse: revenue divided by spend. Both matter, but for different reasons.
CPA tells you how much you're paying to acquire a customer. If your average customer lifetime value is $500 and your CPA is $120, you have a sustainable acquisition model. If CPA climbs to $450, your unit economics break.
ROAS tells you how much revenue you generate per dollar spent. A ROAS of 3.0x means every $1 spent returns $3 in revenue. ROAS is useful for comparing creative performance across campaigns with different price points. A $50 product and a $500 product can't be compared on CPA alone, but ROAS normalizes the comparison.
Creative-level ROAS reveals which assets are profitable and which are burning budget. If Creative A has a 4.2x ROAS and Creative B has a 1.1x ROAS, reallocating budget from B to A is an immediate profit lever.
Segment ROAS by audience, device, and placement to find hidden inefficiencies. Creative A might have a 4.2x ROAS overall but a 1.8x ROAS on mobile. That's a signal to either optimize the creative for mobile or shift mobile budget to a different asset.
- →You're exporting CSVs from 8 platforms every Monday to build a single performance report
- →Your dashboard shows campaign performance but you can't drill down to see which creative asset drove results
- →Platform API changes broke your pipeline twice this quarter and you lost weeks of historical creative data
- →Your analyst spends 12 hours per week reconciling metrics that define CPC and ROAS differently across platforms
- →You discovered last month's "winning" creative was actually underperforming on 3 platforms but you only looked at Meta
Engagement Metrics
Engagement metrics (CTR, video completion rate, interaction rate) are leading indicators. They predict conversion performance before conversions accumulate enough volume to be statistically significant.
Click-through rate (CTR) measures how compelling your creative is. A high CTR means your visual, headline, or offer grabbed attention. A low CTR means your creative blends into the feed or your targeting is off.
Video completion rate (VCR) measures how many viewers watched your video to the end. A 10-second video with a 60% VCR is more engaging than a 30-second video with a 20% VCR. Short-form video dominates on TikTok and Meta Reels. Long-form performs better on YouTube when the content justifies the length.
Interaction rate (likes, shares, comments, saves divided by impressions) measures social proof. High interaction rates signal that your creative resonates culturally, not just functionally. Ads with high interaction rates often have lower CPMs because platforms reward content that keeps users engaged.
Track engagement metrics by creative element. If you're A/B testing two headlines with the same image, engagement metrics reveal which headline drives more clicks. If you're testing two images with the same headline, engagement metrics reveal which visual stops the scroll.
Platform-Specific Considerations
Each advertising platform has unique creative formats, reporting quirks, and optimization algorithms. A creative analytics dashboard must account for these differences or you'll compare metrics that aren't comparable.
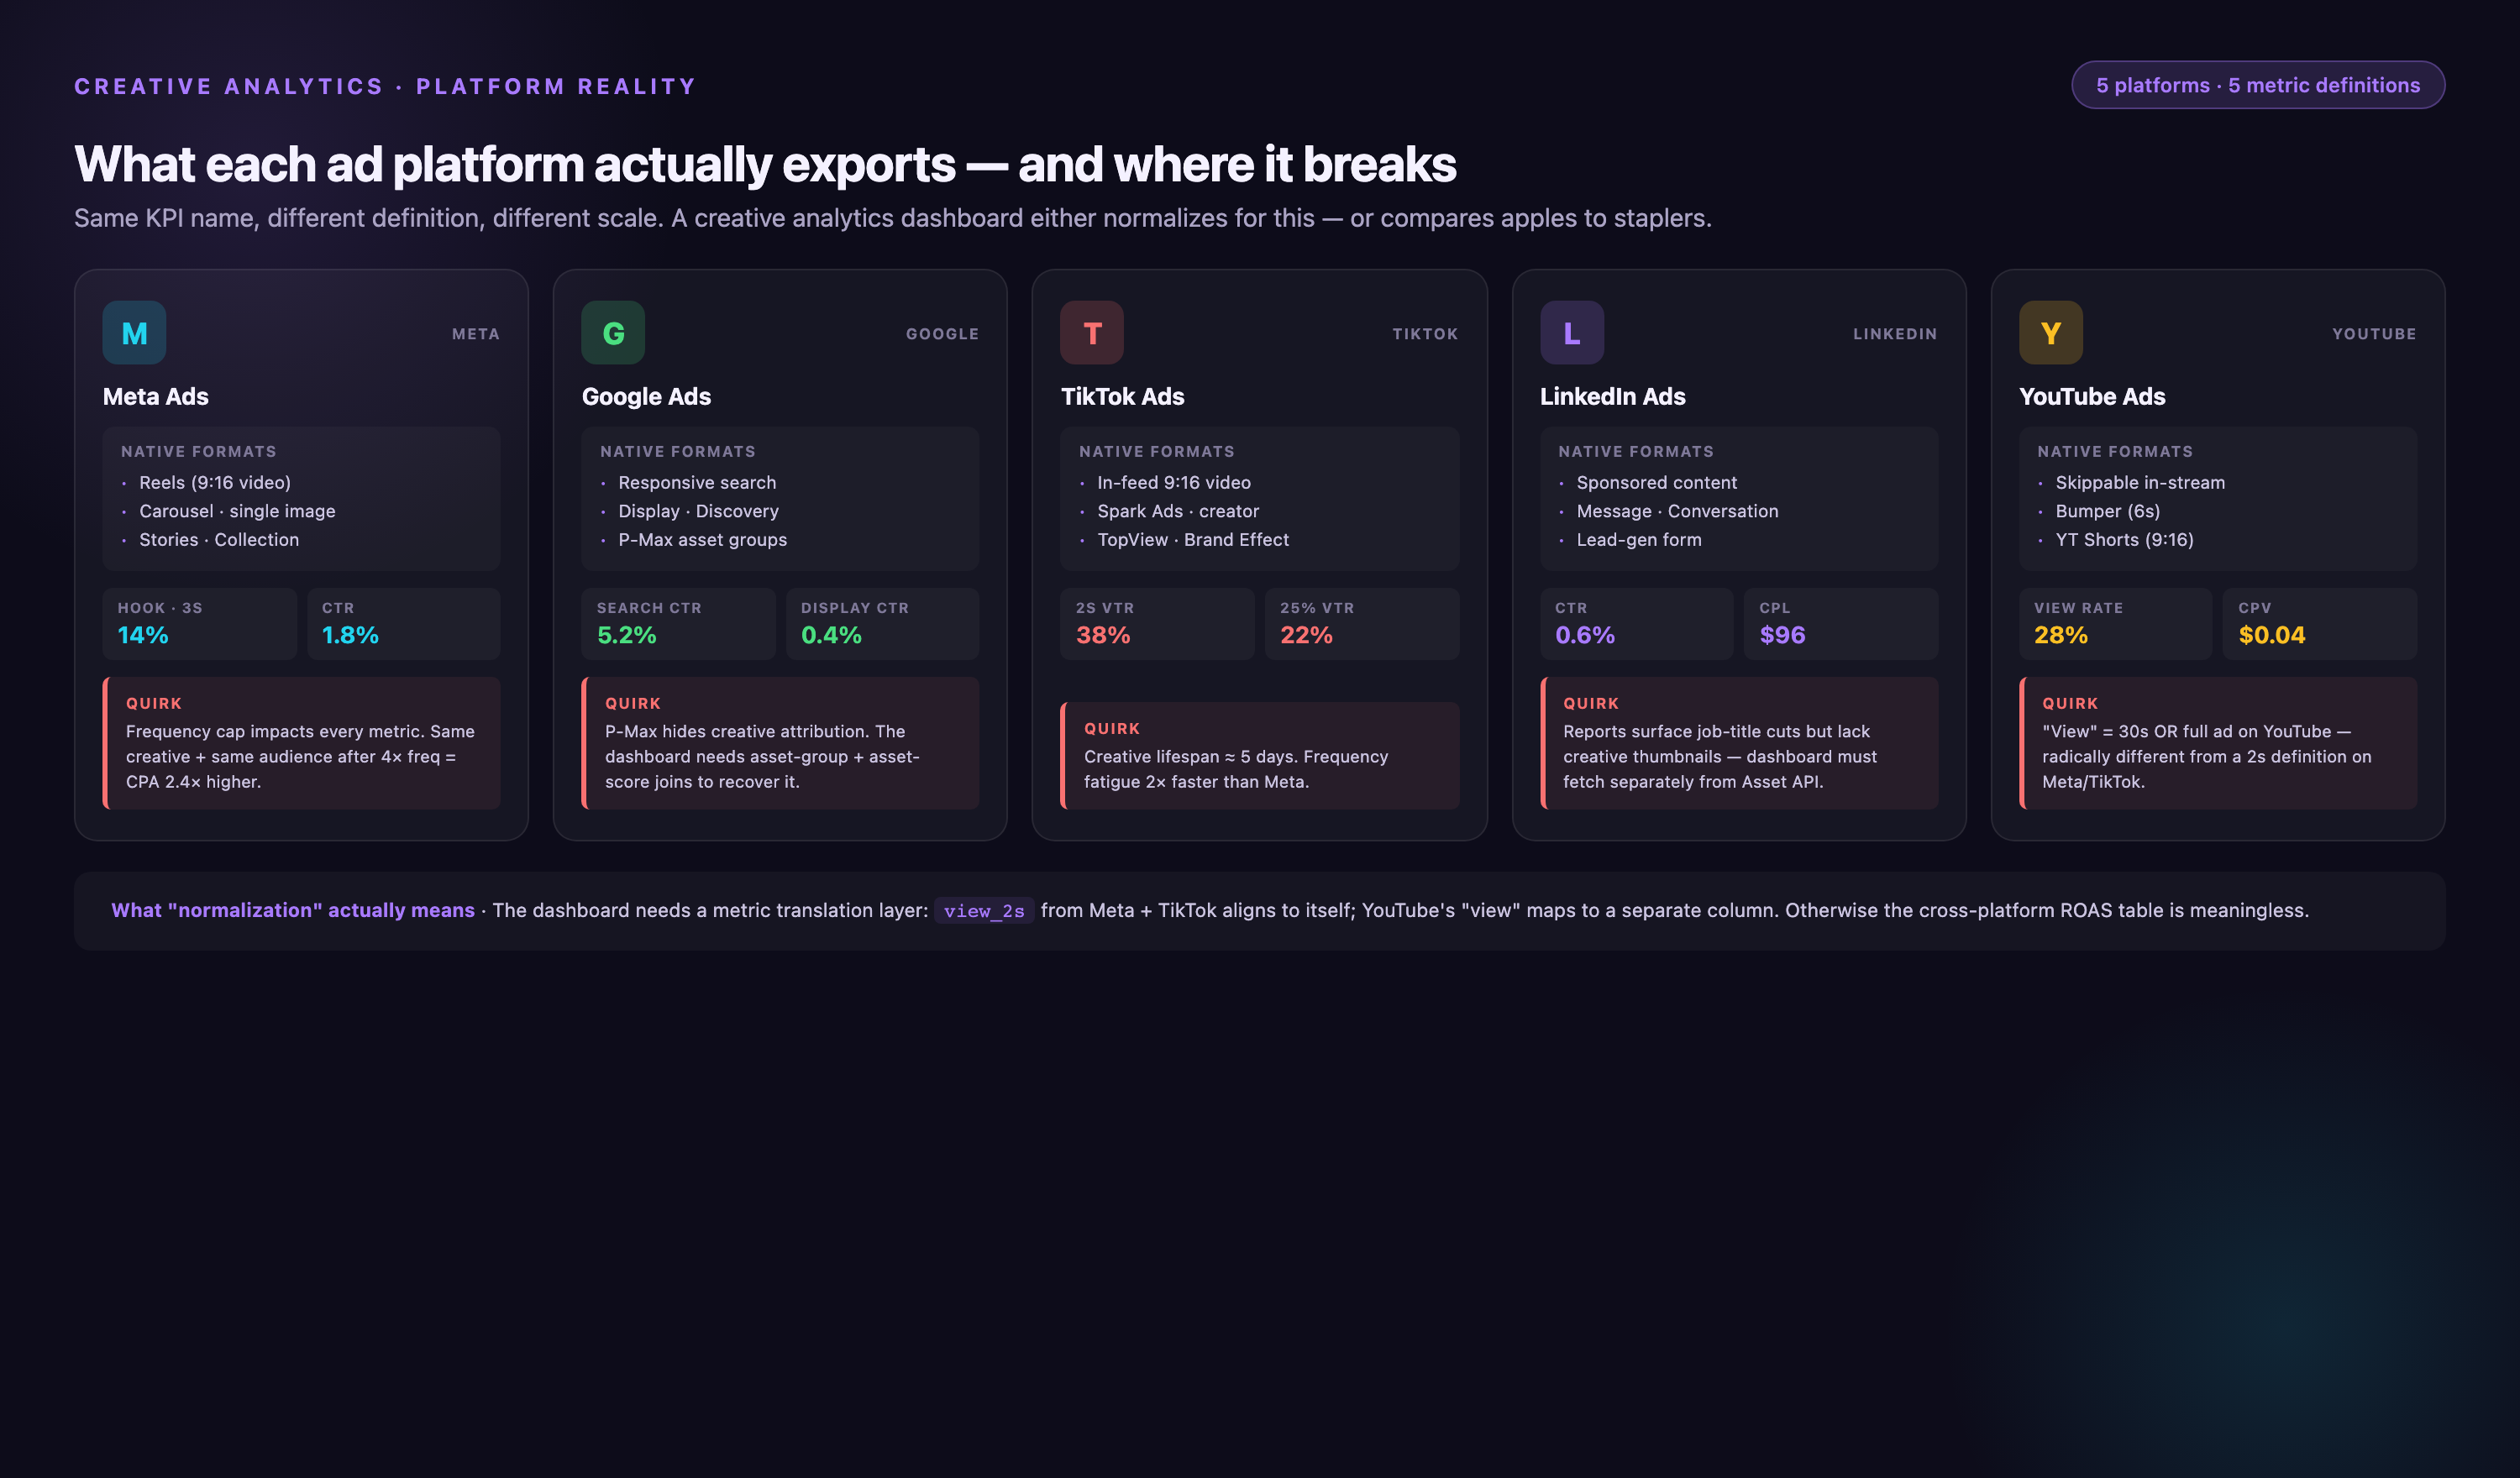
Meta (Facebook & Instagram)
Meta's creative reporting includes dynamic creative optimization (DCO) campaigns where the platform mixes and matches headlines, images, and CTAs. DCO performance is reported at the combination level, not the individual asset level. Extracting which specific image performed best requires parsing combination strings in the API response.
Meta also has placement-specific creative requirements. Instagram Stories requires 9:16 vertical video. Facebook Feed supports square, vertical, and horizontal. Audience Network has different specs entirely. A creative dashboard should track performance by placement so you can see which formats work where.
Meta's attribution defaults to 7-day click, 1-day view. If your attribution window is longer (28-day click is common for high-consideration purchases), you need to pull conversion data from Meta's Conversion API or reconcile against your own analytics platform. Native Meta reporting will undercount conversions.
Google Ads
Google Ads separates Search, Display, YouTube, Shopping, and Performance Max into different campaign types with different creative formats. Search ads have headlines and descriptions but no images. Display ads have images and HTML5 creatives. YouTube ads have video thumbnails and companion banners.
Google's responsive search ads (RSAs) rotate up to 15 headlines and 4 descriptions. The API returns performance by headline position (Headline 1, Headline 2, Headline 3) but not by specific headline text unless you configure asset-level reporting. Most basic dashboards miss this.
Google's attribution defaults to last non-direct click, which undercounts upper-funnel creative impact. If a user sees your YouTube ad, searches your brand two days later, and converts, Google attributes the conversion to the search ad — not the YouTube creative that drove awareness. Multi-touch attribution models correct this.
TikTok
TikTok's creative reporting is less mature than Meta or Google. The TikTok Ads API doesn't expose video-level engagement metrics (completion rate by quartile, rewatch rate) in bulk exports. TikTok Creative Center (Top Ads Dashboard) is free and provides engagement breakdowns, but it's a separate tool from Ads Manager. Unifying TikTok creative data with other platforms requires pulling from multiple endpoints.
TikTok's algorithm heavily favors native creative — content that looks like organic TikTok posts, not polished TV commercials. Metrics like "video played to completion" and "shares" are stronger predictors of TikTok performance than traditional CTR or conversion rate. A creative dashboard for TikTok should weight these engagement signals accordingly.
LinkedIn's audience is professional. Creative that works on Meta or TikTok often fails on LinkedIn because tone, messaging, and visual style expectations differ. A creative dashboard should segment LinkedIn performance separately and compare it against B2B benchmarks, not consumer benchmarks.
LinkedIn's conversion tracking uses Insight Tags, which have higher latency than Meta's Pixel or Google's gtag. Conversions on LinkedIn can take 24–48 hours to appear in reporting. Real-time dashboards for LinkedIn need to account for this lag.
Programmatic Display
Programmatic display campaigns run across thousands of websites via DSPs (demand-side platforms) like The Trade Desk, DV360, or Amazon DSP. Creative performance varies wildly by publisher, placement, and context. A banner ad on CNN performs differently than the same banner on a niche blog.
Programmatic reporting requires domain-level breakdowns to identify which publishers drive results and which drive bot traffic. A creative dashboard should flag domains with abnormally high impressions but zero conversions — a signal of fraud or misaligned inventory.
Building a Unified Creative View
Building a creative analytics dashboard from scratch typically takes 3–6 months of engineering time. You're writing API integrations, building transformation logic, designing schemas, and configuring dashboards. For most marketing teams, that timeline is too slow.
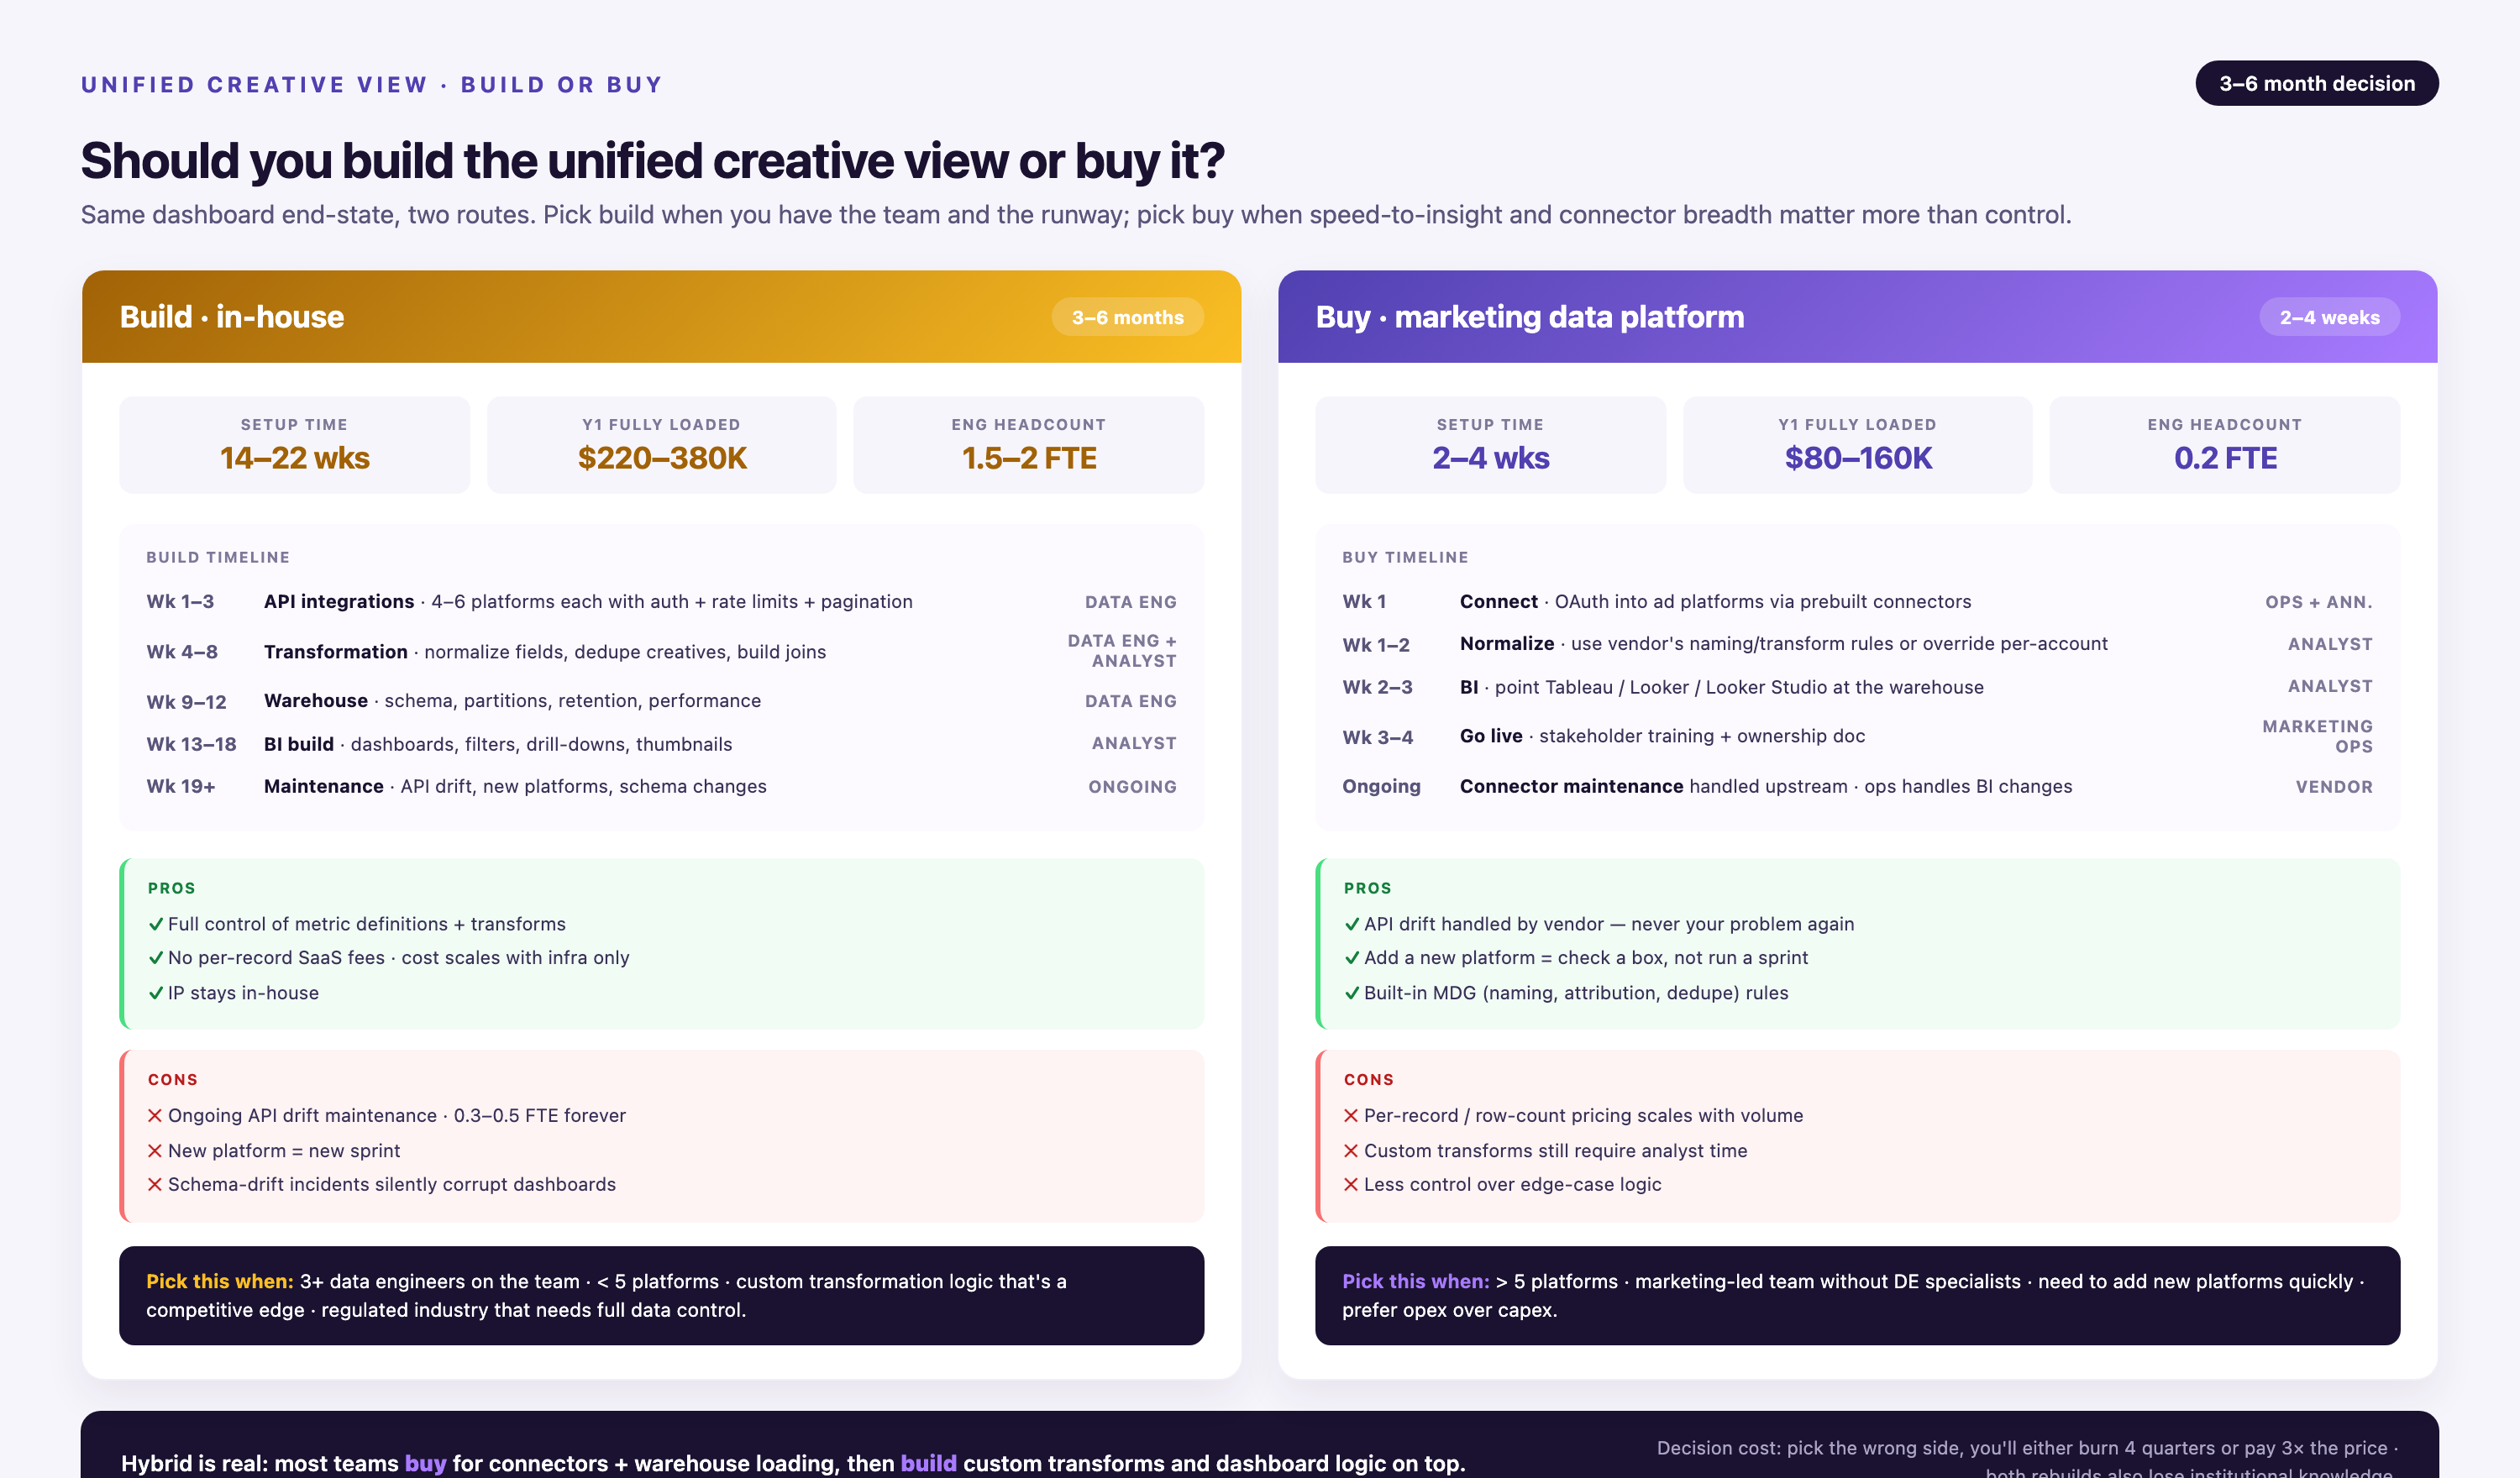
Marketing data platforms compress this timeline to days. Improvado's pre-built connectors extract data from 1,000+ sources without custom code. Transformation logic is pre-configured. Historical data is preserved automatically. Teams go from "we need a dashboard" to "here's the dashboard" in under a week.
Connector Architecture
A connector is a software module that authenticates with an advertising platform's API, extracts data according to your configuration, handles errors, and delivers normalized data to your warehouse. Writing a production-grade connector requires understanding OAuth flows, rate limits, pagination, schema versioning, and error handling.
Improvado connectors handle all of this. You authenticate once via OAuth. The connector monitors API changes and updates automatically. If Meta deprecates an endpoint, Improvado reroutes the data pull to the new endpoint without breaking your pipeline.
Custom connectors are available when you need data from a proprietary platform or an internal tool. Improvado builds custom connectors in days, not months. You provide API documentation and sample responses. Improvado delivers a working connector with the same reliability guarantees as pre-built connectors.
Data Governance
Marketing data governance ensures data accuracy, consistency, and compliance. Improvado's Marketing Data Governance module includes 250+ pre-built validation rules that catch common errors before they reach your dashboard.
Budget validation rules flag campaigns that exceed spending limits. Data completeness rules flag missing conversions or broken tracking pixels. Schema validation rules flag unexpected data types or out-of-range values. These rules run automatically on every data sync.
Governance also includes access control. Not every team member should see every campaign's performance. A creative dashboard should enforce role-based permissions so regional teams see their region's data, brand teams see their brand's data, and executives see aggregated cross-brand data.
Real-Time vs. Batch Processing
Real-time dashboards update every few minutes. Batch dashboards update once per day. The choice depends on how quickly you need to react to performance changes.
For direct-response campaigns with daily budgets in the thousands, real-time monitoring catches underperforming creatives within hours. If a new creative launched this morning has a CPA 3x higher than your target, you want to know by noon — not tomorrow.
For brand campaigns with monthly budgets, daily batch updates are sufficient. You're tracking trends over weeks, not hours. Real-time processing adds cost and complexity without meaningful benefit.
Improvado supports both. Real-time pipelines sync every 15 minutes. Batch pipelines sync once per day. You configure sync frequency per data source based on your needs.
Use Cases for Creative Analytics Dashboards
Creative analytics dashboards serve multiple use cases across marketing teams. The most common: creative testing, budget reallocation, cross-platform optimization, and executive reporting.
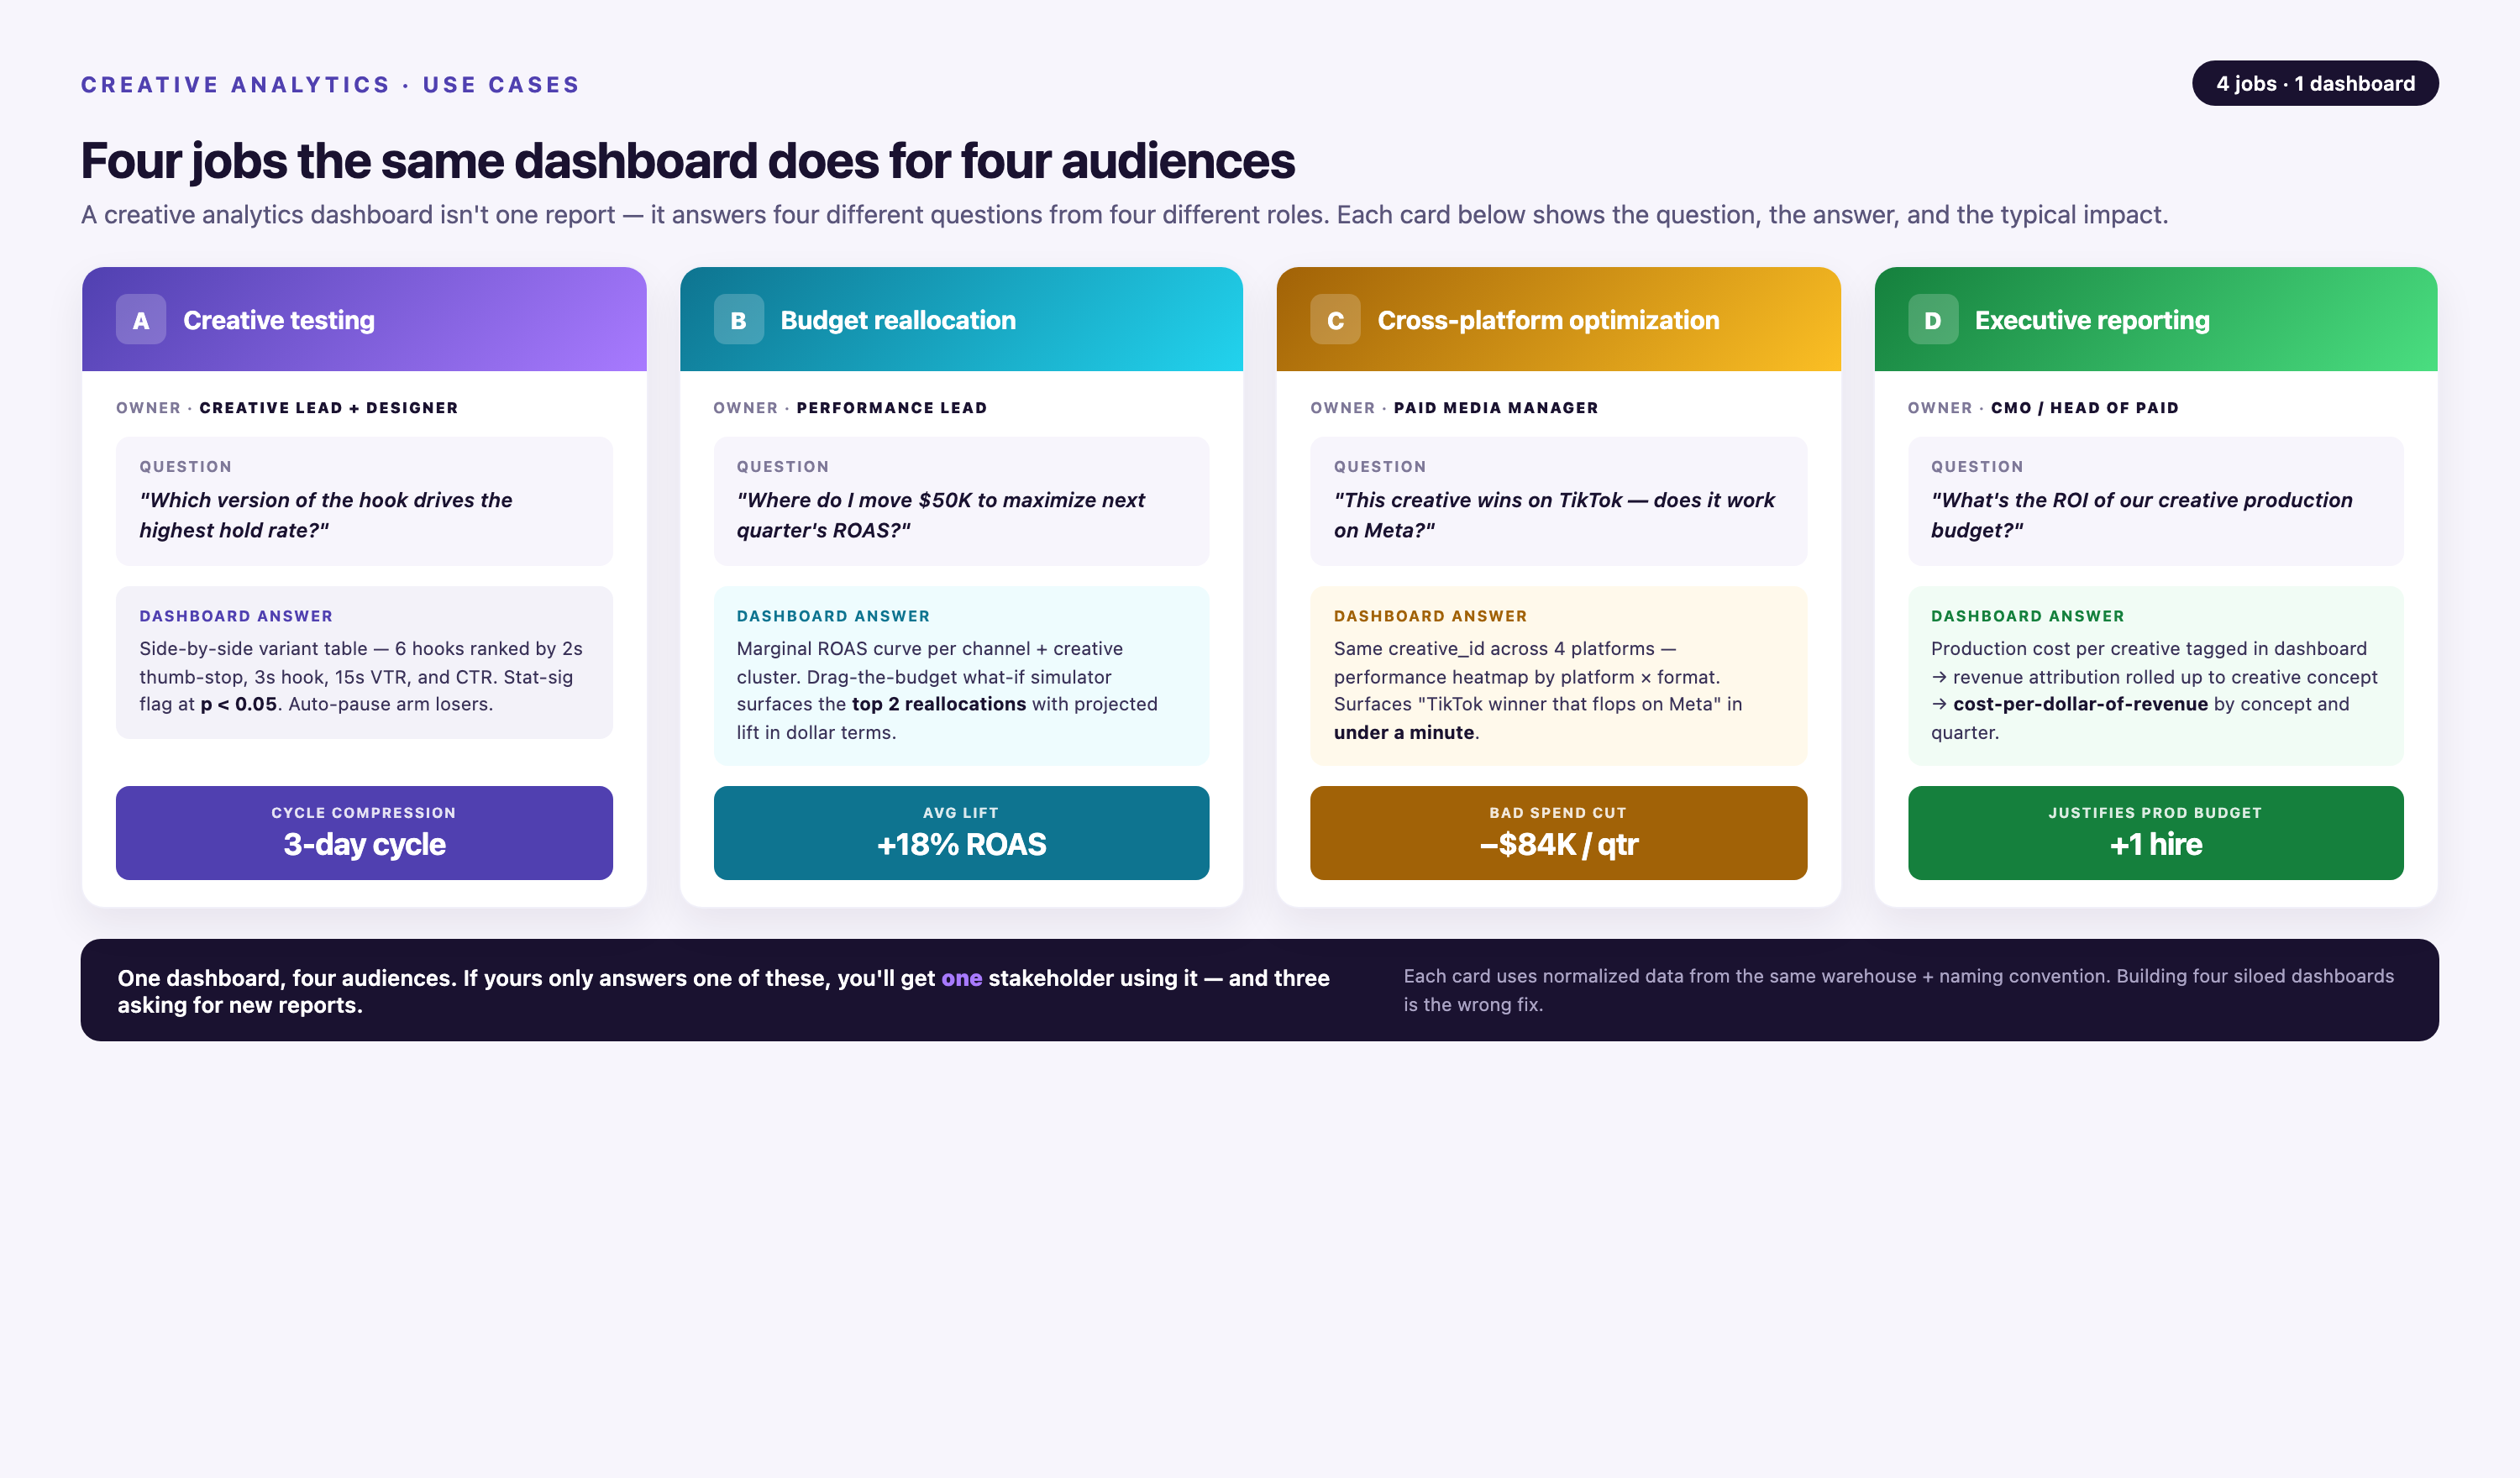
Creative Testing at Scale
Testing one creative variant at a time is too slow. Modern teams test 10+ variants simultaneously across 5+ platforms. A creative dashboard shows which variants win and which lose — across all platforms — in a single view.
Testing methodology matters. If you're running an A/B test with two headlines, you need statistical significance before declaring a winner. A creative dashboard should calculate confidence intervals and flag results that haven't reached significance yet. Declaring a winner at 80% confidence leads to false positives.
Winner-loser analysis reveals patterns. If three headlines all outperform the control, what do they have in common? If two images both underperform, what visual elements do they share? Pattern recognition scales creative testing from trial-and-error to systematic iteration.
Budget Reallocation
Budget reallocation is the highest-leverage action you can take with creative analytics. If Creative A has a 4.5x ROAS and Creative B has a 1.2x ROAS, shifting budget from B to A increases overall ROAS without increasing total spend.
Reallocation should happen at the platform level, not just the campaign level. If Creative A performs best on Meta but Creative C performs best on Google, your budget allocation should reflect that. Cross-platform dashboards make this visible.
Diminishing returns complicate reallocation. Scaling Creative A from $1K/day to $10K/day might drop ROAS from 4.5x to 2.8x as you exhaust high-intent audiences. A creative dashboard should model ROAS curves so you can predict performance at different spend levels.
Cross-Platform Optimization
Cross-platform optimization means adapting creative for each platform's unique context. The same core message can work everywhere, but the format, length, and tone need adjustment.
A 60-second product demo works on YouTube. It fails on TikTok, where 15 seconds is the norm. A text-heavy infographic works on LinkedIn. It fails on Instagram Stories, where visuals dominate. A creative dashboard that segments performance by platform reveals these mismatches.
Creative adaptation isn't just about format. Messaging hierarchy changes too. Facebook Feed users scroll passively. Google Search users have explicit intent. The same product might need a curiosity-driven hook on Facebook and a benefit-driven headline on Google.
Executive Reporting
Executives don't need creative-level detail. They need aggregated outcomes: total spend, total revenue, blended ROAS, and trend direction. A creative dashboard should support roll-up views that summarize performance without overwhelming leadership with granular data.
Executive dashboards should highlight variance from targets. If your target ROAS is 3.0x and you're currently at 2.4x, that's the headline. If spend is 15% over budget, that's the headline. Executives make decisions based on exceptions, not averages.
Common Creative Dashboard Mistakes
Most creative dashboards fail not because of missing data, but because of bad design choices. Here are the mistakes that break dashboards.
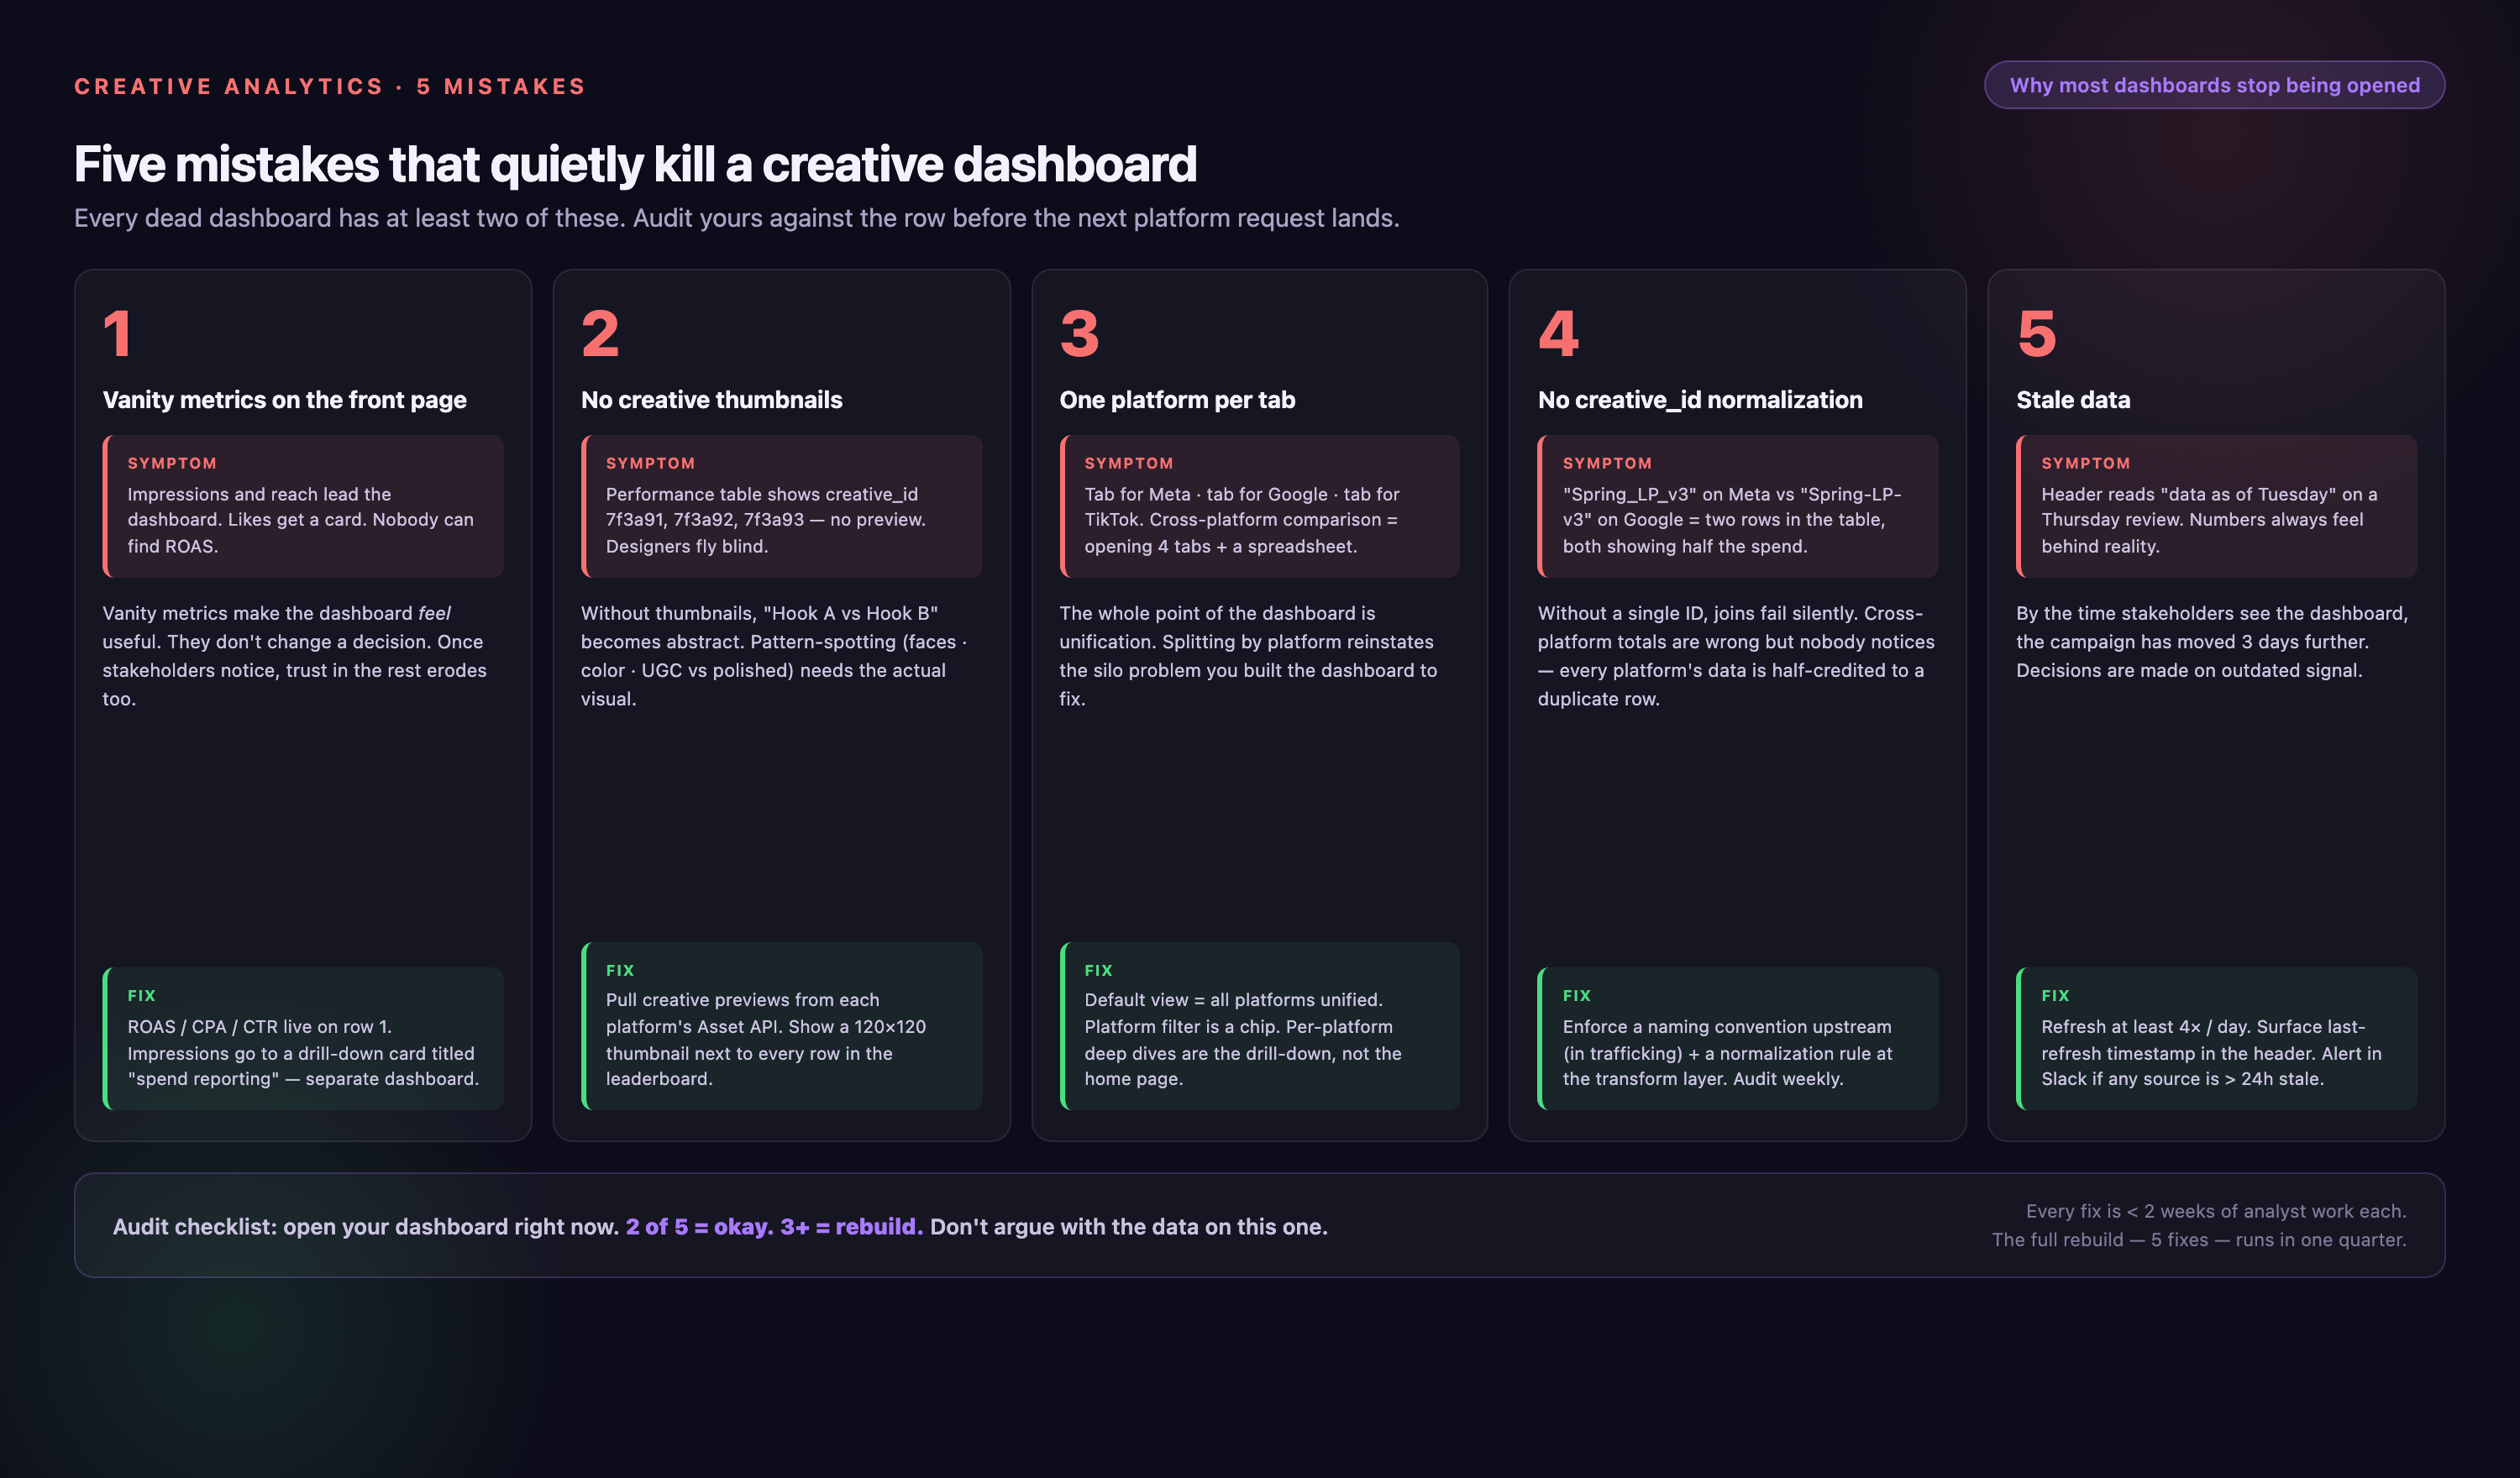
Vanity Metrics First
Impressions and reach are vanity metrics. They measure activity, not outcomes. A dashboard that leads with impressions trains teams to optimize for the wrong goal.
Start with ROAS or CPA. If those metrics are green, secondary metrics (CTR, engagement rate) provide context. If ROAS is red, nothing else matters. Reorder your dashboard so outcomes appear first.
No Segmentation
Aggregate creative performance hides critical insights. Creative A might have a 3.0x ROAS overall, but a 5.5x ROAS on mobile and a 1.2x ROAS on desktop. Without device segmentation, you'd never know to shift budget to mobile.
Segment by platform, device, audience, placement, and time. Interactive filters enable self-service drill-down so marketers can explore segments without rebuilding reports.
Stale Data
A dashboard that updates once per week is useless for active campaign management. By the time you see a problem, you've wasted three days of budget.
Daily updates are the minimum. Real-time updates are the standard for performance campaigns. If your dashboard shows yesterday's data at 10 AM, you're reacting to old information.
No Historical Context
A ROAS of 3.2x sounds good. But is it better or worse than last month? Last quarter? Last year? Without historical context, you can't identify trends.
Display prior-period comparisons by default. Show this month vs. last month, this quarter vs. last quarter, this year vs. last year. Trends matter more than point-in-time snapshots.
Ignoring Attribution Windows
Different platforms use different attribution windows. If you're aggregating conversions across platforms without normalizing attribution windows, your totals are wrong.
Choose a standard attribution window (7-day click is common, 28-day click for high-consideration products) and configure all platforms to report on that window. This requires pulling data via API — native platform exports default to platform-specific windows.
Scaling Creative Analytics
A creative analytics dashboard built for 3 platforms and 50 campaigns will break when you scale to 10 platforms and 500 campaigns. Scaling requires infrastructure designed for volume.
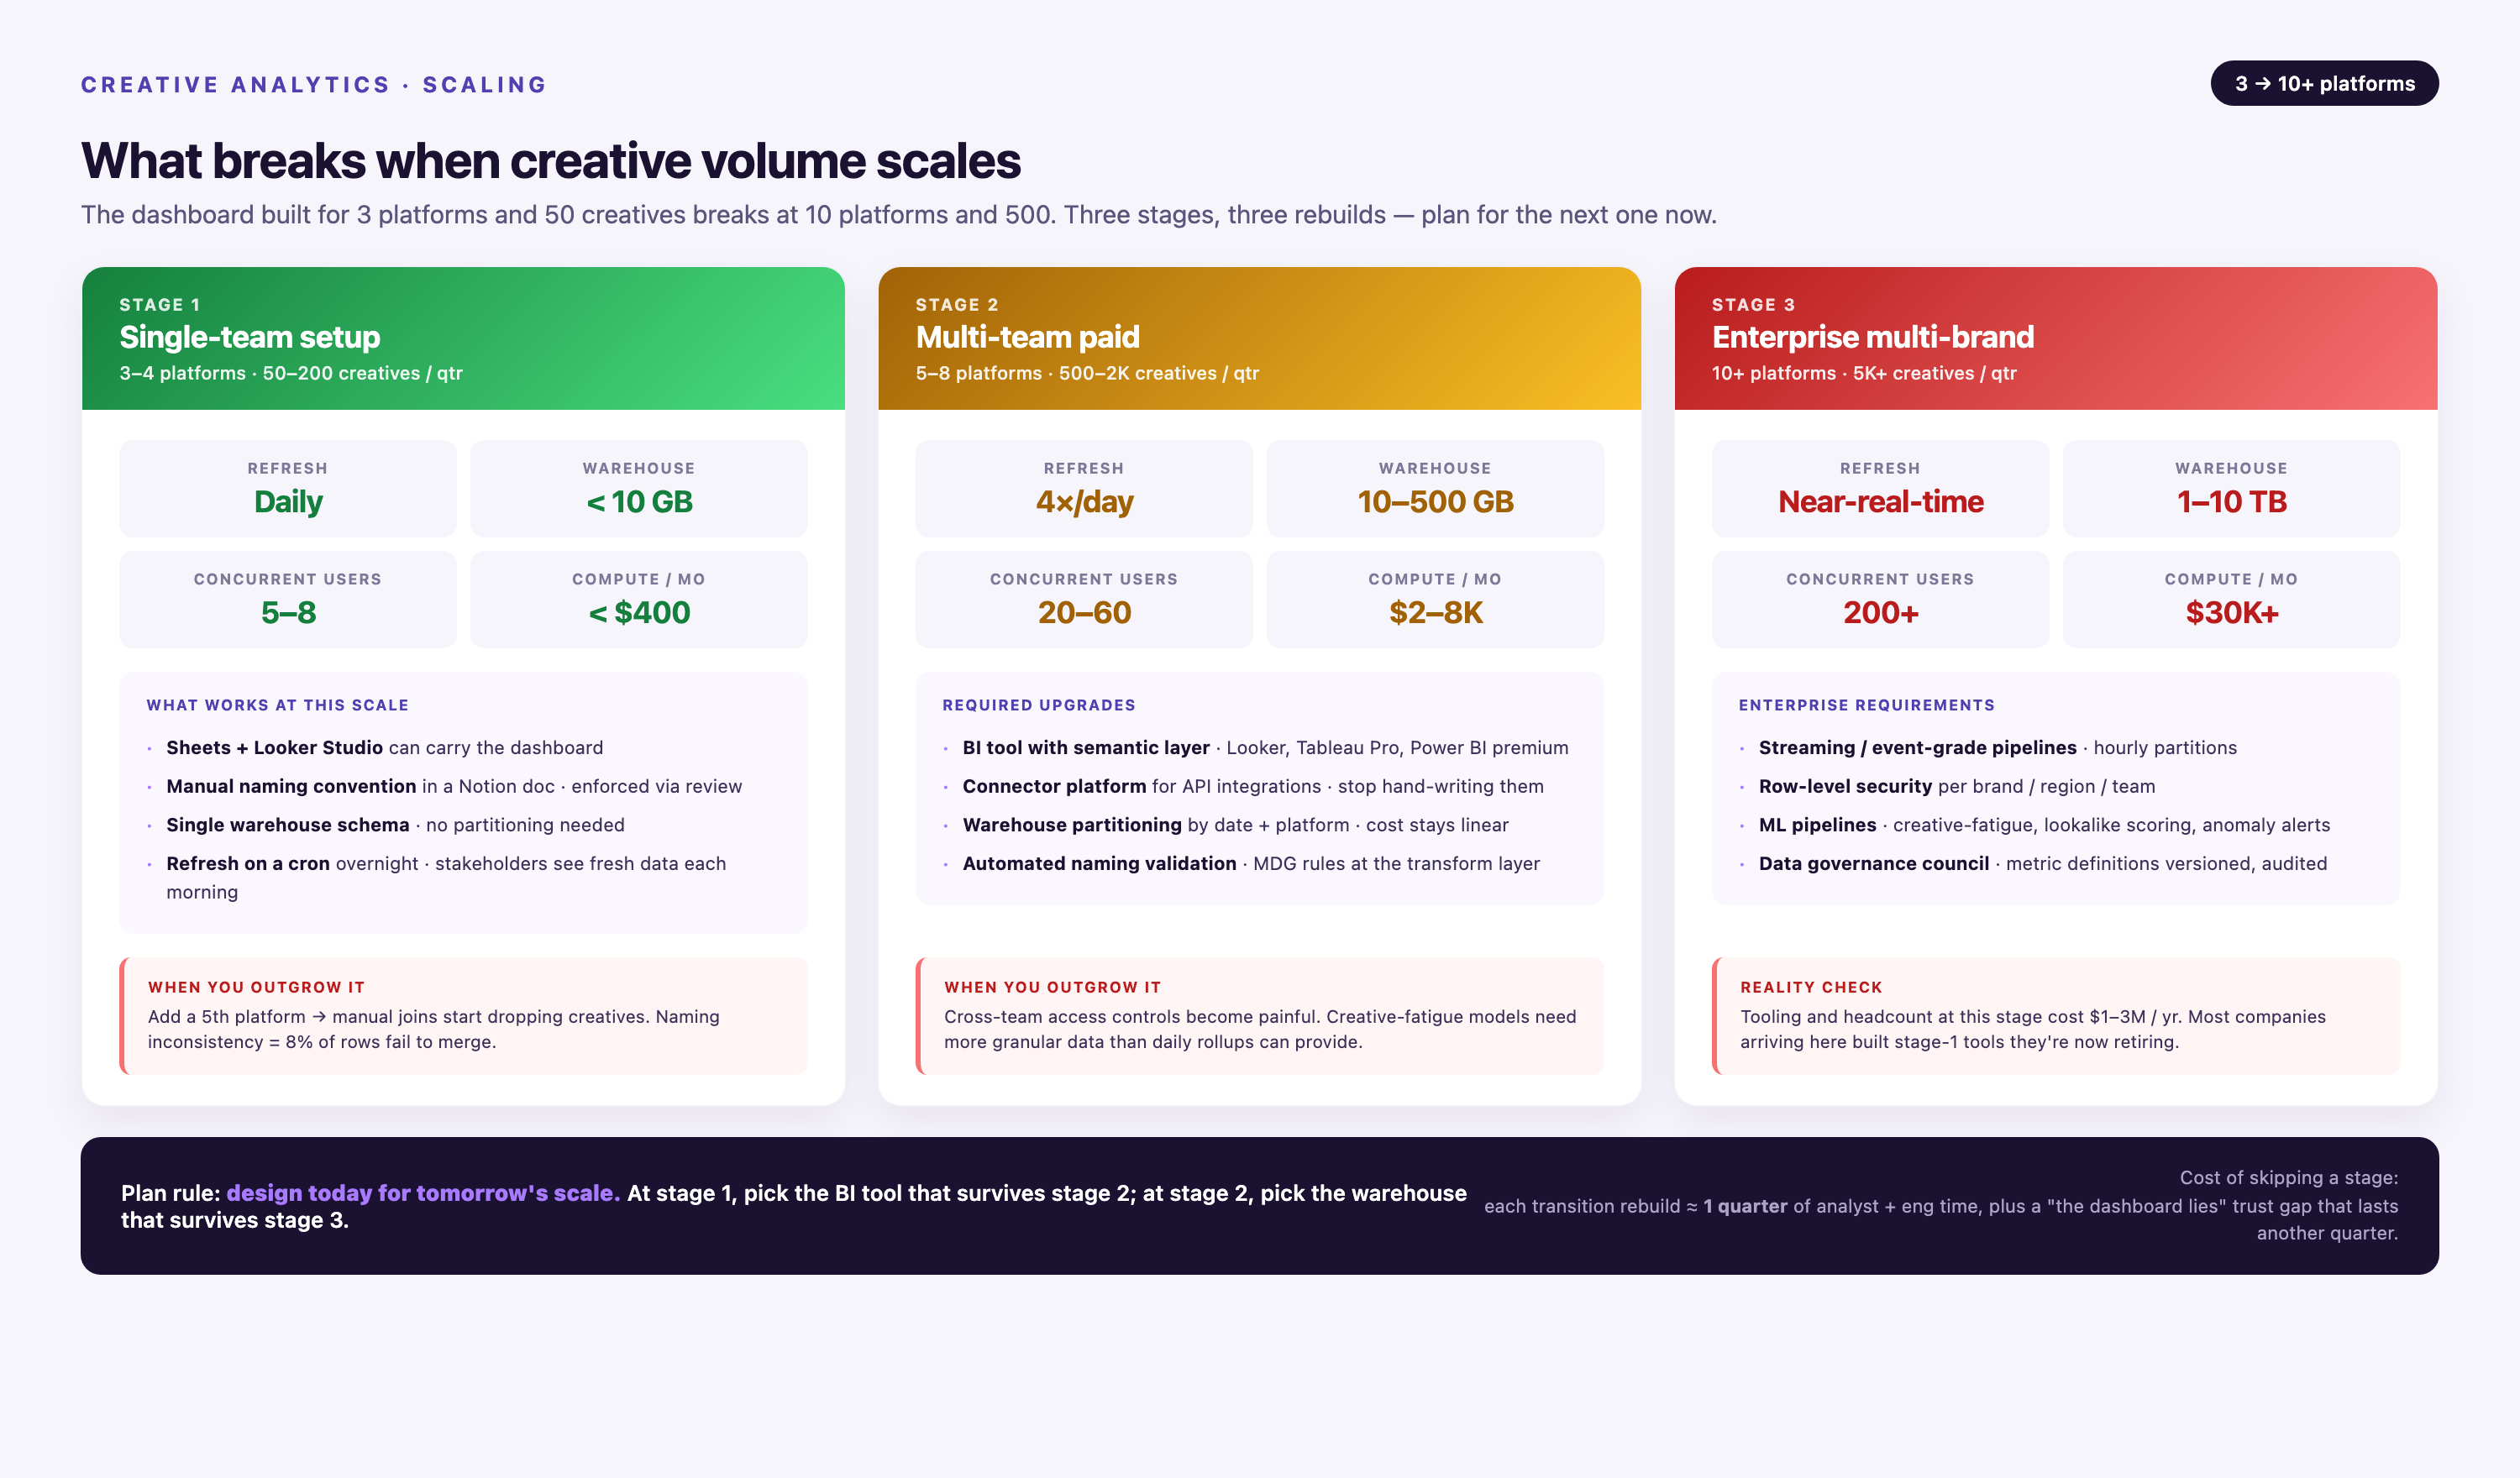
Data Volume
Creative-level data grows fast. If you're running 500 campaigns with 5 ad variants each across 8 platforms, that's 20,000 unique creative assets. Each asset generates daily performance data. Over a year, you're storing 7.3 million rows of performance data.
Data warehouses handle this volume, but query performance degrades without proper indexing and partitioning. A creative dashboard querying an unoptimized table might take 45 seconds to load. The same query on a partitioned, indexed table returns in under 2 seconds.
Improvado's Marketing Cloud Data Model includes pre-optimized schemas for creative performance data. Tables are partitioned by date and indexed on high-cardinality fields (creative_id, platform, campaign_id). Query performance stays fast as data volume grows.
Team Collaboration
Creative dashboards serve multiple teams: media buyers, creative strategists, analysts, and executives. Each team needs different views of the same data.
Media buyers need real-time performance by campaign. Creative strategists need aggregated performance by asset type. Analysts need raw data access for custom queries. Executives need weekly roll-ups.
A single dashboard can't serve all use cases. Build multiple views on top of the same data warehouse. Improvado supports unlimited dashboard connections, so you can connect Looker for analysts, Tableau for executives, and a custom internal tool for media buyers — all querying the same source of truth.
Automation
Manual creative analysis doesn't scale. Automating insights — flagging underperforming creatives, recommending budget shifts, identifying winning patterns — turns your dashboard from a reporting tool into a decision engine.
Improvado's AI Agent enables conversational analytics. Instead of writing SQL queries, you ask questions in plain English: "Which creatives have ROAS above 4x on Meta but below 2x on Google?" The Agent queries your data warehouse and returns results in seconds.
Automated alerts notify teams when thresholds are breached. If a creative's CPA exceeds $150, an alert fires. If daily spend exceeds budget by 20%, an alert fires. Automation catches problems before they become expensive.
Conclusion
A creative analytics dashboard turns fragmented platform data into unified cross-channel insights. It reveals which creative assets drive results, which burn budget, and where to reallocate spend for maximum impact.
Building one requires solving four problems: data extraction from 1,000+ sources, transformation that normalizes platform differences, storage that preserves historical context, and visualization that prioritizes outcomes over activity. Most teams underestimate the engineering effort required and overestimate what BI tools provide out of the box.
Marketing data platforms like Improvado compress months of engineering work into days. Pre-built connectors eliminate API complexity. Pre-configured transformations ensure metric consistency. Automated governance catches errors before they reach dashboards. Teams shift from building infrastructure to analyzing performance.
The value isn't the dashboard itself — it's the decisions the dashboard enables. Reallocating budget from underperforming creatives to winners. Identifying creative patterns that work across platforms. Catching performance drops before they waste budget. These decisions compound into measurable ROI.
FAQ
What's the difference between a campaign dashboard and a creative dashboard?
A campaign dashboard tracks performance at the campaign level — total spend, total conversions, aggregate ROAS. It tells you whether Campaign A or Campaign B performed better. A creative dashboard tracks performance at the asset level — which specific image, video, headline, or CTA drove results within each campaign. Creative dashboards provide the granularity needed to optimize individual assets, not just overall campaign strategy. Campaign dashboards answer "which campaign worked?" Creative dashboards answer "which creative worked, and why?"
How often should a creative dashboard update?
Update frequency depends on campaign type and budget velocity. Direct-response campaigns with five-figure daily budgets need real-time or near-real-time updates (every 15–30 minutes) so teams can catch underperforming creatives within hours. Brand campaigns with monthly budgets can update once per day without losing decision-making value. Most teams use daily batch updates as the baseline, with real-time updates for high-spend campaigns. Avoid weekly updates — you'll miss performance shifts until it's too late to course-correct.
Can I track creative performance from offline channels?
Yes, but it requires instrumentation. Offline channels (TV, radio, print, out-of-home) don't generate digital tracking events, so you need proxy metrics. Unique promo codes, dedicated landing pages, and call tracking numbers tied to specific creatives allow you to measure offline creative performance. Time-series analysis can also attribute lift: if a TV creative runs in Market A but not Market B, comparing web traffic and conversions between markets reveals incremental impact. Offline creative data integrates into a unified dashboard the same way online data does — via API or manual upload, then transformed and stored in your warehouse.
How do I standardize creative naming conventions across platforms?
Standardized naming conventions are essential for cross-platform creative dashboards. Establish a taxonomy before launching campaigns: [Brand]_[Campaign]_[Format]_[Variant]_[Platform] is a common structure. Example: AcmeCo_Q1Launch_Video_V3_Meta. Enforce this naming convention across all platforms so automated extraction logic can parse asset metadata consistently. If naming conventions are inconsistent, you'll need manual mapping in your transformation layer, which doesn't scale. Document the convention in a shared resource (wiki, style guide) so all team members follow it.
What happens if a platform changes its API?
Platform API changes break custom-built pipelines unless you maintain them actively. Meta, Google, TikTok, and LinkedIn all deprecate endpoints, rename fields, and change data structures multiple times per year. If you built your dashboard on custom code, you're responsible for monitoring API changelogs and updating your integration when breaking changes occur. Improvado monitors API changes across 1,000+ platforms and updates connectors automatically. When Meta deprecates an endpoint, Improvado reroutes data extraction to the new endpoint without breaking your pipeline. You don't need to rebuild your dashboard every time a platform updates.
How do I compare creative performance for products with different price points?
Use ROAS (return on ad spend) instead of CPA (cost per acquisition). CPA is an absolute metric — a $50 product and a $500 product will have vastly different CPAs even if both are profitable. ROAS is a ratio: revenue divided by spend. A 3.0x ROAS means the same thing whether you're selling $50 products or $500 products — every dollar spent returns three dollars in revenue. When comparing creative performance across product lines with different economics, ROAS normalizes the comparison. Segment your dashboard by product line so you can benchmark ROAS within each segment.
Can I track creative fatigue in the dashboard?
Yes. Creative fatigue occurs when audience response to a creative declines over time due to repeated exposure. Track fatigue by monitoring CTR and conversion rate trends for each creative over time. If Creative A's CTR was 2.8% in Week 1 and drops to 1.4% in Week 4 with consistent targeting and budget, that's fatigue. Set up automated alerts when performance metrics drop below a threshold or decline week-over-week by more than a set percentage. Rotate creatives proactively before fatigue causes performance collapse. Most platforms show frequency (average impressions per user) — track this alongside performance metrics to identify fatigue early.
How do I handle multi-touch attribution in a creative dashboard?
Multi-touch attribution assigns fractional credit to each creative touchpoint in a customer journey. First-touch attribution gives 100% credit to the first ad a user saw. Last-touch gives 100% to the last ad before conversion. Linear attribution splits credit equally across all touchpoints. Time-decay attribution gives more credit to recent touchpoints. Your dashboard should support multiple attribution models because no single model is universally correct. Configure attribution logic in your data transformation layer, then expose model selection as a dashboard filter. This allows analysts to compare how creative performance changes under different attribution assumptions.
Should I connect creative-level data to my CRM?
Yes, if you're running lead-gen or B2B campaigns. Connecting creative data to your CRM (Salesforce, HubSpot, etc.) enables closed-loop reporting: you can see which creative drove a lead, whether that lead became an opportunity, and whether the opportunity closed. This reveals creative performance beyond initial conversion. Creative A might generate more leads than Creative B, but if Creative B's leads close at a higher rate, Creative B is more valuable. CRM integration requires passing creative metadata (creative_id, campaign_id, platform) through your lead capture forms or via hidden fields, then joining creative performance data with CRM data in your warehouse.
How does Improvado handle schema changes differently than other tools?
Most ETL tools break when a data source changes its schema. If Meta renames a field from ad_name to creative_name, a basic connector stops working until you manually update the field mapping. Improvado maintains backward compatibility. When a source schema changes, Improvado updates the connector and preserves historical data under the old schema while ingesting new data under the new schema. Your dashboard queries a unified schema that maps both old and new fields to a consistent column name. You don't lose historical data and you don't need to rewrite SQL queries. This approach protects long-term trend analysis — you can still compare 2026 creative performance to 2024 creative performance even though the underlying API changed twice.
Related reading: 12 Best Creative Analytics Tools Compared (2026)

