
Marketing budgets fell to 7.7% of company revenue in 2024, down from 9.1% the year before, and Gartner's CMO Spend Survey found proving financial contribution remains the top executive challenge. A CMO dashboard answers three questions in under 30 seconds—are we hitting pipeline, where is spend leaking, what changed—and separates from operational reports by focusing on revenue outcomes rather than campaign detail. This guide covers the metrics that survive board review, layout principles, four archetypes by company type, a readiness diagnostic, and the common mistakes that get CMOs replaced inside 18 months.
Key Takeaways
• Marketing budgets dropped to 7.7% of company revenue in 2024, down from 9.1% in 2023, intensifying CMO pressure to prove ROI.
• CMO dashboards must answer three questions in under 30 seconds: hitting pipeline, spend leaks, and metric changes—separating them from operational reports.
• The 14-metric framework includes CAC, LTV, pipeline influenced, and MER, each mapping to specific CEO questions about revenue outcomes.
• B2B SaaS CMOs target 3:1 LTV:CAC ratio at growth stage and 6-9 month payback periods; enterprise accepts 18-24 months with multi-year contracts.
• Readiness diagnostic scores 0-10; below 4 indicates survival risk requiring metric governance fixes before adding dashboard features.
CMO Dashboard Readiness Diagnostic
Before building a new dashboard or optimizing an existing one, assess whether your current reporting setup will survive contact with a CEO or board. This 10-question diagnostic scores readiness across four dimensions: executive trust, operational speed, cross-functional alignment, and metric governance. Answer yes or no to each question, then tally your score.
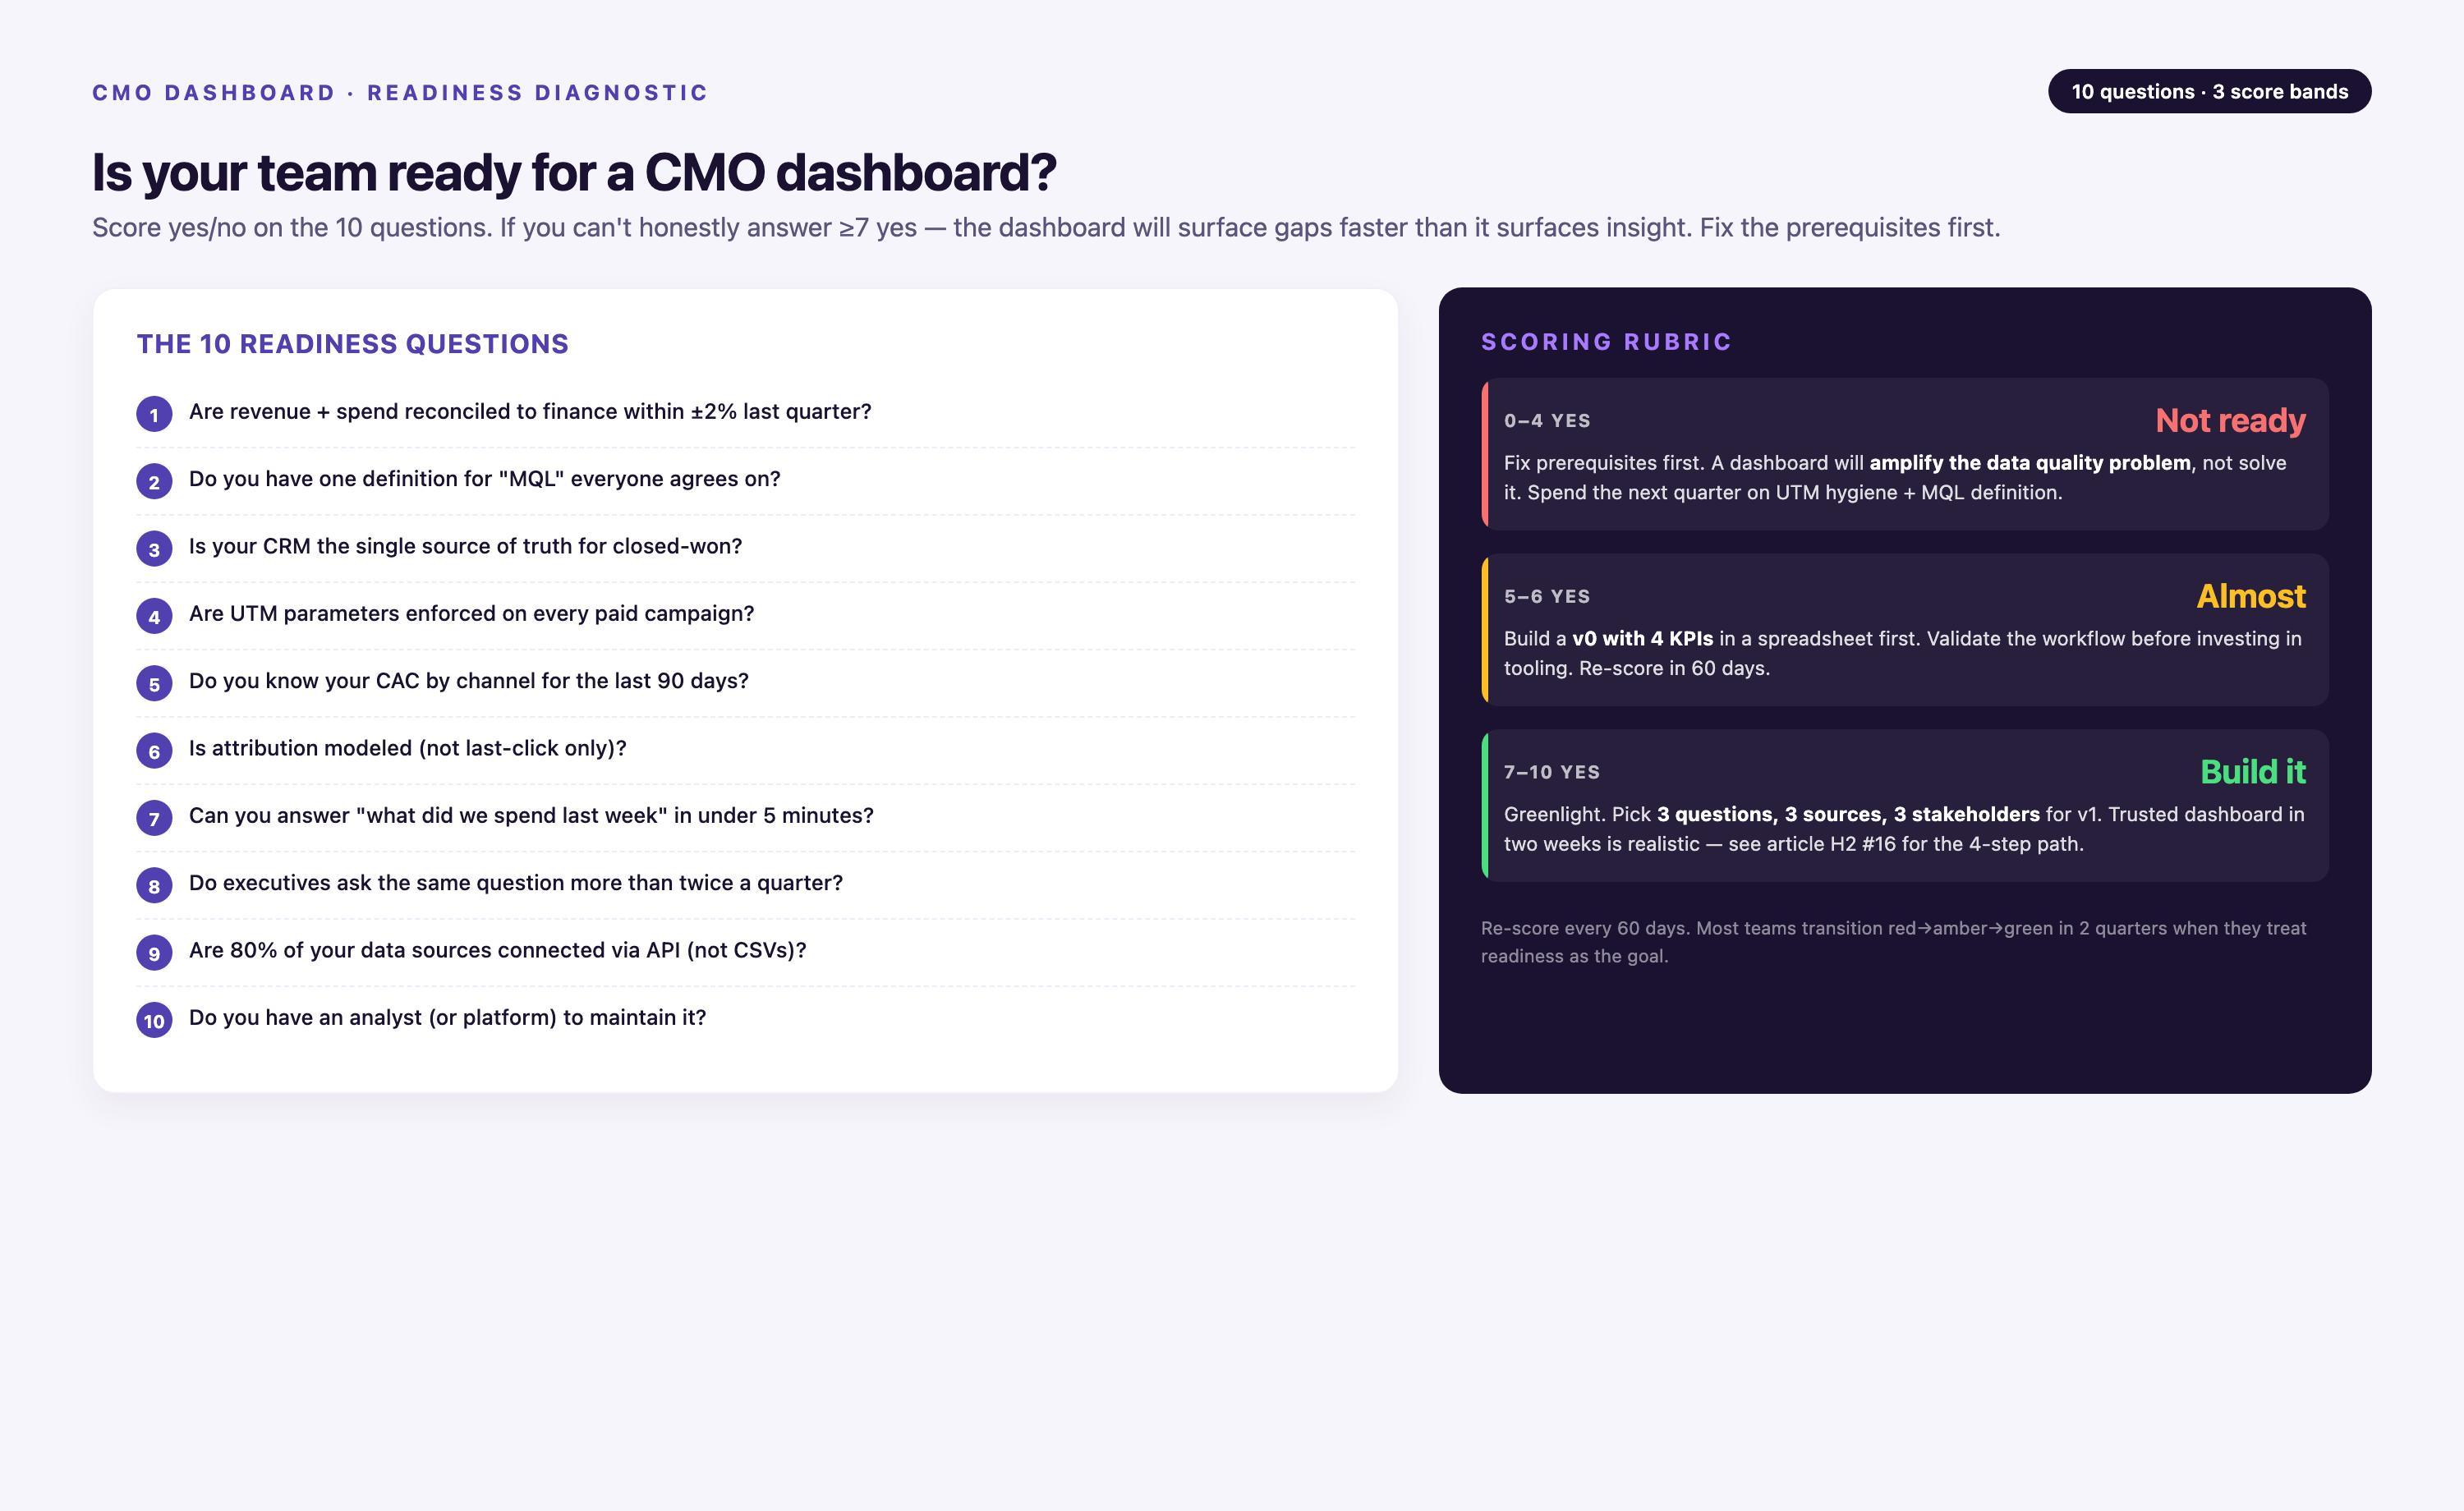
The 10 Readiness Questions
• Can you answer the CEO's revenue attribution question in under 60 seconds without calling marketing ops? Tests whether dashboard contains the answer or requires a follow-up report.
• Does your dashboard refresh before the CFO checks Salesforce Monday morning? Tests data freshness—if the CFO learns about pipeline changes before you do, you've lost credibility.
• Do sales and marketing agree on this quarter's pipeline number within 5%? Tests CRM sync integrity and metric definition alignment.
• Can you explain any metric spike or drop of 15%+ in under 2 minutes with supporting data? Tests drill-down capability and causal attribution.
• Has the CEO opened your dashboard at least twice in the last month without prompting? Tests relevance—if it's not used, it's not trusted.
• Is there a written, version-controlled definition for CAC, LTV, and marketing-sourced revenue that finance has approved? Tests governance—formula drift kills trust.
• Can you show incrementality or contribution for at least your top three channels? Tests whether you're measuring real impact or just correlation.
• Does the dashboard fit on one screen without scrolling for the three metrics the CEO cares about most? Tests design—executives won't scroll.
• Have you successfully defended a budget allocation decision in a board meeting using this dashboard in the last 6 months? Tests real-world utility under pressure.
• Is there a documented process for what happens when a key metric moves 20%+ week-over-week? Tests operational readiness—alerts without action plans are noise.
Scoring Rubric and Next Steps
• 0-3 Yes: Survival risk. Your dashboard is a reporting artifact, not a decision tool. The CEO doesn't trust it, finance questions your numbers, and you're defending the function instead of leading it. Priority: Start with metric definition governance (get finance signoff on CAC and LTV formulas in writing), then fix data refresh cadence. Don't add metrics—fix the foundation.
• 4-7 Yes: Functional but vulnerable. The dashboard works for weekly reviews but won't survive a board crisis. You can answer most questions but not in real time, and there are gaps in attribution or incrementality. Priority: Add drill-down capability for variance explanation, implement hourly refresh for paid spend and pipeline, and document your three most important metric definitions. Test by running a mock board Q&A with your CFO.
• 8-10 Yes: Board-ready. Your dashboard is a strategic asset. The CEO uses it between meetings, finance trusts your numbers, and you've successfully defended budget decisions under scrutiny. Priority: Maintain governance rigor, add edge-case scenarios (M&A integration, new product line attribution), and consider whether you need separate views for board vs weekly exec review.
The 14 Metrics Every CMO Dashboard Needs
These fourteen metrics cover the full marketing P&L—acquisition cost, customer value, pipeline, efficiency, brand, channel mix, retention, and incrementality. Each one maps to a business question a CEO will actually ask. Benchmarks vary by industry and stage; contextualize every number.
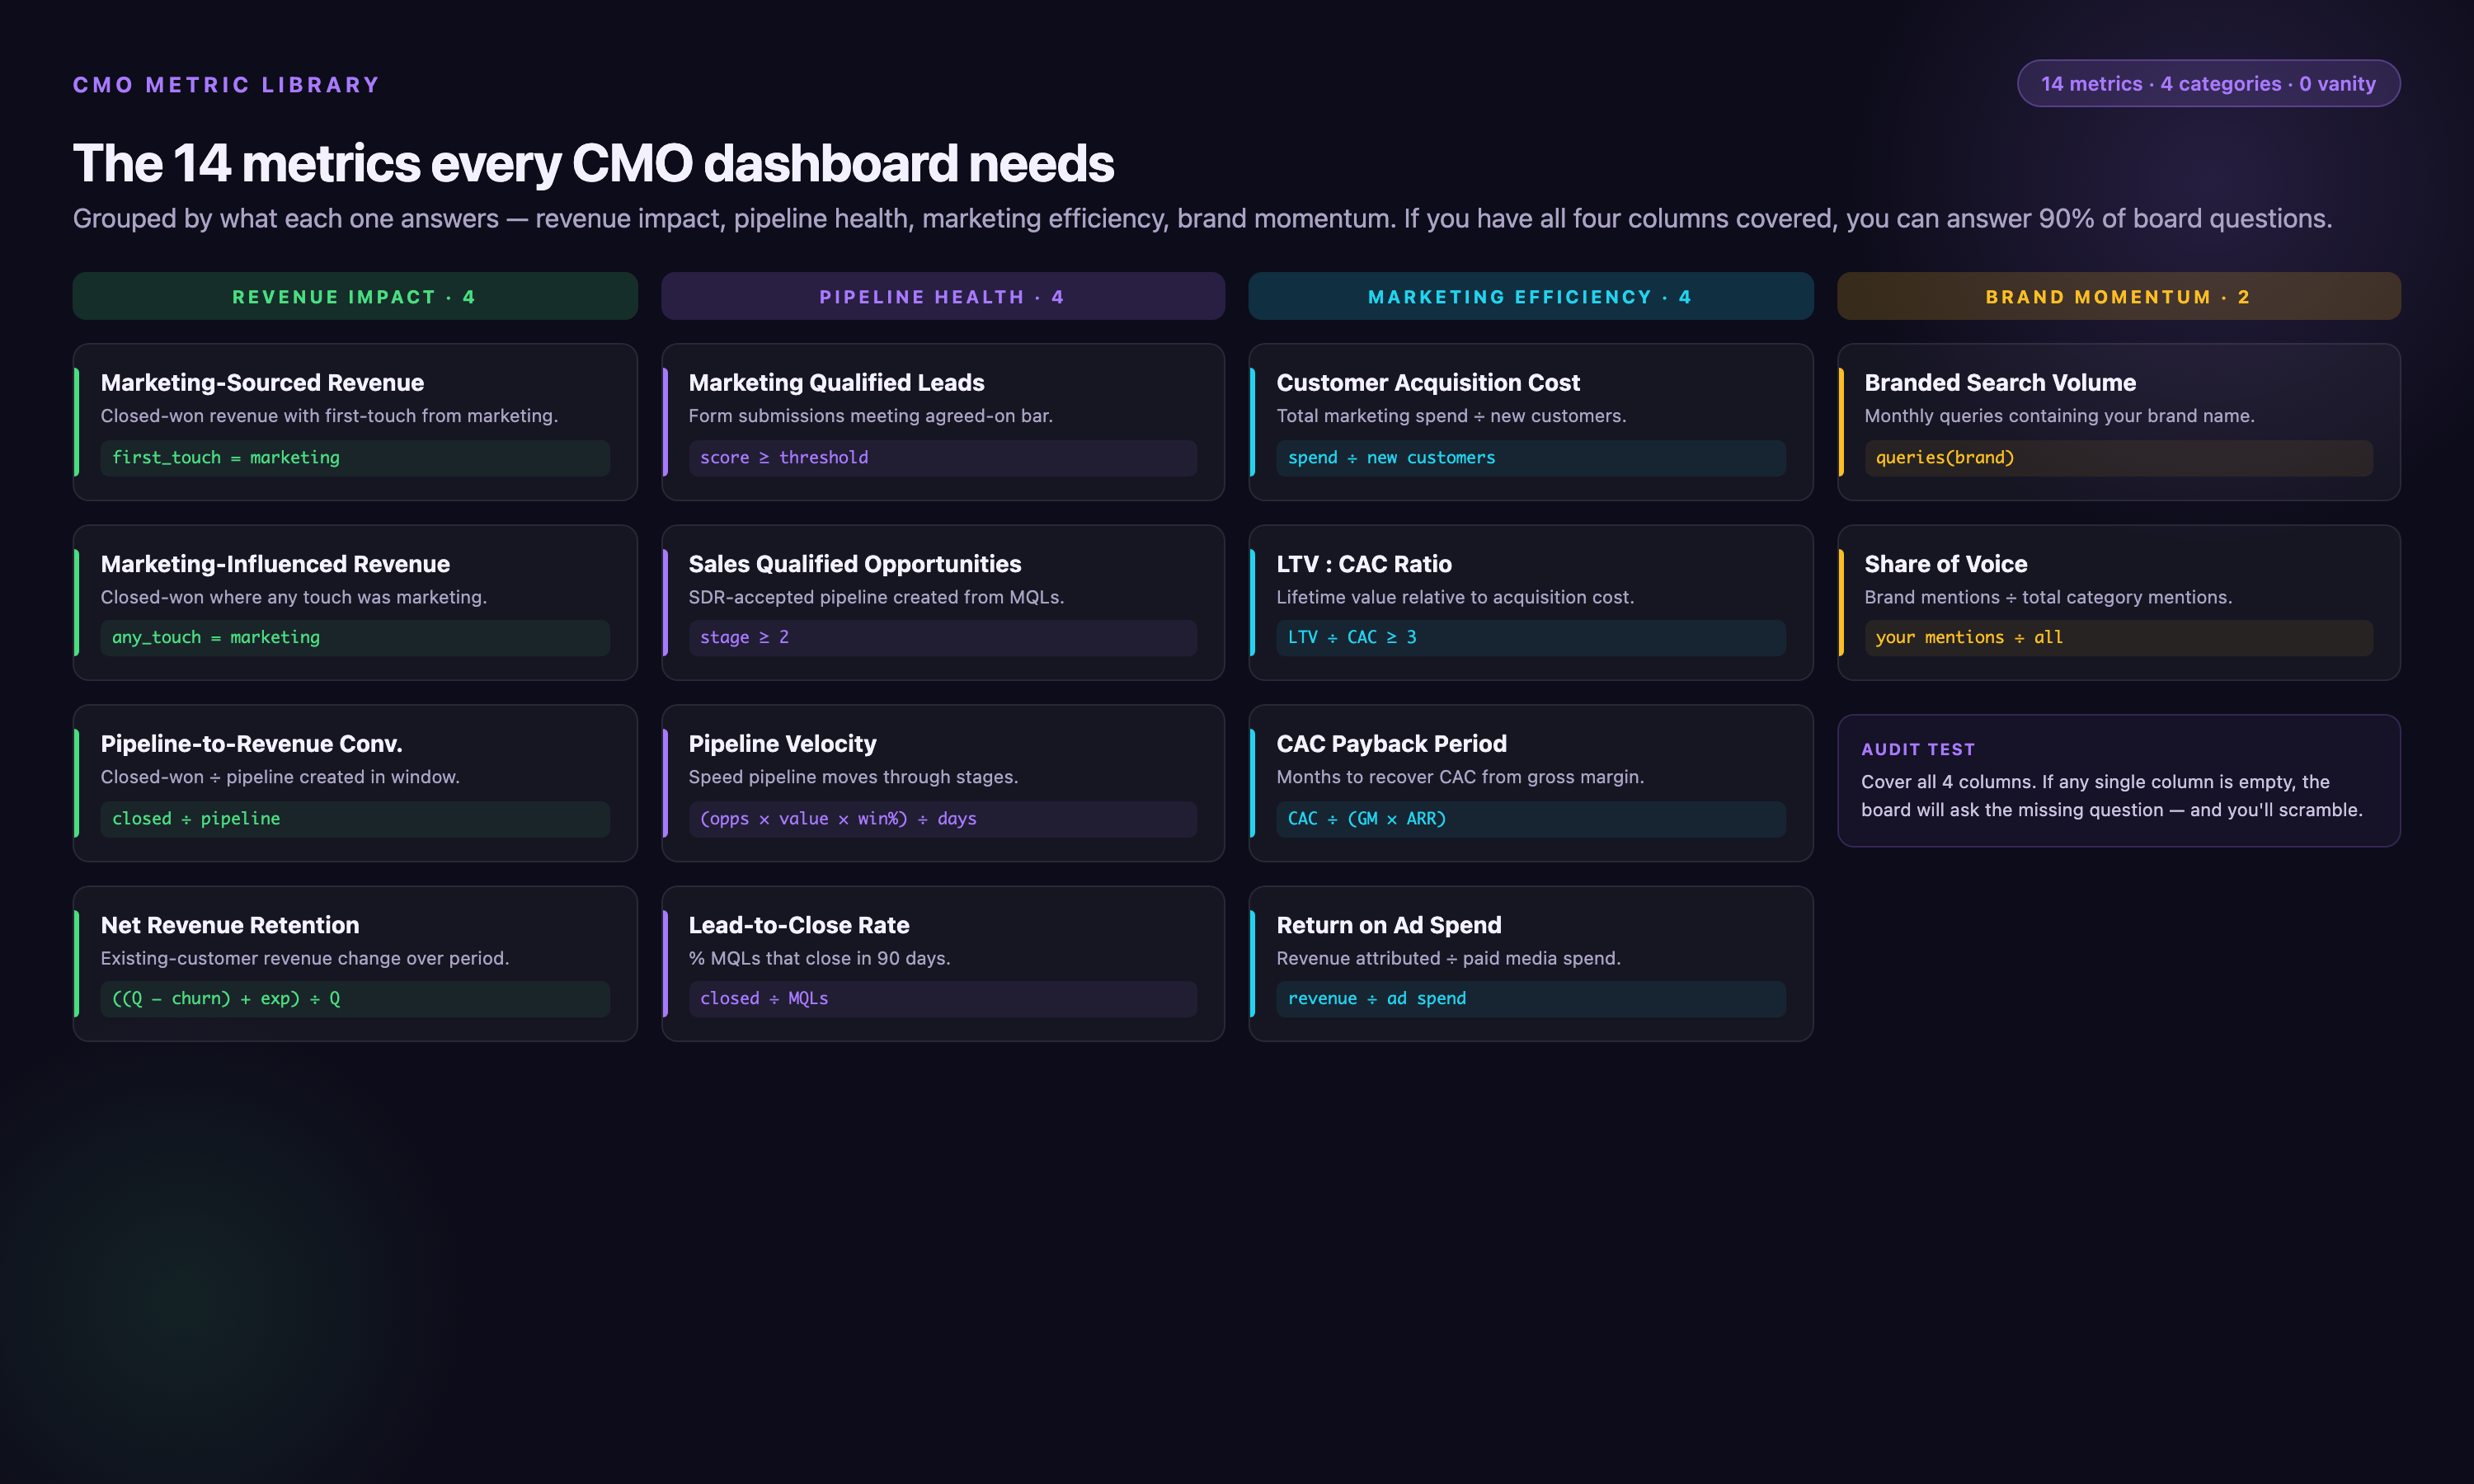
• Customer Acquisition Cost (CAC) — Total sales and marketing spend divided by new customers acquired in the period. Segment by channel and by new-business versus expansion. Benchmark context: Early-stage B2B SaaS typically runs $500-$1,500 CAC; growth-stage $1,500-$5,000; enterprise $10,000-$50,000 depending on ACV. E-commerce CAC ranges $20-$200. High variance by vertical—financial services and healthcare often 2-3× higher due to compliance and longer sales cycles.
• Lifetime Value (LTV) — Gross margin multiplied by average customer lifespan (or total contract value for known-duration contracts). Pair with CAC as an LTV:CAC ratio. Benchmark context: Target 2:1 at early stage (covering CAC and providing runway), 3:1 at growth stage (profitable unit economics), 4:1+ at enterprise maturity (capital-efficient scaling). Subscription businesses calculate using monthly recurring revenue × gross margin % × average retention months.
• CAC Payback Period — Months required to recoup CAC from gross margin. Calculated as CAC ÷ (monthly recurring revenue × gross margin %). Benchmark context: Under 12 months is healthy for most SaaS; 6-9 months for PLG motion; 18-24 months acceptable for enterprise with multi-year contracts. E-commerce targets 2-4 months due to lower LTV and faster repeat purchase cycles. Payback longer than 24 months signals either very high LTV (defensible) or inefficient acquisition (red flag).
• Pipeline Influenced — Open pipeline dollars where marketing contributed at least one touch. This is the credibility metric with sales—shows marketing's footprint across all deals, not just sourced opportunities. Include methodology note (first-touch, multi-touch, or any-touch attribution) in dashboard footer to prevent definition disputes.
• Marketing-Sourced Revenue — Closed-won revenue where the first touch was marketing-owned. This is the credibility metric with finance—ties spend directly to booked revenue. Note that this sidesteps attribution model debates by using first-touch only; if your CEO prefers multi-touch, document the model and get CFO signoff in writing.
• Marketing Efficiency Ratio (MER) — Total revenue divided by total marketing spend over the same period. The blended efficiency metric that survives channel-attribution arguments. Benchmark context: Early-stage targets 0.8-1.2 (investing ahead of revenue), growth-stage 1.5-2.5 (approaching break-even on spend), mature companies 3-5+ (profitable marketing). E-commerce often runs 1.2-2.0 due to thin margins. MER below 0.5 for more than two quarters signals unsustainable burn.
• CMO NPS (Internal) — A quarterly pulse survey from sales and customer success on marketing's perceived value. Soft metric, but it anecdotally correlates with CMO tenure and cross-functional collaboration quality. If consistently below 30, you have a political problem that no dashboard will fix—address relationship and expectation-setting first.
• Brand Share of Voice — Branded search volume (via SEMrush, Ahrefs, or Google Trends) or social listening mention share (via Brandwatch, Sprout Social) versus top three competitors. The leading indicator for demand—moves 1-2 quarters before pipeline. Include methodology note: branded search is measured as exact-match brand term queries; social share of voice is brand mentions divided by total category mentions within defined keyword set.
• Channel Mix — Spend and output (leads, pipeline, revenue) by channel as a stacked bar chart. Shows concentration risk (over-reliance on one channel) and portfolio drift (spend shifting away from highest-performing channels). Best practice: show both input (% of spend) and output (% of revenue) side-by-side to surface efficiency gaps.
• Funnel Velocity — Average days from MQL to closed-won, segmented by source, industry, or deal size. Shows whether marketing is sourcing fast-closing demand (warm inbound, high intent) or stale lists (cold outbound, long nurture). Velocity slowing over time often signals declining lead quality or sales capacity constraints, not marketing performance.
• Return on Ad Spend (ROAS) — Revenue attributed to paid advertising divided by ad spend. Calculated as (attributed revenue ÷ ad spend). Benchmark context: E-commerce targets 4:1 or higher; B2B SaaS with long sales cycles may accept 2:1-3:1 if LTV justifies it. ROAS below 1:1 is unsustainable unless you're buying market share in a land-grab. Note: ROAS measures correlation, not incrementality—pair with incrementality testing where budget allows.
• Customer Lifetime Value by Cohort (CLV) — Total gross profit generated by a customer over their entire relationship, segmented by acquisition cohort (month or quarter). More granular than aggregate LTV; shows whether recent cohorts are more or less valuable than older ones. Declining CLV by cohort signals either product-market fit erosion or acquisition channel quality degradation.
• Churn Rate — Percentage of customers who cancel or do not renew in a given period. Calculated as (customers lost ÷ customers at start of period). Benchmark context: B2B SaaS targets under 5% monthly churn (or under 2% for enterprise); consumer subscription services tolerate 5-10%; e-commerce tracks repeat purchase rate instead. Churn above 7% monthly makes growth nearly impossible without exponential acquisition spend.
• Incrementality Lift — Revenue or conversions attributable to marketing activity beyond what would have occurred organically, measured via geo-holdout tests, matched-market testing, or conversion lift studies. For companies with test budget ($50K+ quarterly ad spend), this is the gold standard for proving contribution. Incrementality testing shows that 20-40% of attributed conversions in last-click models would have happened anyway—meaning your true ROAS may be half of reported ROAS. If you lack budget for formal testing, use proxy: compare branded vs non-branded search performance, or run periodic channel pause tests.
CMO Marketing Dashboard Layout Principles
A CMO marketing dashboard is read in under 60 seconds by people who didn't build it. Five layout rules keep it usable and trusted.
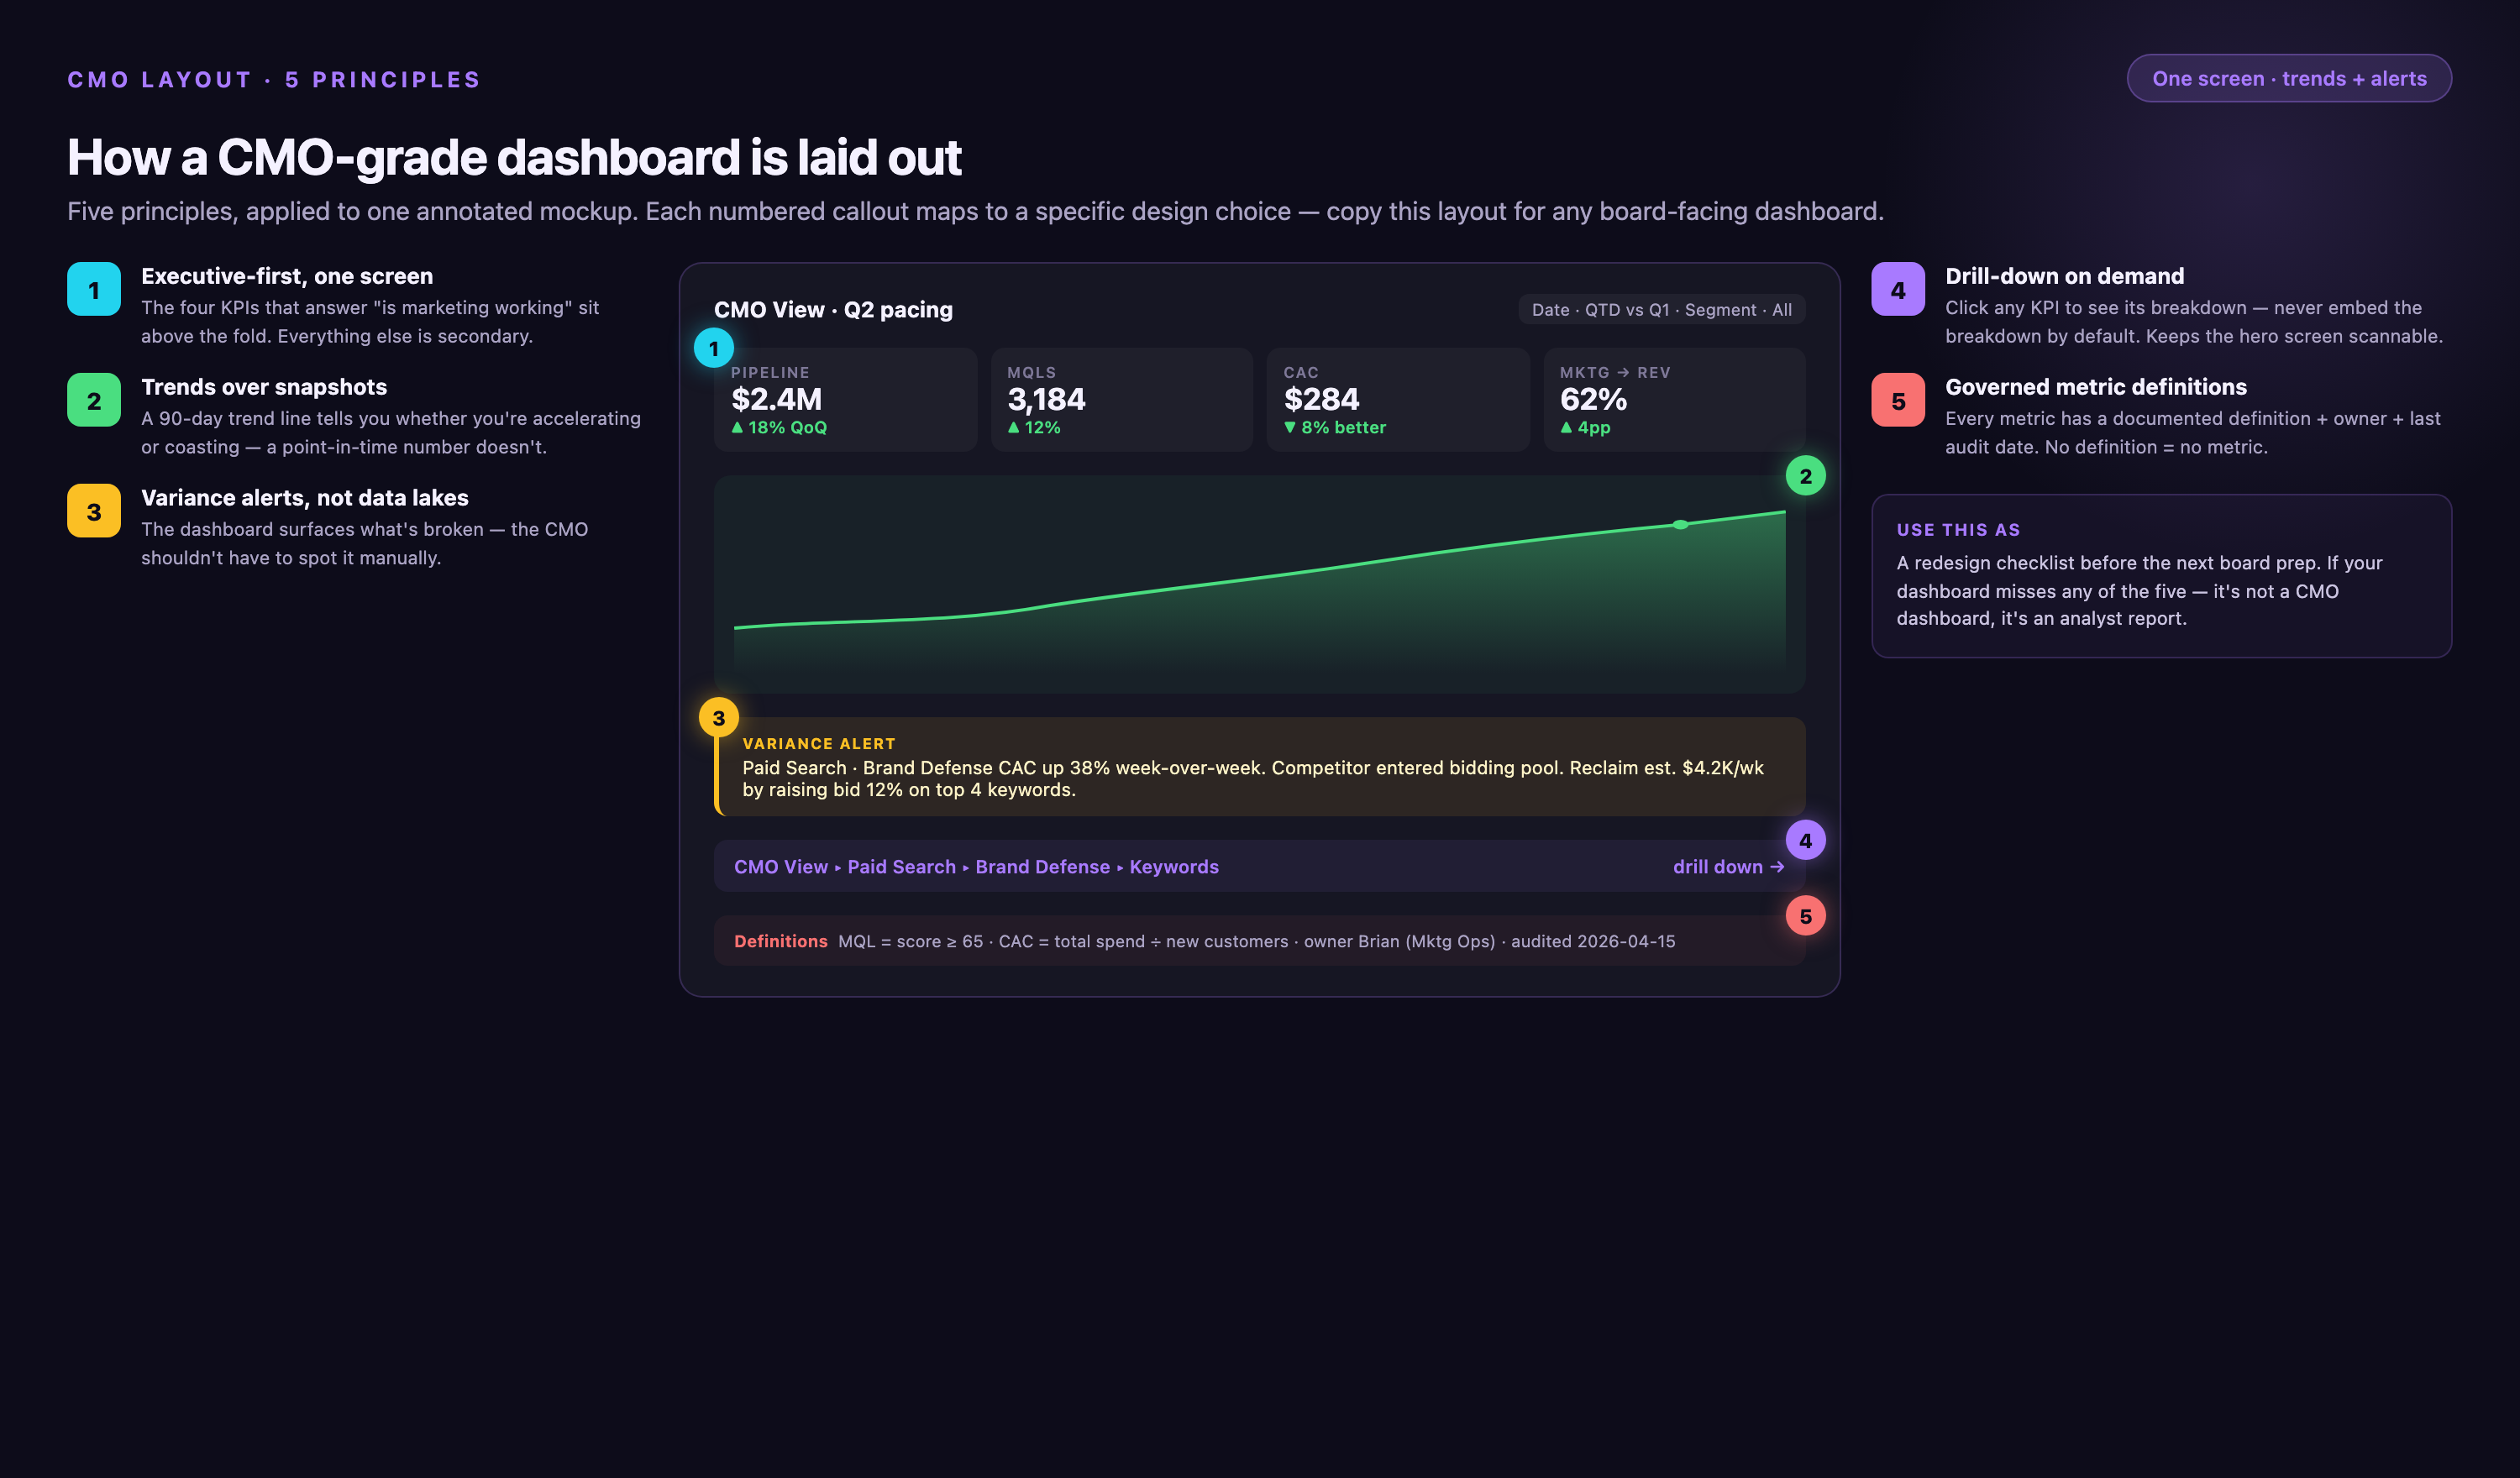
1. Executive-First, One Screen
The top row shows the three metrics the CEO cares about—pipeline to plan, revenue to plan, CAC payback. Everything below is supporting detail. If the CMO has to scroll to find the headline number, the dashboard failed. Use card or scorecard layout with large numerals (36pt+), current value, prior period comparison, and trend arrow (↑↓→).
2. Trends Over Snapshots
A single number is a trap. "CAC is $1,240" means nothing without last quarter's $980 and the trailing-twelve-month trendline. Every tile should show direction, not just position. Line charts for trends, sparklines for inline context. Include visual benchmarks: if CAC payback target is 12 months, draw a horizontal reference line at 12 so variance is instant.
3. Variance Alerts, Not Data Lakes
A good CMO dashboard flags the three things that moved significantly since last review—not the 47 metrics that stayed flat. Conditional formatting, color-coded thresholds (green <10% variance, yellow 10-20%, red >20%), and callout annotations do the work. Use automated alerts: if MER drops more than 15% week-over-week, the dashboard sends a Slack notification with drill-down link before the Monday exec meeting.
4. Drill-Down on Demand
The executive view stays clean, but any tile should be one click from the channel, campaign, or cohort detail. This matters when the CEO asks "why did MER drop?" live in a board meeting. Implement as: scorecard tile links to pre-filtered view in BI tool, or hover tooltip shows top three contributing factors. Never require a separate report request—answers must be synchronous.
5. Governed Metric Definitions
Dashboard trust collapses when the CFO asks "how do you calculate marketing-sourced revenue?" and the CMO can't reproduce last quarter's number because the formula changed and no one documented it. Metric governance prevents definition drift. Requirements: (1) Written definition for every revenue-tied metric (CAC, LTV, pipeline influenced, marketing-sourced revenue) stored in a version-controlled doc or wiki. (2) Approval process—only CMO or VP Finance can change a formula, and changes require email notification to exec team. (3) Change log maintained in dashboard footer or separate audit trail ("CAC formula updated 2026-03-15: now includes sales salaries"). (4) Quarterly reconciliation—finance pulls the same metrics from their system, CMO dashboard must match within 5%. This is unglamorous work, but it's the difference between a dashboard the board trusts and a dashboard that gets you replaced.
Example governance failure: A Series B SaaS company reported $4.2M in marketing-sourced revenue in Q2 board deck. In Q3, the CFO questioned why Q2's number now showed as $3.8M in the updated dashboard. Turned out marketing ops had changed the attribution window from 90 days to 60 days in July, retroactively affecting Q2 data, and never documented it. The CEO lost confidence in all marketing metrics, froze the budget pending audit, and the CMO was replaced within 4 months. A change log and finance reconciliation process would have prevented this.
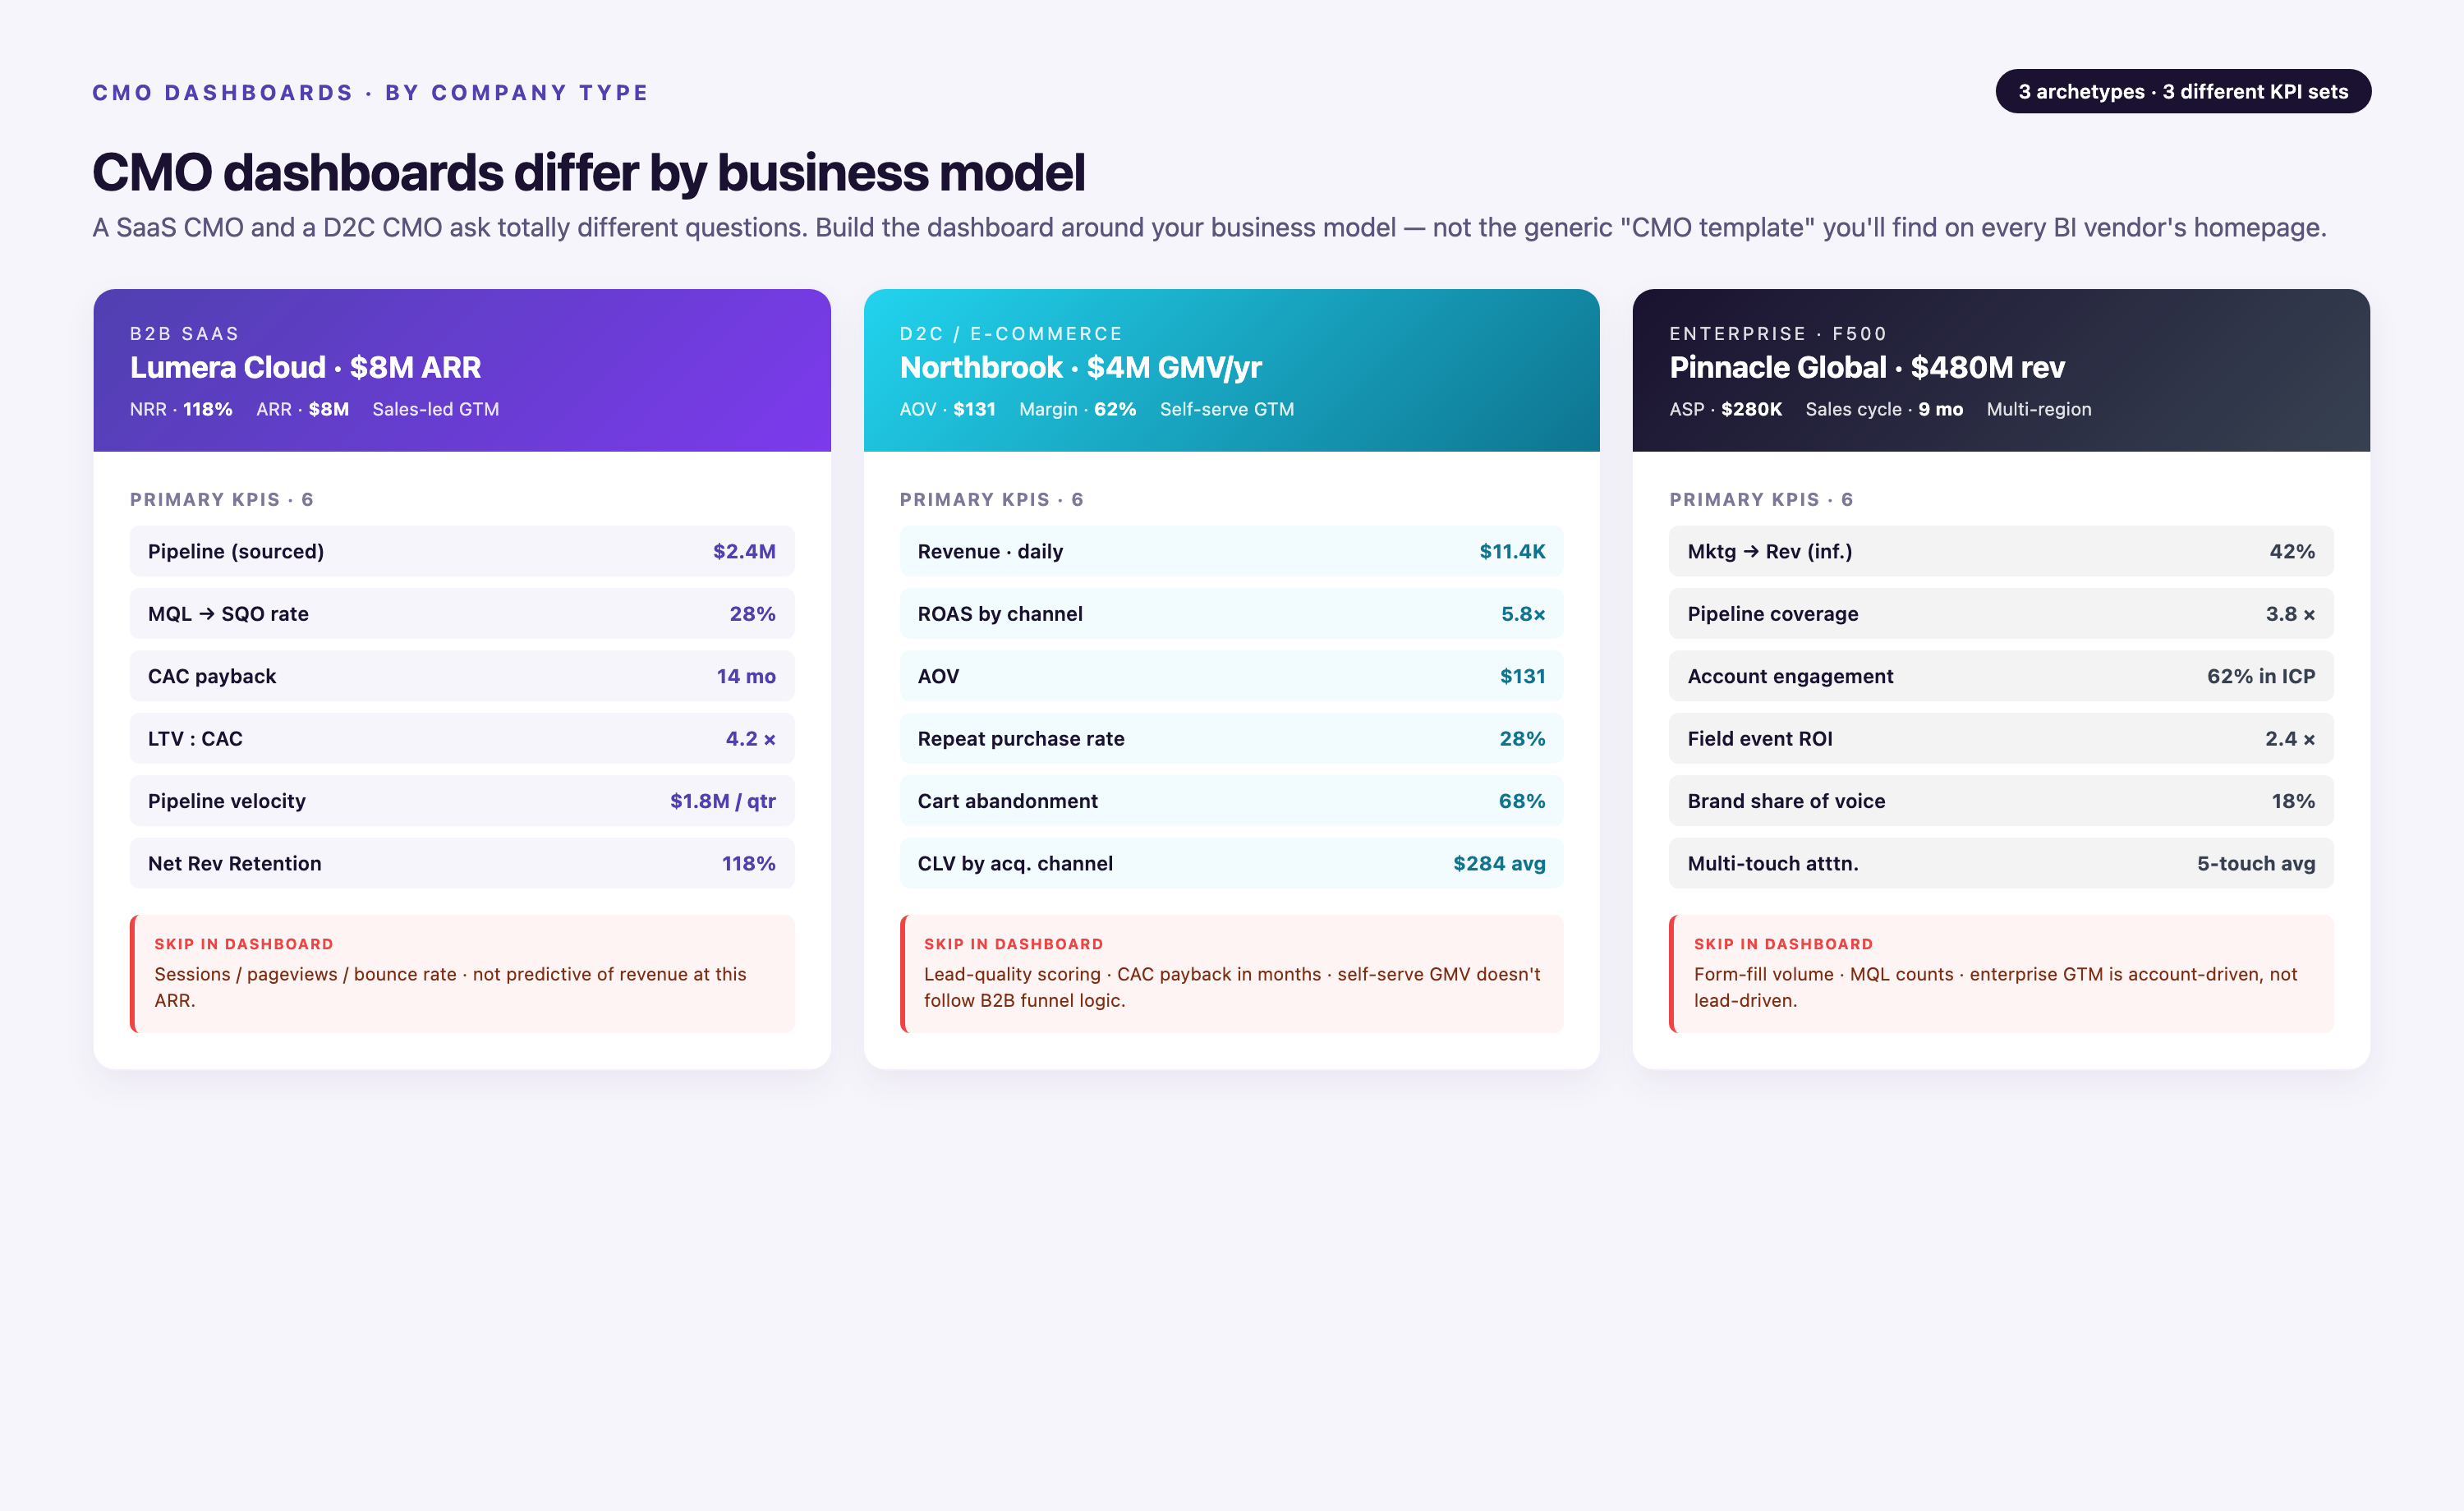
CMO Metrics Dashboard Examples by Company Type
The right CMO metrics dashboard is shaped by business model, not by marketing philosophy. Five archetypes cover most enterprise scenarios, with specific metrics, cadence, and data sources for each.
| Archetype | Headline Metrics | Supporting Tiles | Reporting Cadence | Primary Audience | Regulatory Constraints | Typical Data Sources |
|---|---|---|---|---|---|---|
| B2B SaaS CMO | Pipeline influenced, marketing-sourced ARR, CAC payback, LTV:CAC ratio | MQL-to-SQL conversion, sales accepted lead velocity, account coverage within ABM tier-1, branded search trend | Weekly for exec team, monthly for board | CEO, CFO, VP Sales | None (unless financial services or healthcare vertical) | Salesforce, HubSpot, Google Ads, LinkedIn Ads, GA4, SEMrush |
| Enterprise Retail CMO | MER, same-store marketing lift, incrementality lift from brand campaigns, promo margin impact | Channel mix by spend and revenue, new-to-file customer count, repeat purchase rate, return rate by acquisition channel | Weekly for merchandising and ops, monthly for board | CEO, COO, CFO | PCI-DSS for payment data (aggregated only in dashboard) | Shopify, Google Ads, Meta Ads, retail media networks (Amazon DSP, Criteo), in-store POS data |
| Healthcare (Health System) CMO | New patient acquisition cost, service line revenue attribution, payor mix of marketing-sourced patients, appointment fill rate by channel | Call center volume by source, branded search by service line, online reputation score (Google reviews, Healthgrades), community awareness index | Monthly for board, weekly for service line leaders | CEO, CFO, COO, service line VPs | HIPAA—requires BAA with data vendors, aggregated campaign/spend data only (no PHI or individual patient tracking) | Epic or Cerner EMR (aggregated), Google Ads, call tracking (CallRail), Healthgrades API, local search data |
| Pharma CMO (Brand Lead) | Share of voice vs competitor brand, HCP reach within target NPI list, Rx lift from DTC campaigns, field-digital coverage overlap | HCP publisher delivery (Doximity, Medscape, Epocrates), programmatic HCP DSP (PulsePoint, DeepIntent), endemic vs programmatic split, patient journey milestone conversions, spend by brand and by indication | Monthly for brand team, quarterly for board | Brand VP, CMO, CFO, regulatory/compliance | FDA promotional guidelines (all creative and claims must be compliant), HIPAA for patient data | IQVIA Xponent (Rx data), Doximity API, Medscape, PulsePoint, DeepIntent, DTC platforms (Google, Meta), Veeva CRM for field data |
| PE-Backed Portfolio CMO | Consolidated marketing-sourced revenue across portfolio, blended CAC and LTV:CAC, portfolio MER, cross-brand synergy opportunities | Per-brand performance scorecards, shared infrastructure cost allocation, channel efficiency by brand, M&A integration progress (for new acquisitions) | Monthly consolidated view for PE operating partners, on-demand per-brand drill-down for individual CEOs | PE operating partners, portfolio company CEOs, CFOs | Varies by portfolio company industry; often multi-jurisdiction data privacy (GDPR, CCPA) if global portfolio | Consolidated CRM (often Salesforce multi-org or HubSpot multi-portal), aggregated ad platform data across brands, shared analytics warehouse |
HIPAA compliance note for healthcare: Healthcare dashboards must operate above the tracking layer—aggregated campaign and spend data only, no individual patient identifiers or session-level tracking. All data vendors (ad platforms, analytics, data warehouse, BI tool) must sign Business Associate Agreements (BAA). Architecture typically routes de-identified spend and outcome data through a HIPAA-compliant warehouse (Snowflake with PHI controls, or AWS with HIPAA-eligible services) before visualization. The CMO dashboard shows "cardiology service line generated 340 new patient appointments from paid search in Q1" but never "patient Jane Doe clicked ad X and booked appointment Y."
Marketing Dashboard KPI Rollup Logic
CMO dashboards show revenue rollups, not campaign detail—but understanding how team funnel metrics aggregate into executive metrics prevents disconnect between what marketing reports and what the CEO sees. This is the rollup logic:
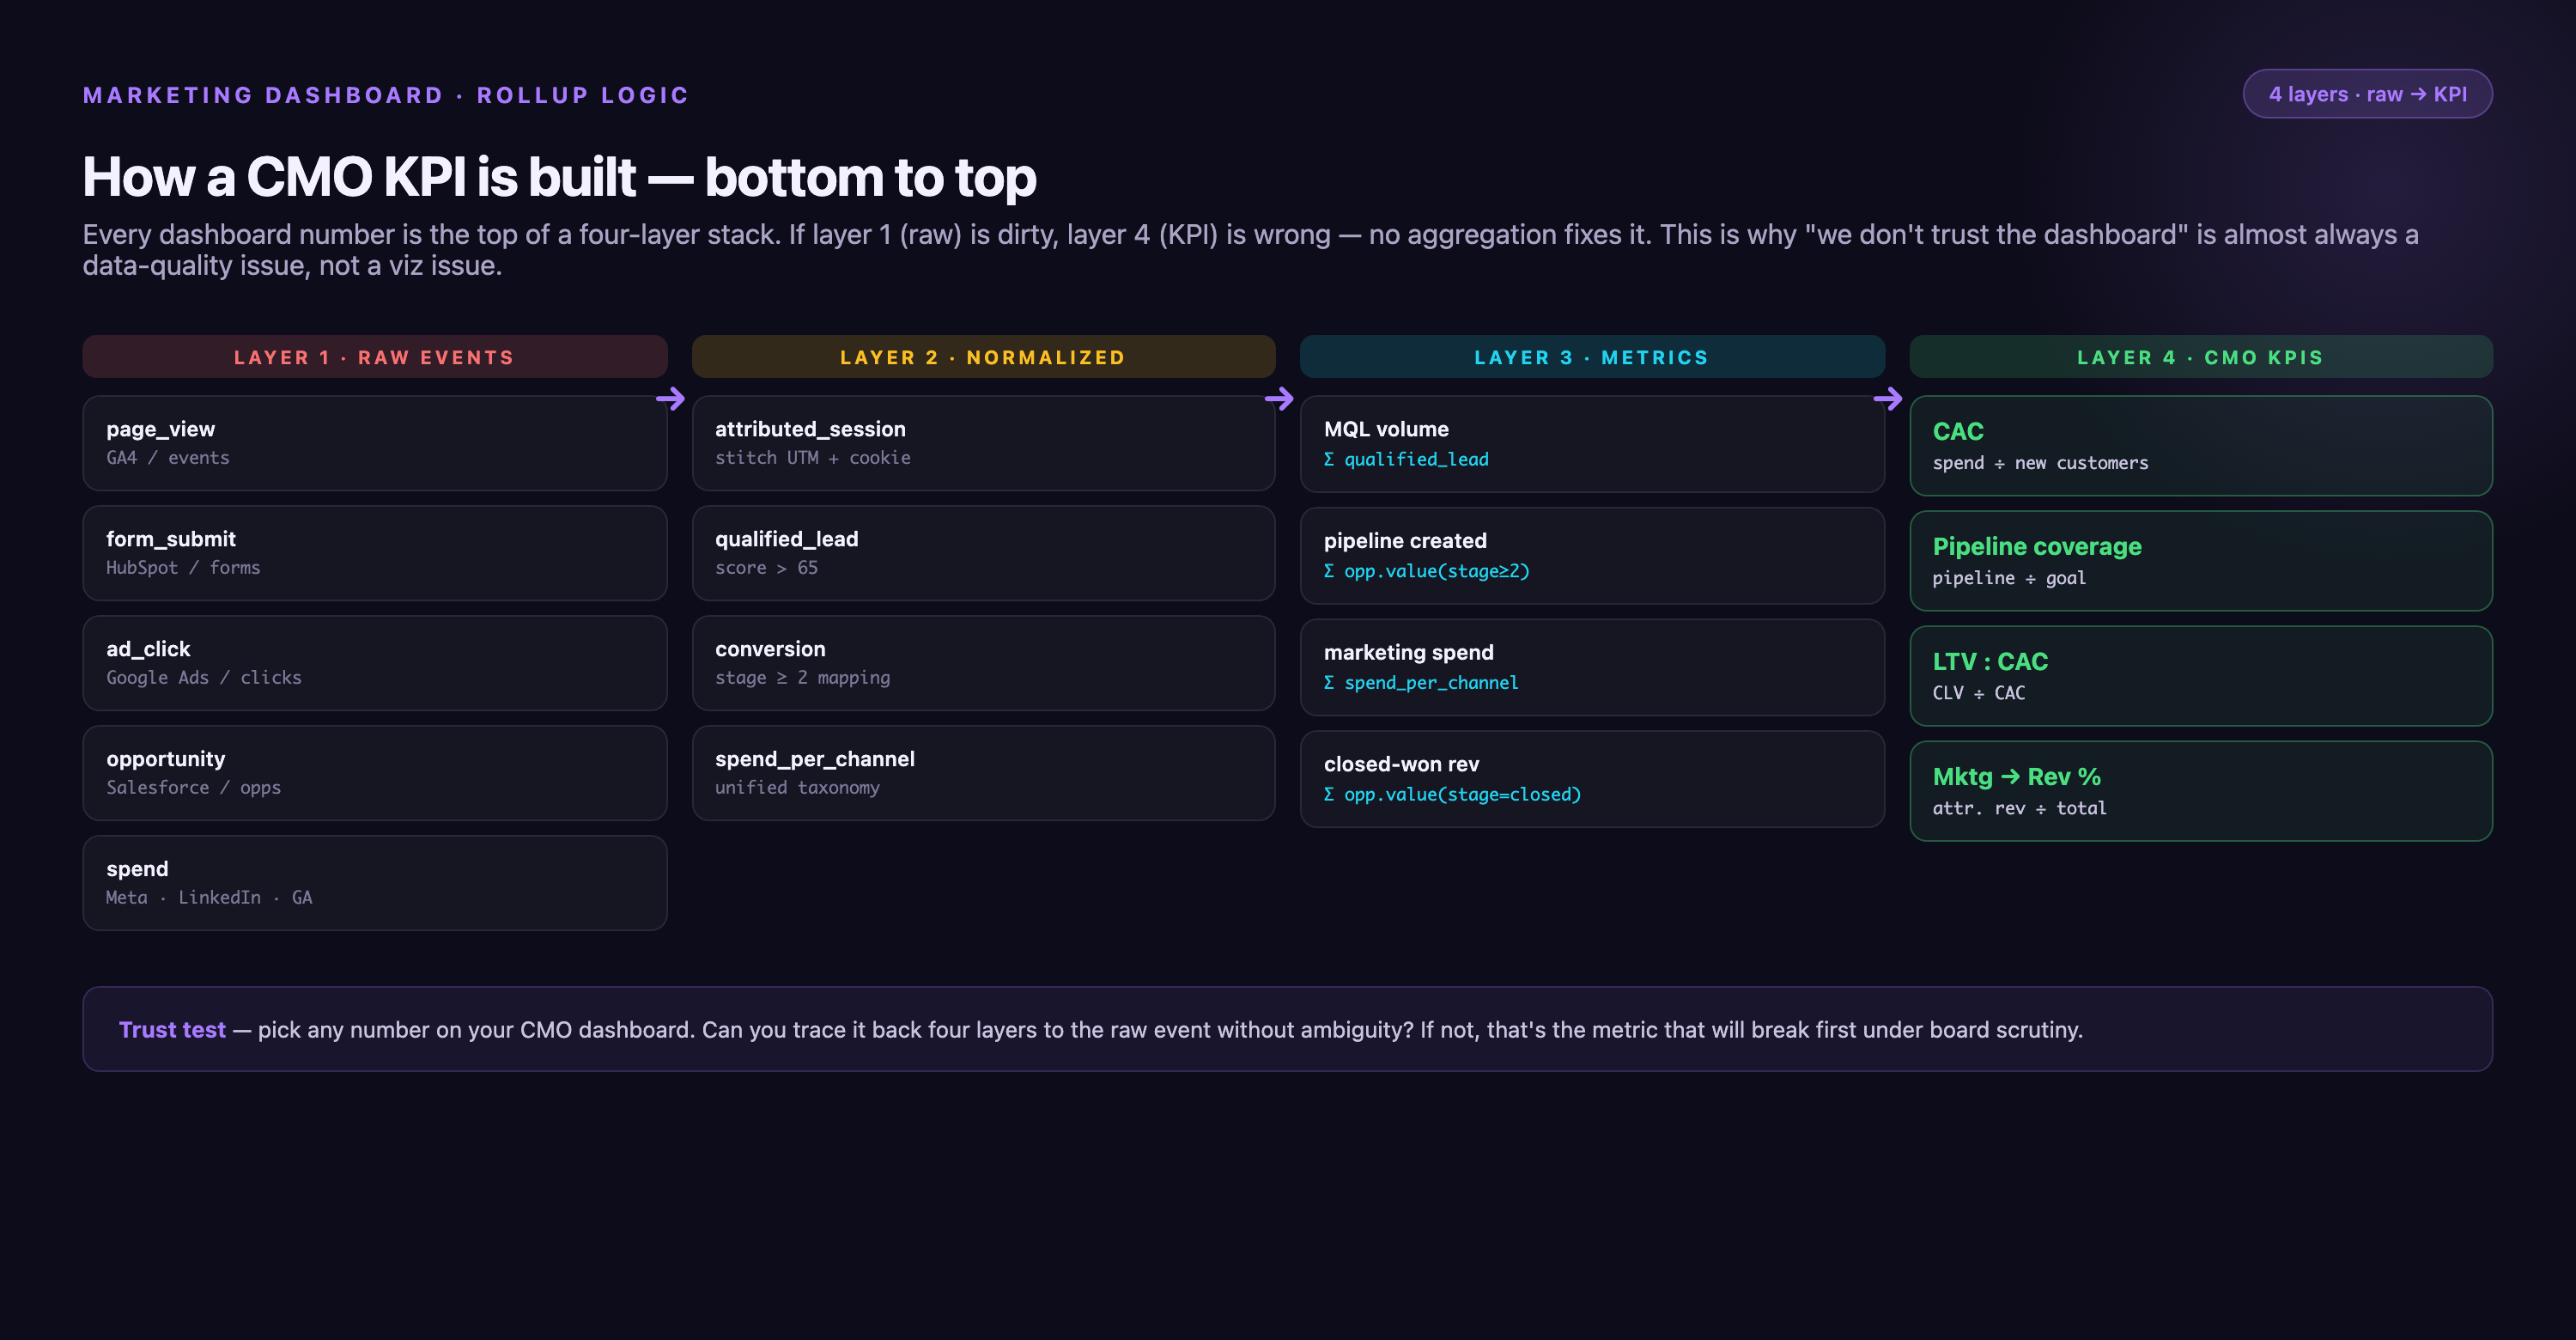
Team dashboards track awareness (impressions, reach, brand search volume), acquisition (MQLs, SQLs, cost per lead by source), activation (trial signups, product qualified leads, time-to-first-value), and retention (email engagement, feature adoption, NPS by cohort). CMO dashboards collapse these into three outcome layers: (1) Pipeline—how many dollars in open pipeline came from marketing touches (rolls up MQLs and SQLs into pipeline influenced); (2) Revenue—how many dollars closed where marketing was first touch (rolls up activated and retained customers into marketing-sourced revenue); (3) Efficiency—total revenue divided by total spend (MER), or revenue divided by ad spend (ROAS), which incorporates all upstream funnel costs. The team optimizes funnel conversion at each stage; the CMO defends whether the entire funnel is capital-efficient. If you need to explain funnel context in a board meeting, show one rollup slide: "We generated 4,200 MQLs this quarter, 1,680 converted to SQL (40%), 420 closed (25% SQL-to-close), producing $8.4M in marketing-sourced revenue at $1.2M spend, for 7:1 MER." That's the bridge between team execution and executive outcome.
How to Create a Marketing Dashboard for CMO in HubSpot
To create a marketing dashboard for CMO in HubSpot, start from the Reporting > Dashboards module. HubSpot ships with a "Marketing Dashboard" template, but the CMO version needs custom reports pulled from attribution, campaigns, and contacts objects.
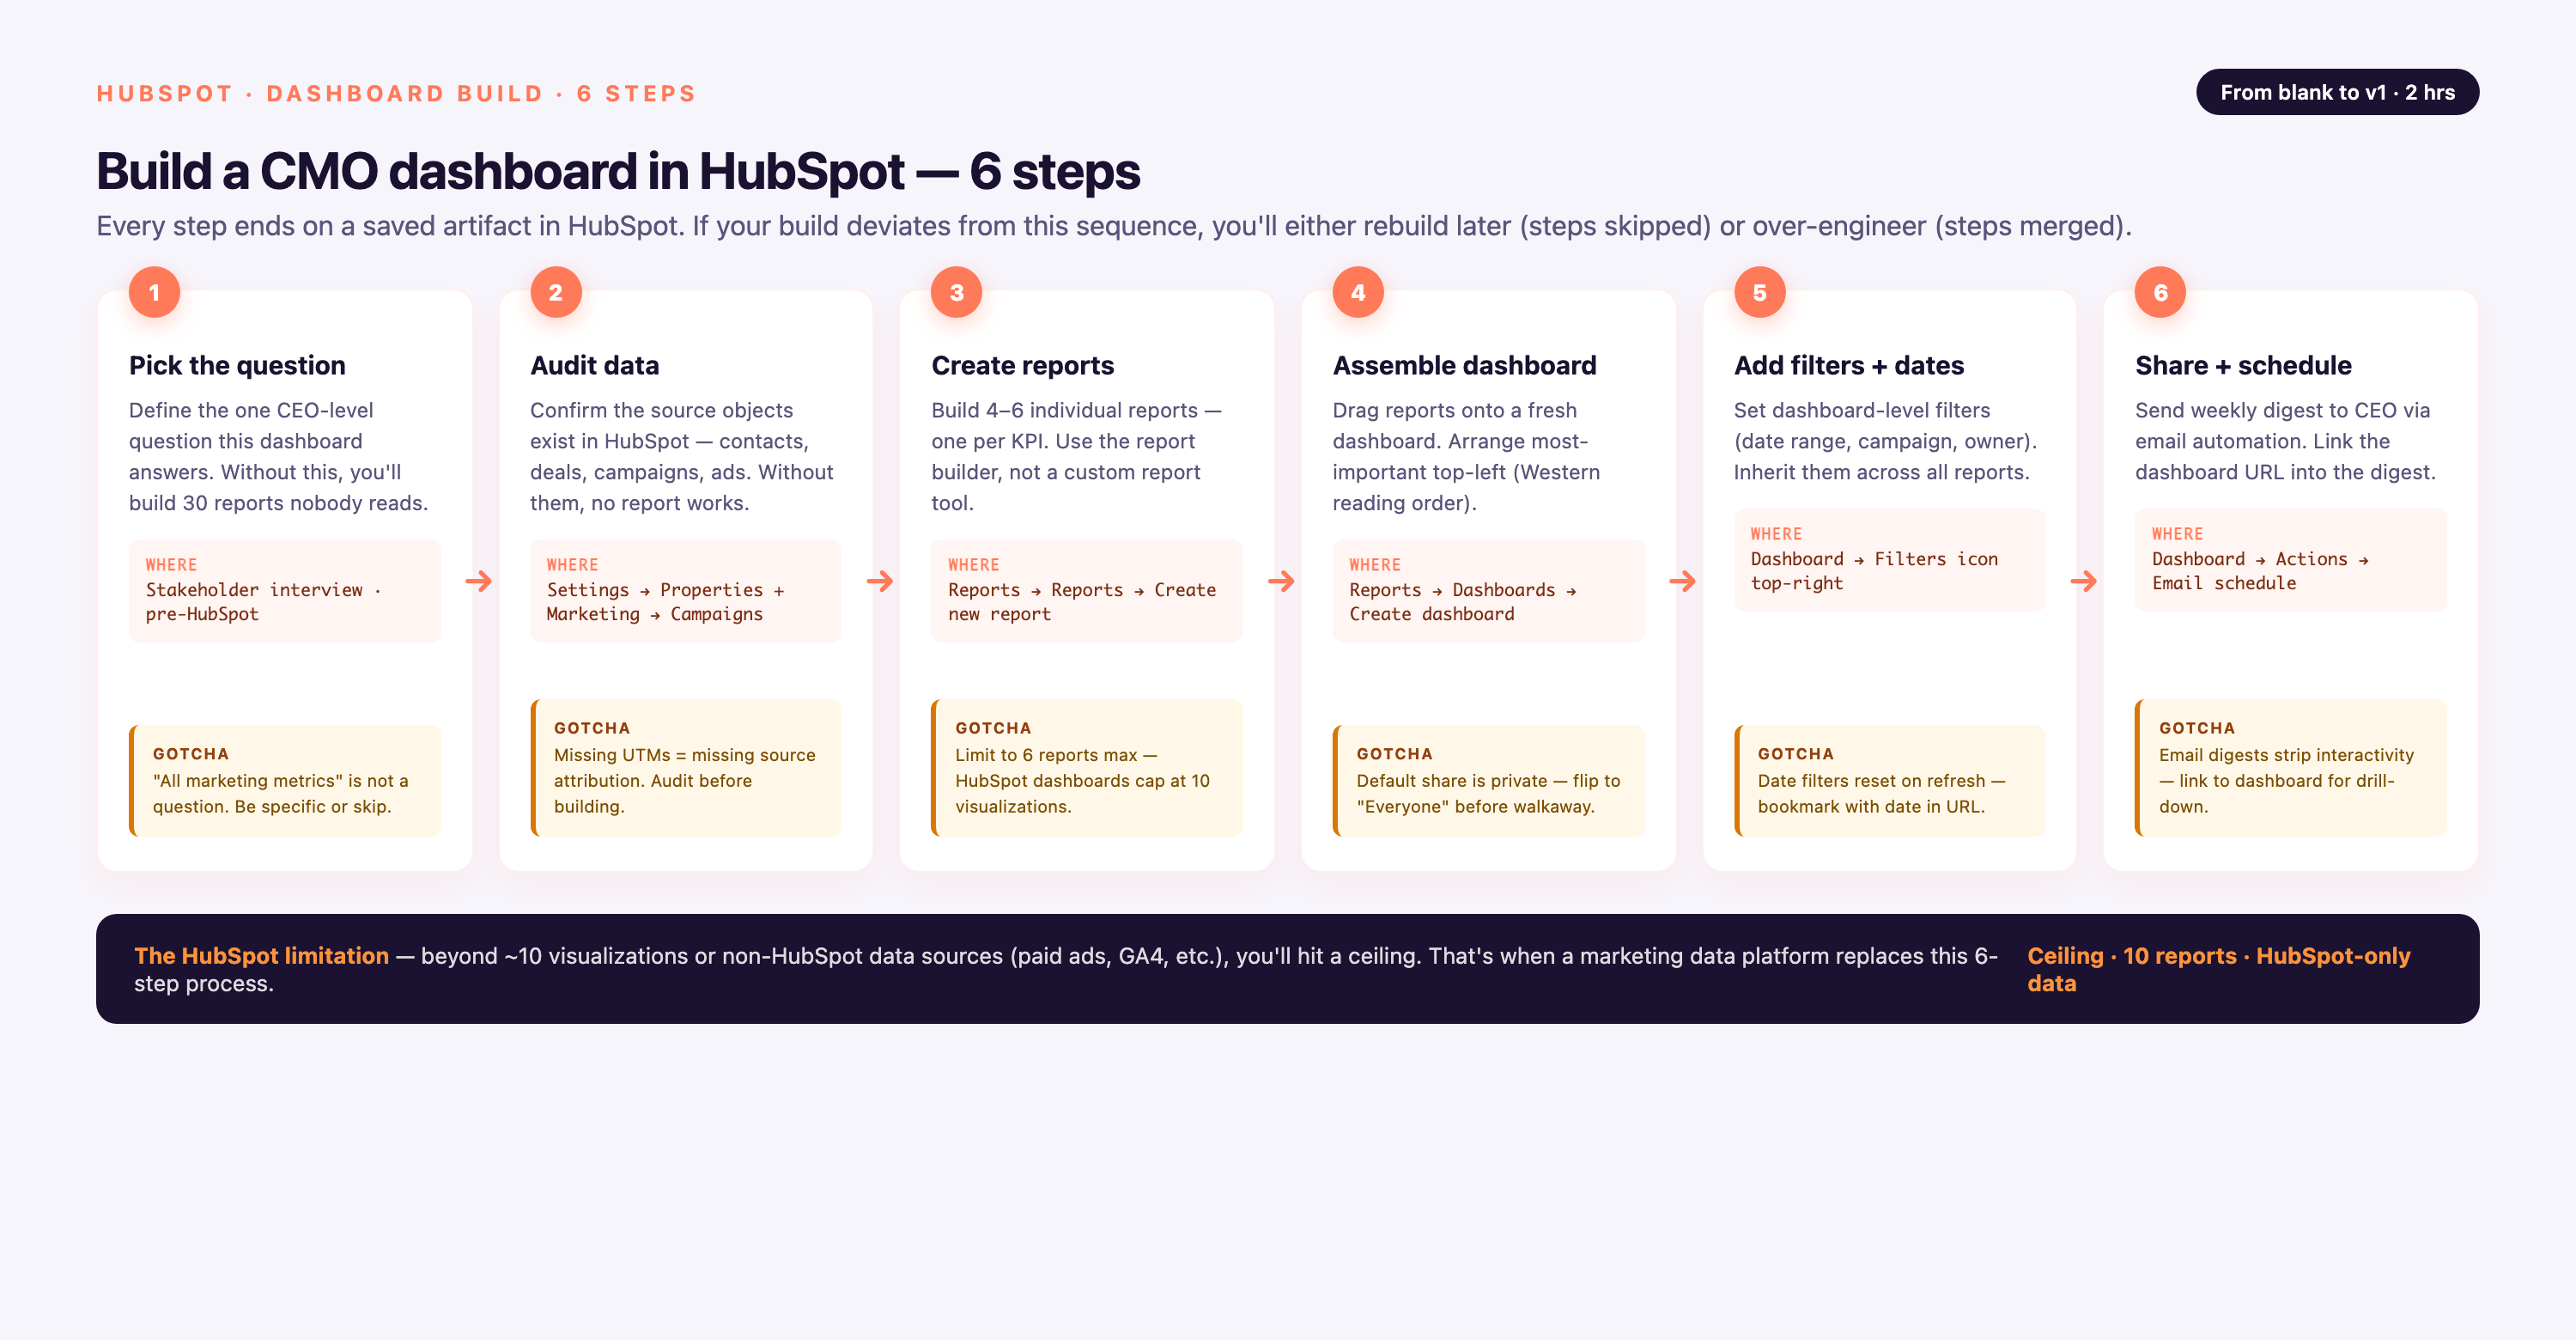
Six-Step Build Process
• Create a new dashboard. Reporting > Dashboards > Create dashboard. Choose "New Dashboard (blank dashboard)" rather than the default template. Name it "CMO Executive Dashboard" and set permissions to restrict edit access to marketing ops and CMO only.
• Add the headline row. Three scorecard widgets at the top: (1) Marketing-Sourced Revenue—use Revenue Attribution report set to first-touch model, filter to closed-won deals, current quarter vs prior quarter. (2) Pipeline Influenced—use multi-touch attribution report, filter to open pipeline, show current value and 90-day trend. (3) CAC—create custom calculated property dividing total marketing spend (manual input or synced from finance system) by new customers acquired (from deals closed report). Display as scorecard with prior quarter comparison.
• Add the trend row. Three line charts: (1) MQL-to-SQL conversion rate over trailing 90 days (contacts report, lifecycle stage transitions). (2) Marketing-sourced deal velocity—average days from first touch to closed-won, segmented by source. (3) Channel spend versus revenue—stacked area chart with spend on one axis (requires external data sync) and attributed revenue on the other, both over same 90-day period.
• Add the channel breakdown. Stacked bar chart from Traffic Analytics report, segmented by original source (organic search, paid search, social, direct, referral) and filtered by first-touch attribution. Include conversion to customer, not just lead, so each bar shows source → customer journey.
• Set refresh cadence. HubSpot dashboards refresh automatically when you open them; schedule an email digest to the CMO every Monday 7 a.m. with the dashboard snapshot as PDF attachment. Use Workflows > Create workflow > Schedule-based, trigger weekly, action = send dashboard report.
• Connect external spend. HubSpot tracks HubSpot-native campaigns (emails, landing pages, social posts scheduled through HubSpot), but paid media spend lives in Google Ads, Meta, LinkedIn, TikTok. Either sync spend via native ads integrations (HubSpot Ads tool connects Google Ads, Facebook Ads, LinkedIn Ads—setup under Marketing > Ads) or pipe it in via a data platform like Improvado, Supermetrics, or Funnel.io. Without external spend data, your CAC and MER calculations will be incomplete.
The HubSpot Limitation
HubSpot does a strong job with top-of-funnel metrics (web traffic, form submissions, email engagement) and CRM-native pipeline (deals, lifecycle stages, attribution within HubSpot's tracking). But CAC, LTV, true marketing-sourced revenue, and cross-channel MER require spend and revenue data from systems HubSpot doesn't own—finance ERP for total spend, ad platforms for channel costs, data warehouse for multi-touch attribution beyond HubSpot's 90-day cookie window. For teams with fewer than 5 data sources and simple attribution (first-touch only), HubSpot native dashboards are sufficient. For teams with 10+ sources, multi-touch attribution, or finance-grade reconciliation requirements, HubSpot becomes the CRM layer in a larger stack: data platform extracts from HubSpot + ads + finance, loads into warehouse, BI tool (Tableau, Looker, Power BI) reads from warehouse. That's the architecture for a board-ready CMO dashboard.
CMO Dashboard Data Architecture Decision Tree
Choosing the right architecture depends on number of data sources, existing infrastructure, attribution complexity, and regulatory requirements. This decision tree walks through the four most common paths.
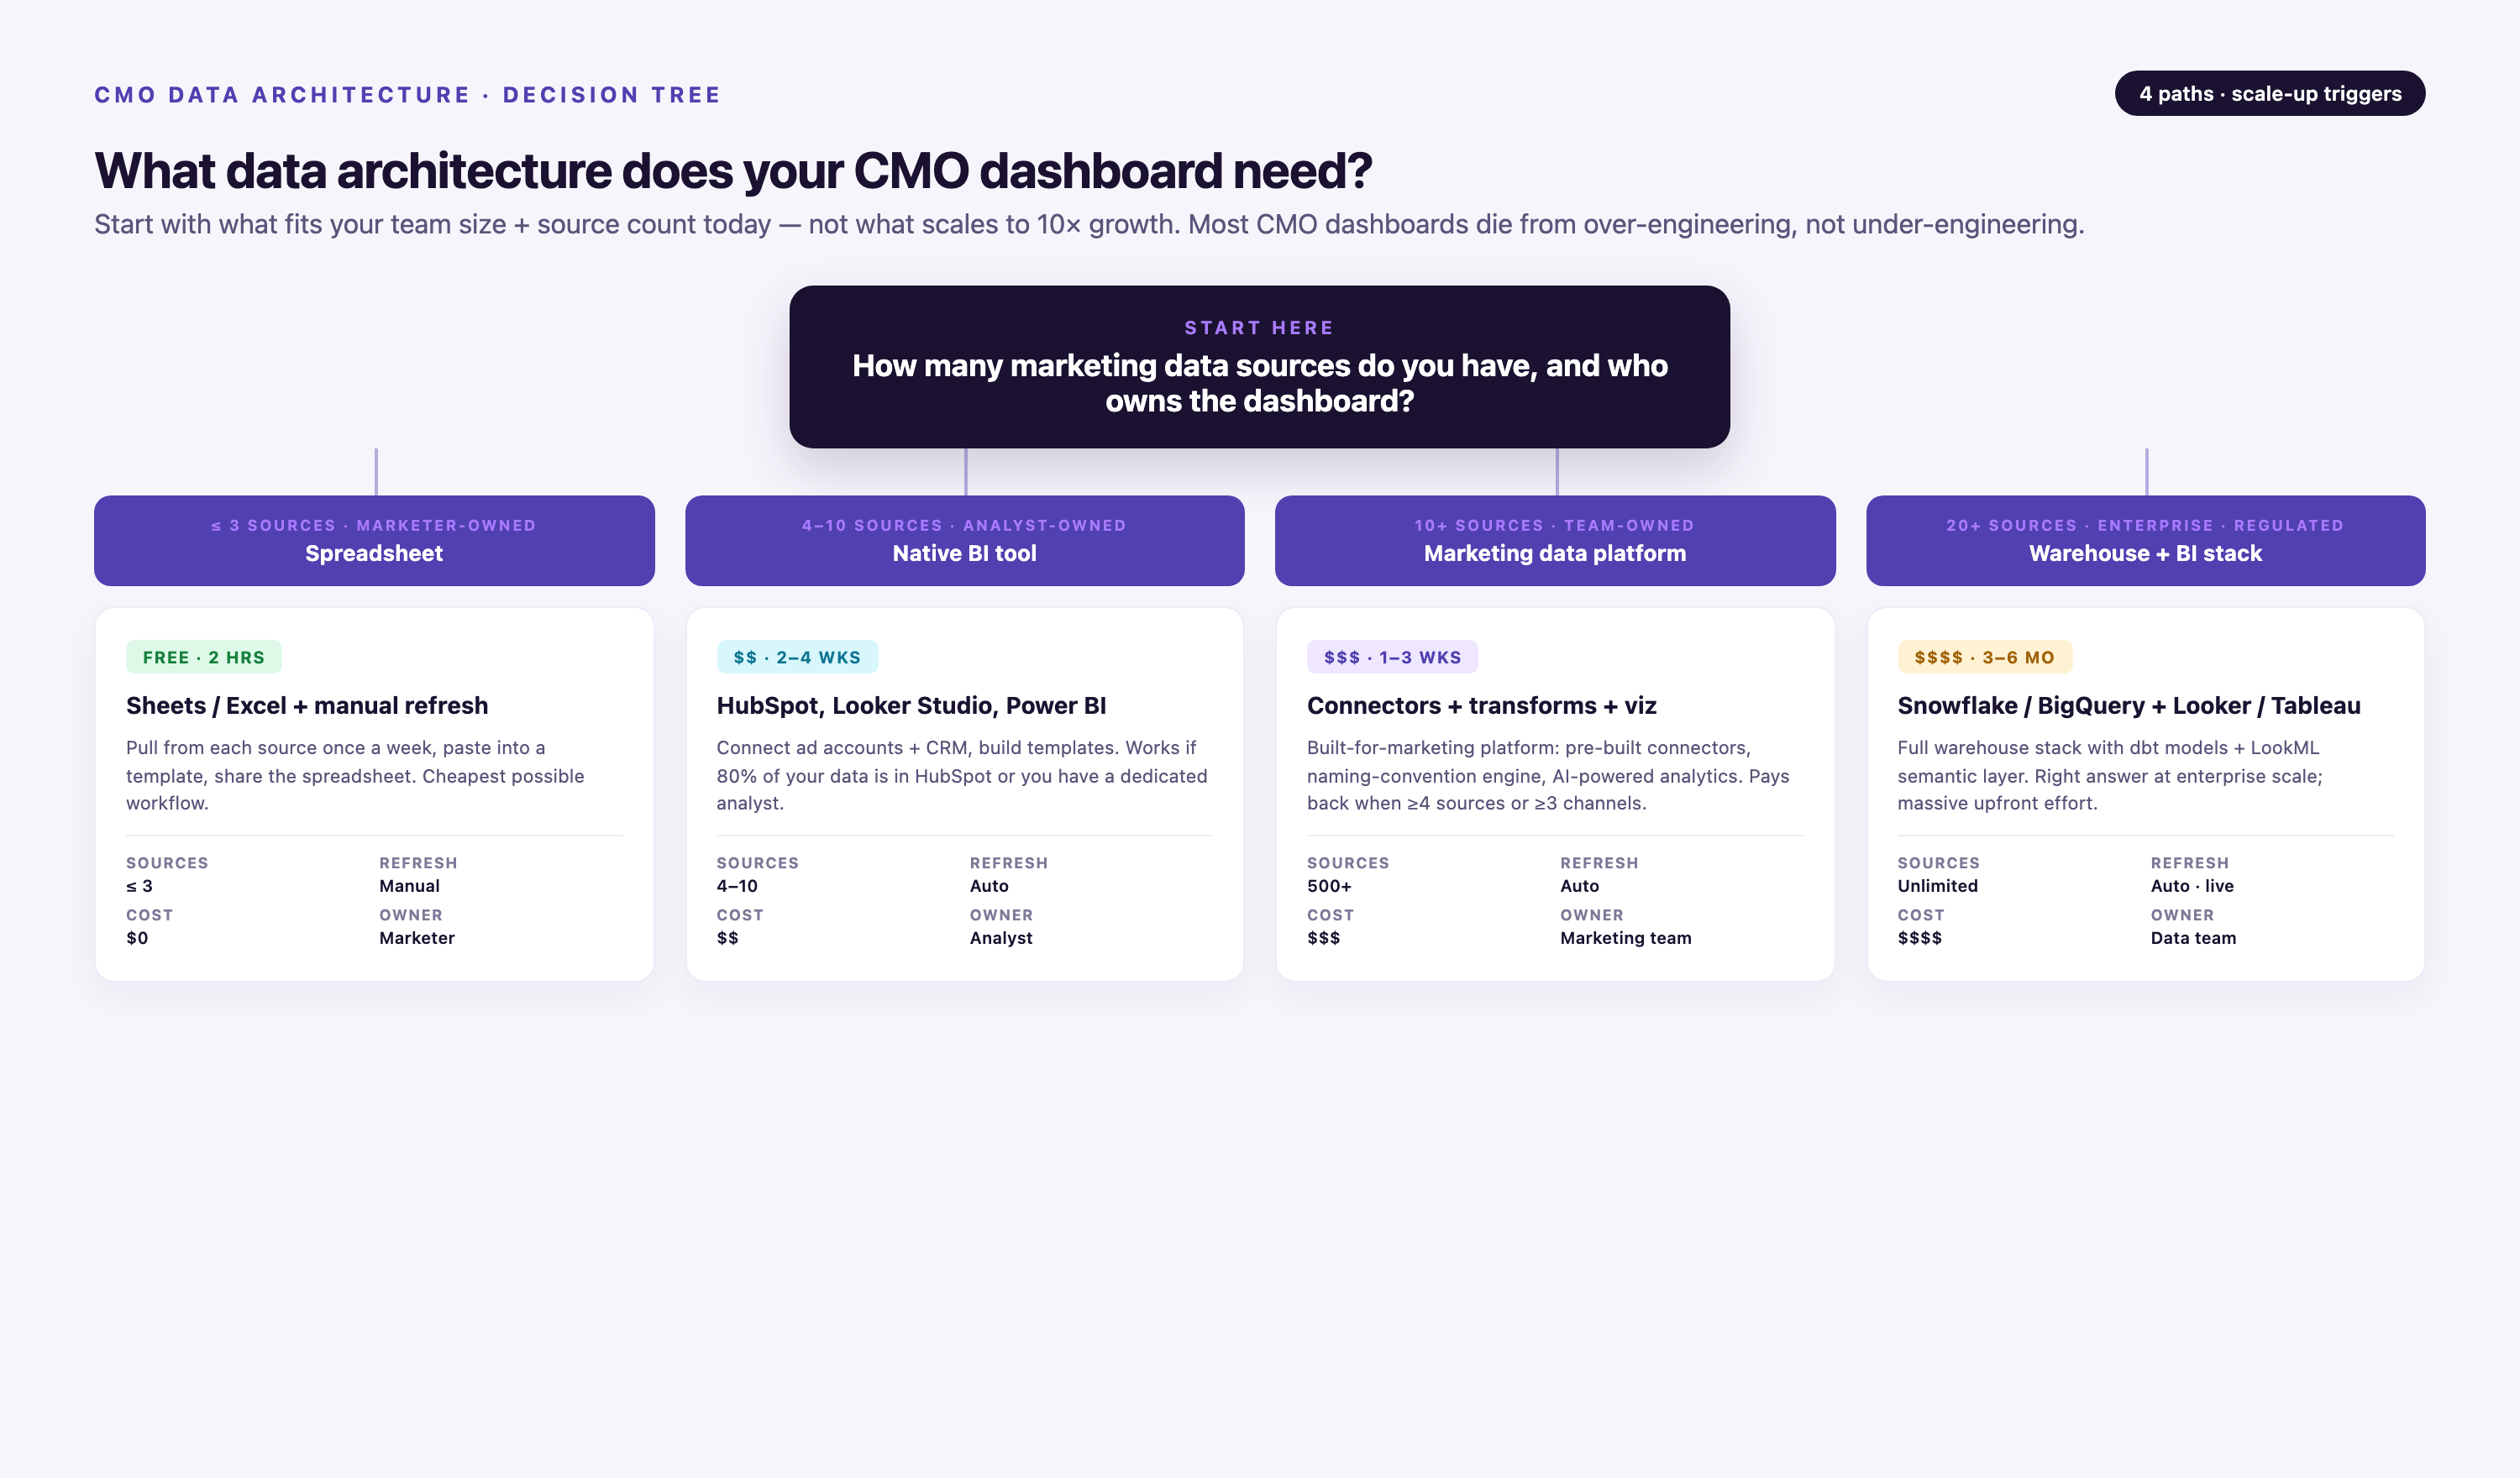
| Scenario | Recommended Stack | Cost Band | IT Lift | When to Choose |
|---|---|---|---|---|
| <5 data sources, simple attribution | HubSpot or Marketo native dashboards | $ (included in platform cost) | Low (marketing ops can build) | Early-stage company (<$10M revenue), all demand gen runs through one platform, first-touch attribution acceptable, CEO doesn't require finance-reconciled numbers |
| 5-20 sources, existing data warehouse | Fivetran or Stitch + your warehouse + Tableau/Looker/Power BI | $$ ($2K-$8K/mo total) | Medium (requires data engineer to build semantic layer) | You already have Snowflake or BigQuery, engineering team can own data models, attribution logic is custom, BI tool expertise in-house |
| 20+ sources, no warehouse, non-regulated | Improvado or Funnel.io (includes warehouse) + BI tool | $$$ ($4K-$15K/mo depending on connectors and data volume) | Low (platform handles extraction, transformation, and semantic layer; marketing ops configures) | Complex multi-channel stack (10+ ad platforms, CRM, analytics, offline sources), no data engineering team, need new connectors added quickly, board presentation frequency demands reliability |
| Regulated industry (healthcare, finance) or 50+ sources | Improvado + Snowflake (with HIPAA/SOC2 config) + Tableau or Looker | $$$$ ($8K-$25K+/mo total) | Medium-High (requires BAA execution, compliance review, IT involvement for access controls) | Healthcare (HIPAA), financial services (SOC2/PCI-DSS), or pharmaceutical (FDA compliance + large source count); enterprise scale (>$100M revenue); board and audit trail requirements; need for role-based access control and data lineage |
When point-to-point architecture breaks: If you're connecting each data source (Google Ads, Meta, LinkedIn, Salesforce, GA4, etc.) directly to your BI tool via native connectors, you'll hit three failure modes: (1) Schema drift—when Google Ads renames a field, your dashboard breaks and no one notices until the Monday exec meeting. (2) No governance—each analyst defines CAC differently because there's no shared semantic layer. (3) Technical debt—10 sources = 10 connectors to maintain; 50 sources = 50 points of failure. The cutover point is typically 8-10 sources—beyond that, a unified data platform or warehouse with transformation layer (dbt, Improvado's MCDM, or Looker's LookML) pays for itself in reliability and analyst time saved.
The Three Questions a CEO Asks That Break Most CMO Dashboards
Most CMO dashboards work fine until the CEO asks a follow-up question live in a meeting. Three real failure scenarios from enterprise marketing teams, the dashboard gap that caused each, and the data model fix.
Scenario 1: "Why did pipeline drop 22% but spend only dropped 8%?"
• What happened: A growth-stage B2B SaaS company reported $12M in open pipeline in Q1 and $9.4M in Q2 (22% drop). Marketing spend went from $650K to $598K (8% drop). The CEO asked the obvious question in the board meeting: why did output drop 3× faster than input? The CMO couldn't answer because the dashboard showed current pipeline and current spend, but not lag effects or attribution window.
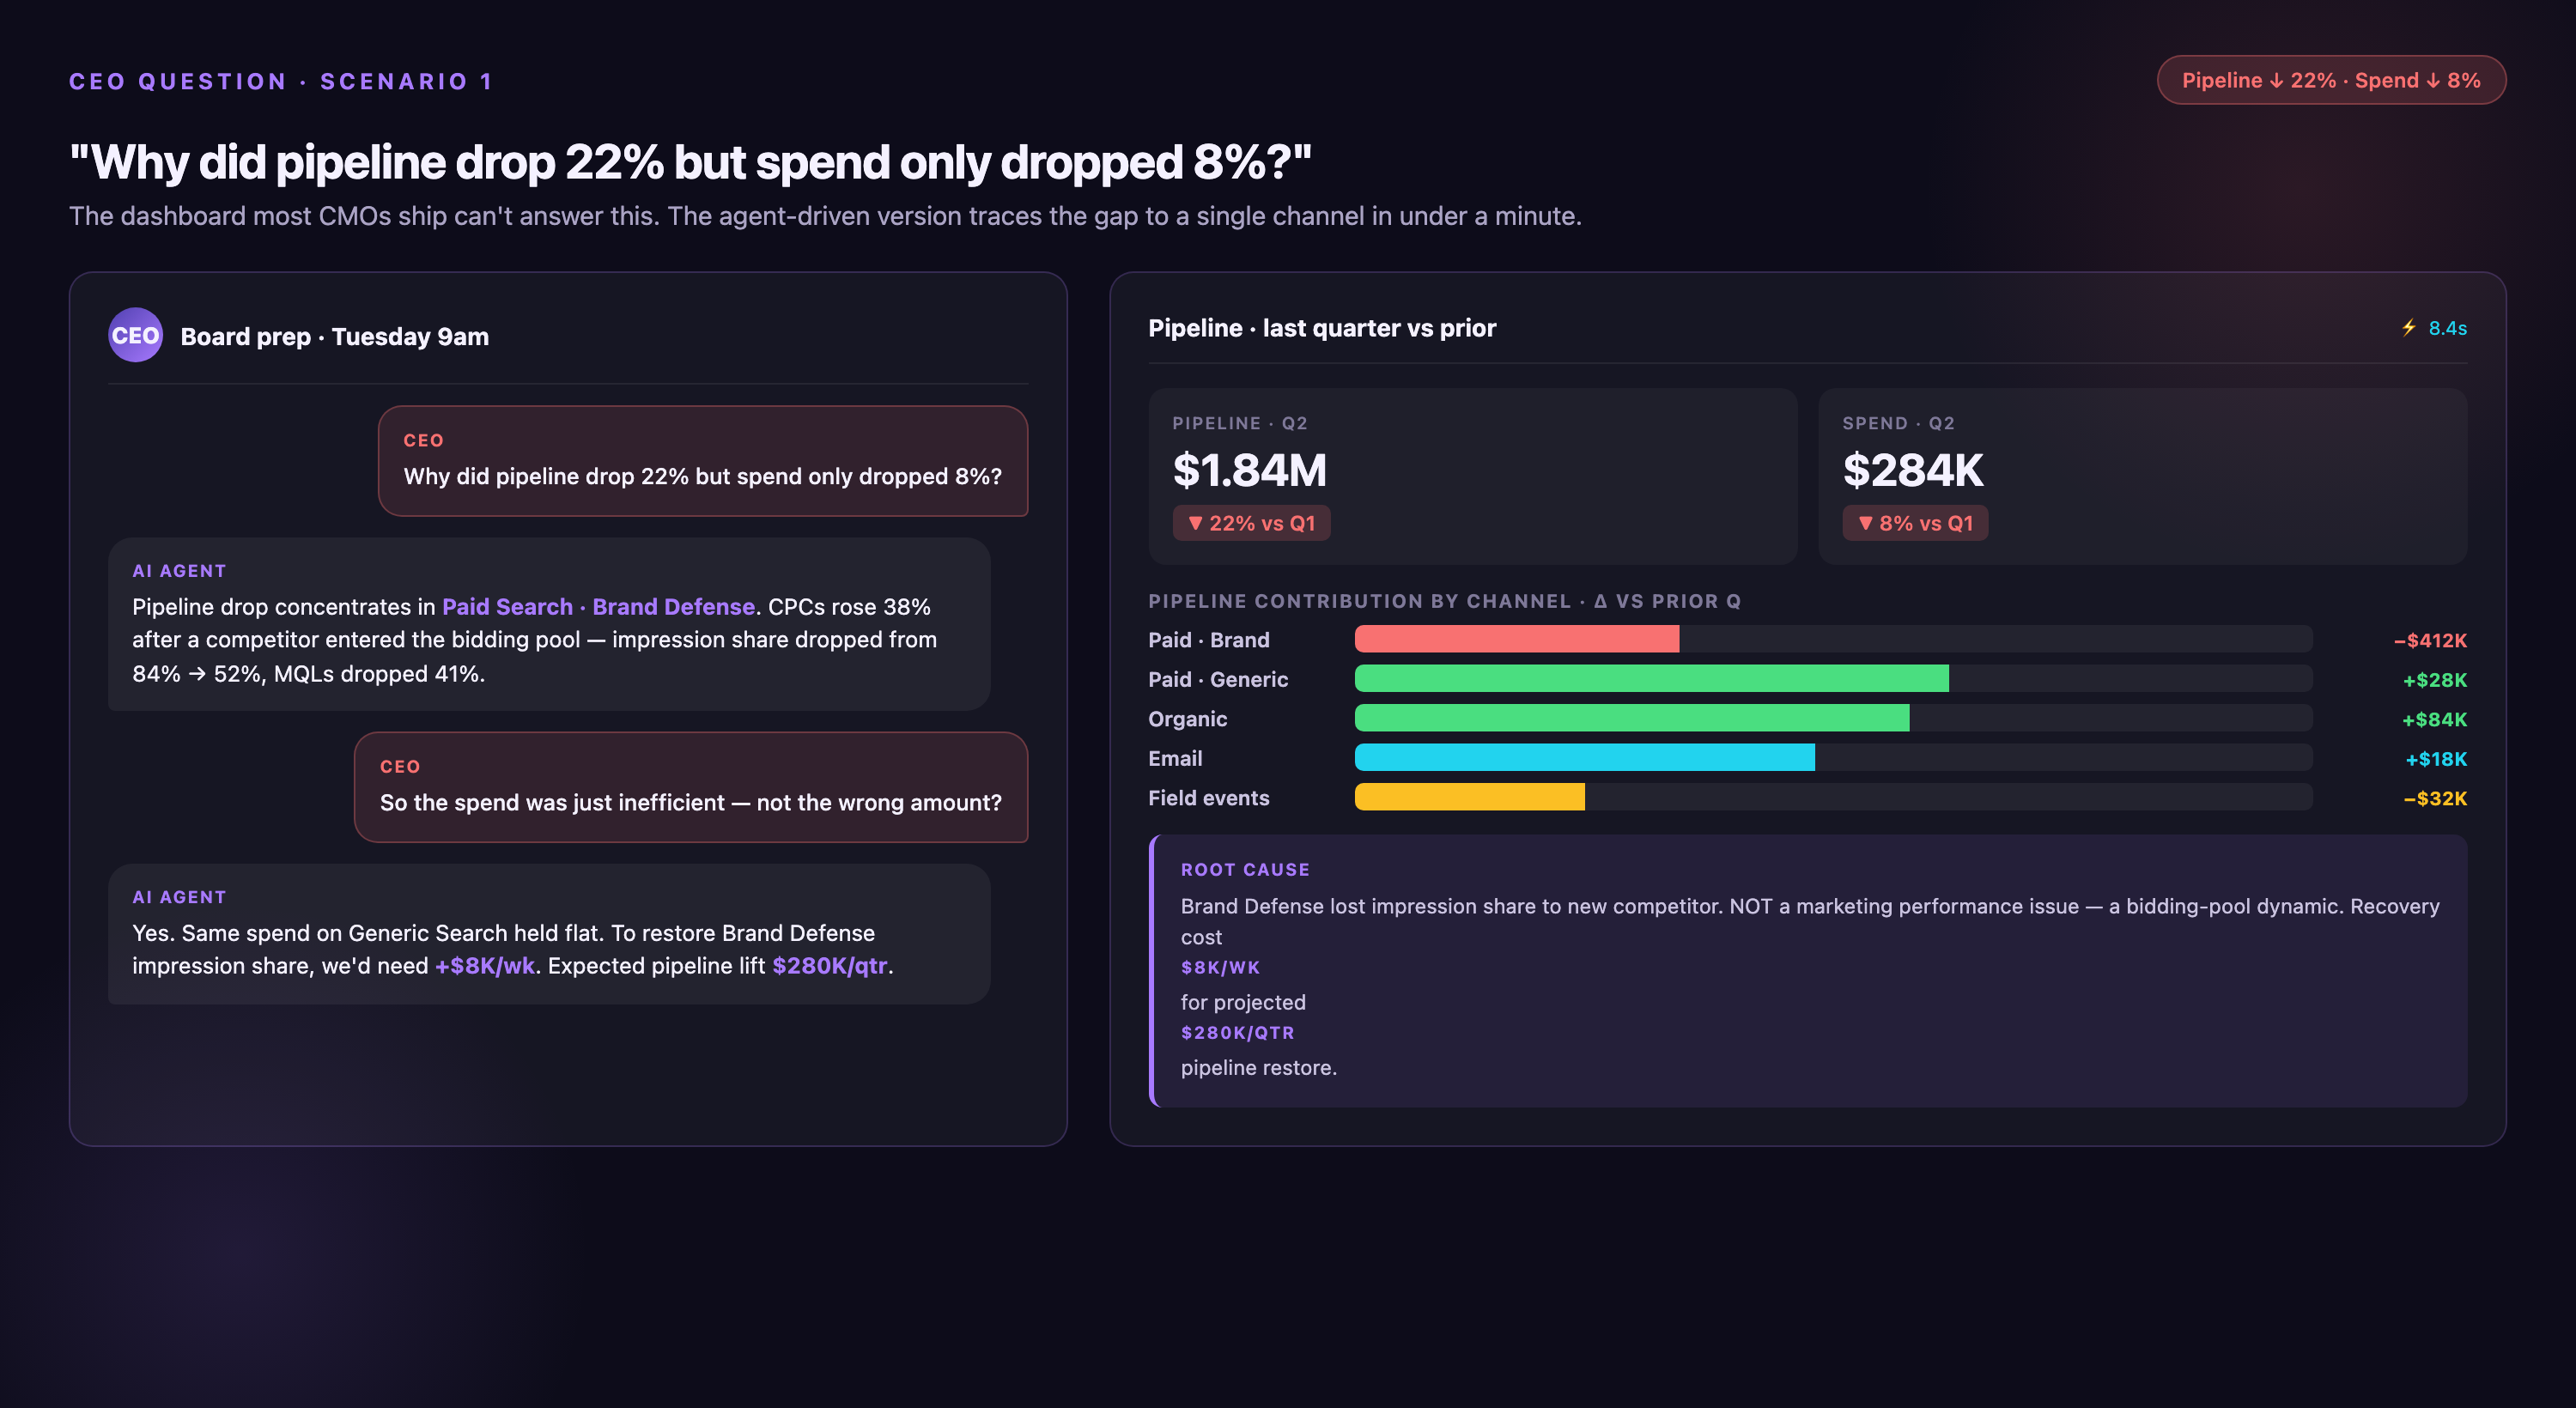
• The dashboard gap: No visibility into time-to-pipeline by channel. Paid search converts to pipeline in 14 days; content and SEO take 90-120 days. In Q1, the team had ramped content spend, which didn't show pipeline contribution until Q2. But in Q2, they'd cut content budget, so the Q1 ramp was rolling off just as Q2 paid search wasn't enough to replace it. The lag mismatch wasn't visible in a snapshot dashboard.
The data model fix: Add two tiles: (1) Pipeline by source and cohort—show which quarter's marketing activity contributed to this quarter's pipeline (cohort analysis, not just current attribution). (2) Average lag from spend to pipeline by channel—calculate median days from ad impression or content publish to opportunity creation, segmented by source. When CEO asks "why the drop?", answer becomes: "We reduced content spend 30% in Q1; that's now flowing through with a 90-day lag, and paid search can't fill the gap because our ICP has a 45-day research cycle." Data model change: join opportunity creation date to first marketing touch date, calculate lag distribution, expose in dashboard with channel filter.
Scenario 2: "Which channel should we cut to fund the field event budget?"
• What happened: An enterprise software company needed to reallocate $200K from digital channels to fund a tier-1 conference sponsorship. The CEO asked the CMO which channel to cut. The dashboard showed spend by channel ($400K paid search, $180K paid social, $120K display) and revenue by channel ($2.4M attributed to paid search, $900K to paid social, $480K to display). Simple math suggested cutting display (lowest revenue per dollar). The CMO cut display. Two quarters later, paid search revenue dropped 15% and paid social dropped 10%, because display had been doing upper-funnel awareness that fed retargeting and branded search—cutting it killed the top of the funnel.
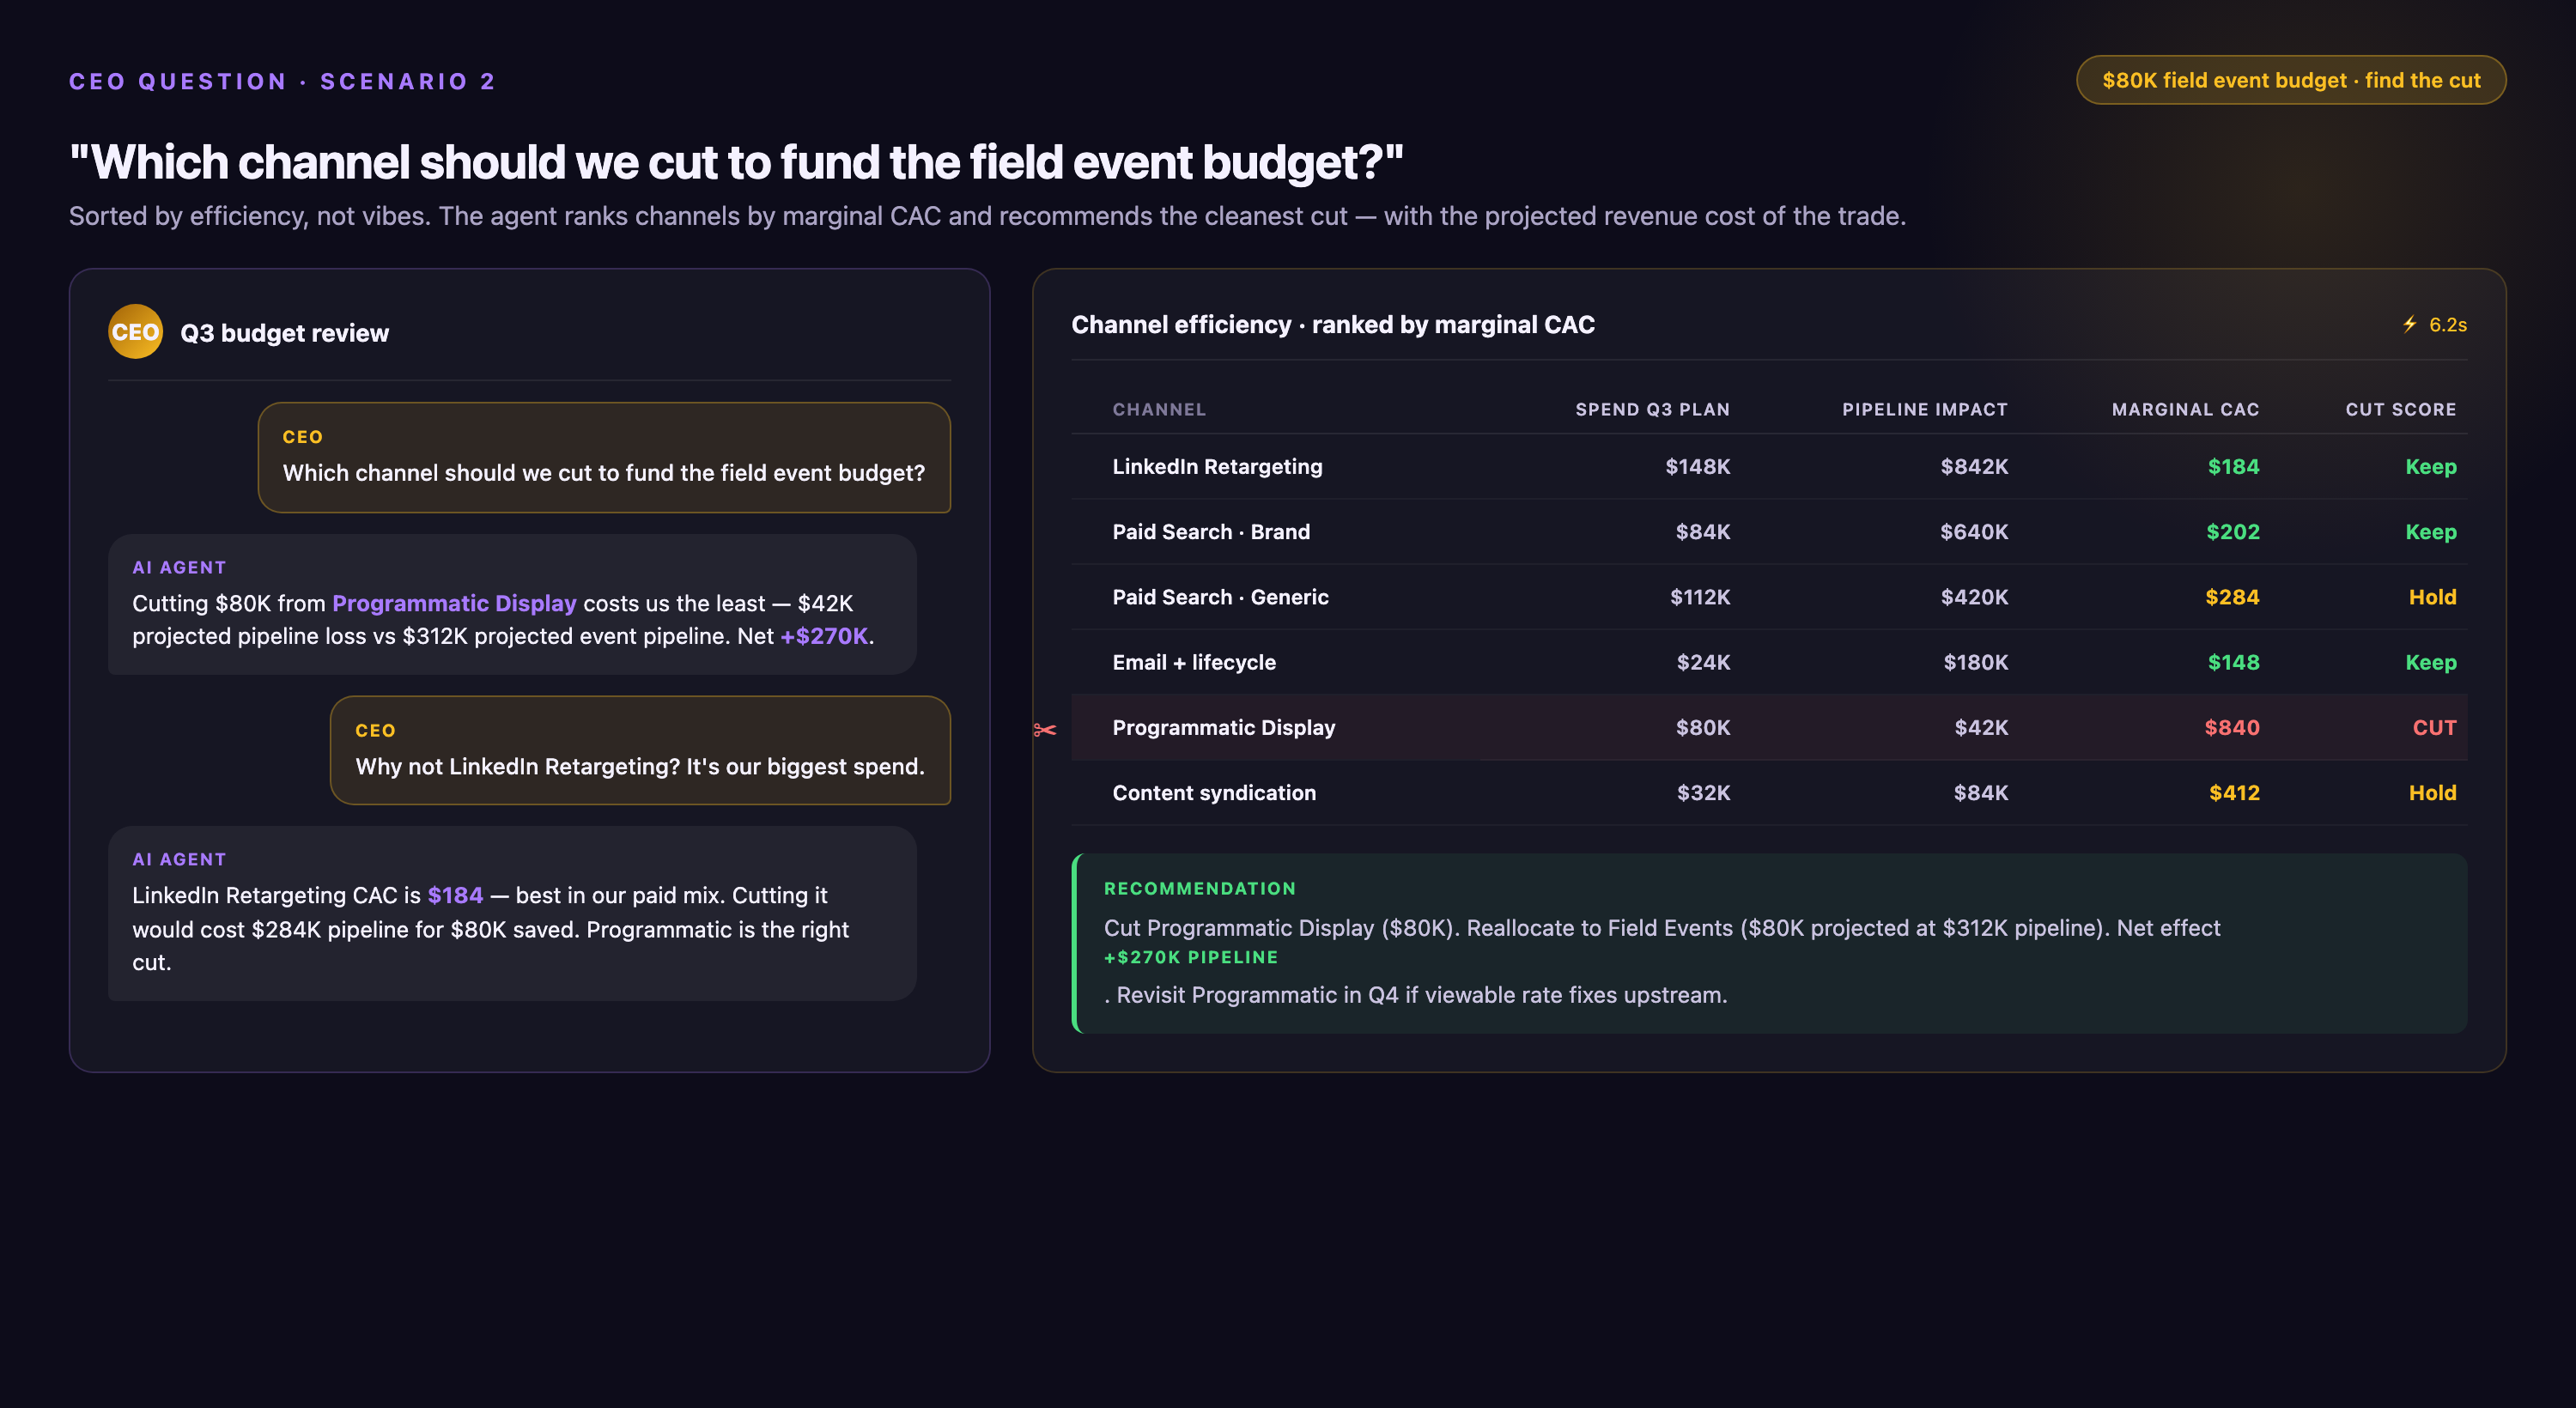
• The dashboard gap: The dashboard showed last-click or first-touch attribution, not incremental contribution or channel interdependencies. Display was supporting paid search and paid social, but that relationship wasn't visible. No incrementality testing, no assisted conversions view, no cohort analysis of "customers who saw display ad then converted via paid search."
The data model fix: Add three tiles: (1) Assisted conversions by channel—show how often each channel appears in the conversion path even when it's not first or last touch (use multi-touch attribution or GA4's path analysis). (2) Channel overlap matrix—heatmap showing what % of paid search converters also saw display, paid social, or organic in prior 30 days. (3) Incrementality score by channel (if test budget available)—run geo-holdout or matched-market test to measure true lift. In this case, display had 60% overlap with paid search converters and 40% assisted conversion rate—cutting it removed the awareness layer that fed intent channels. Better cut: reduce paid social (lowest overlap, mostly standalone conversions).
Scenario 3: "What's our payback on the rebrand?"
• What happened: A Series C company spent $800K on a rebrand (new logo, new messaging, new website, PR campaign). Six months later, the board asked for payback analysis. The CMO dashboard showed brand share of voice up 40% (good) and branded search volume up 25% (good), but couldn't connect those to revenue. The CFO said "we spent $800K and you're showing me search volume—what's the dollar return?" No answer. The rebrand was judged a cost center, not an investment, and the next year's brand budget was cut 60%.
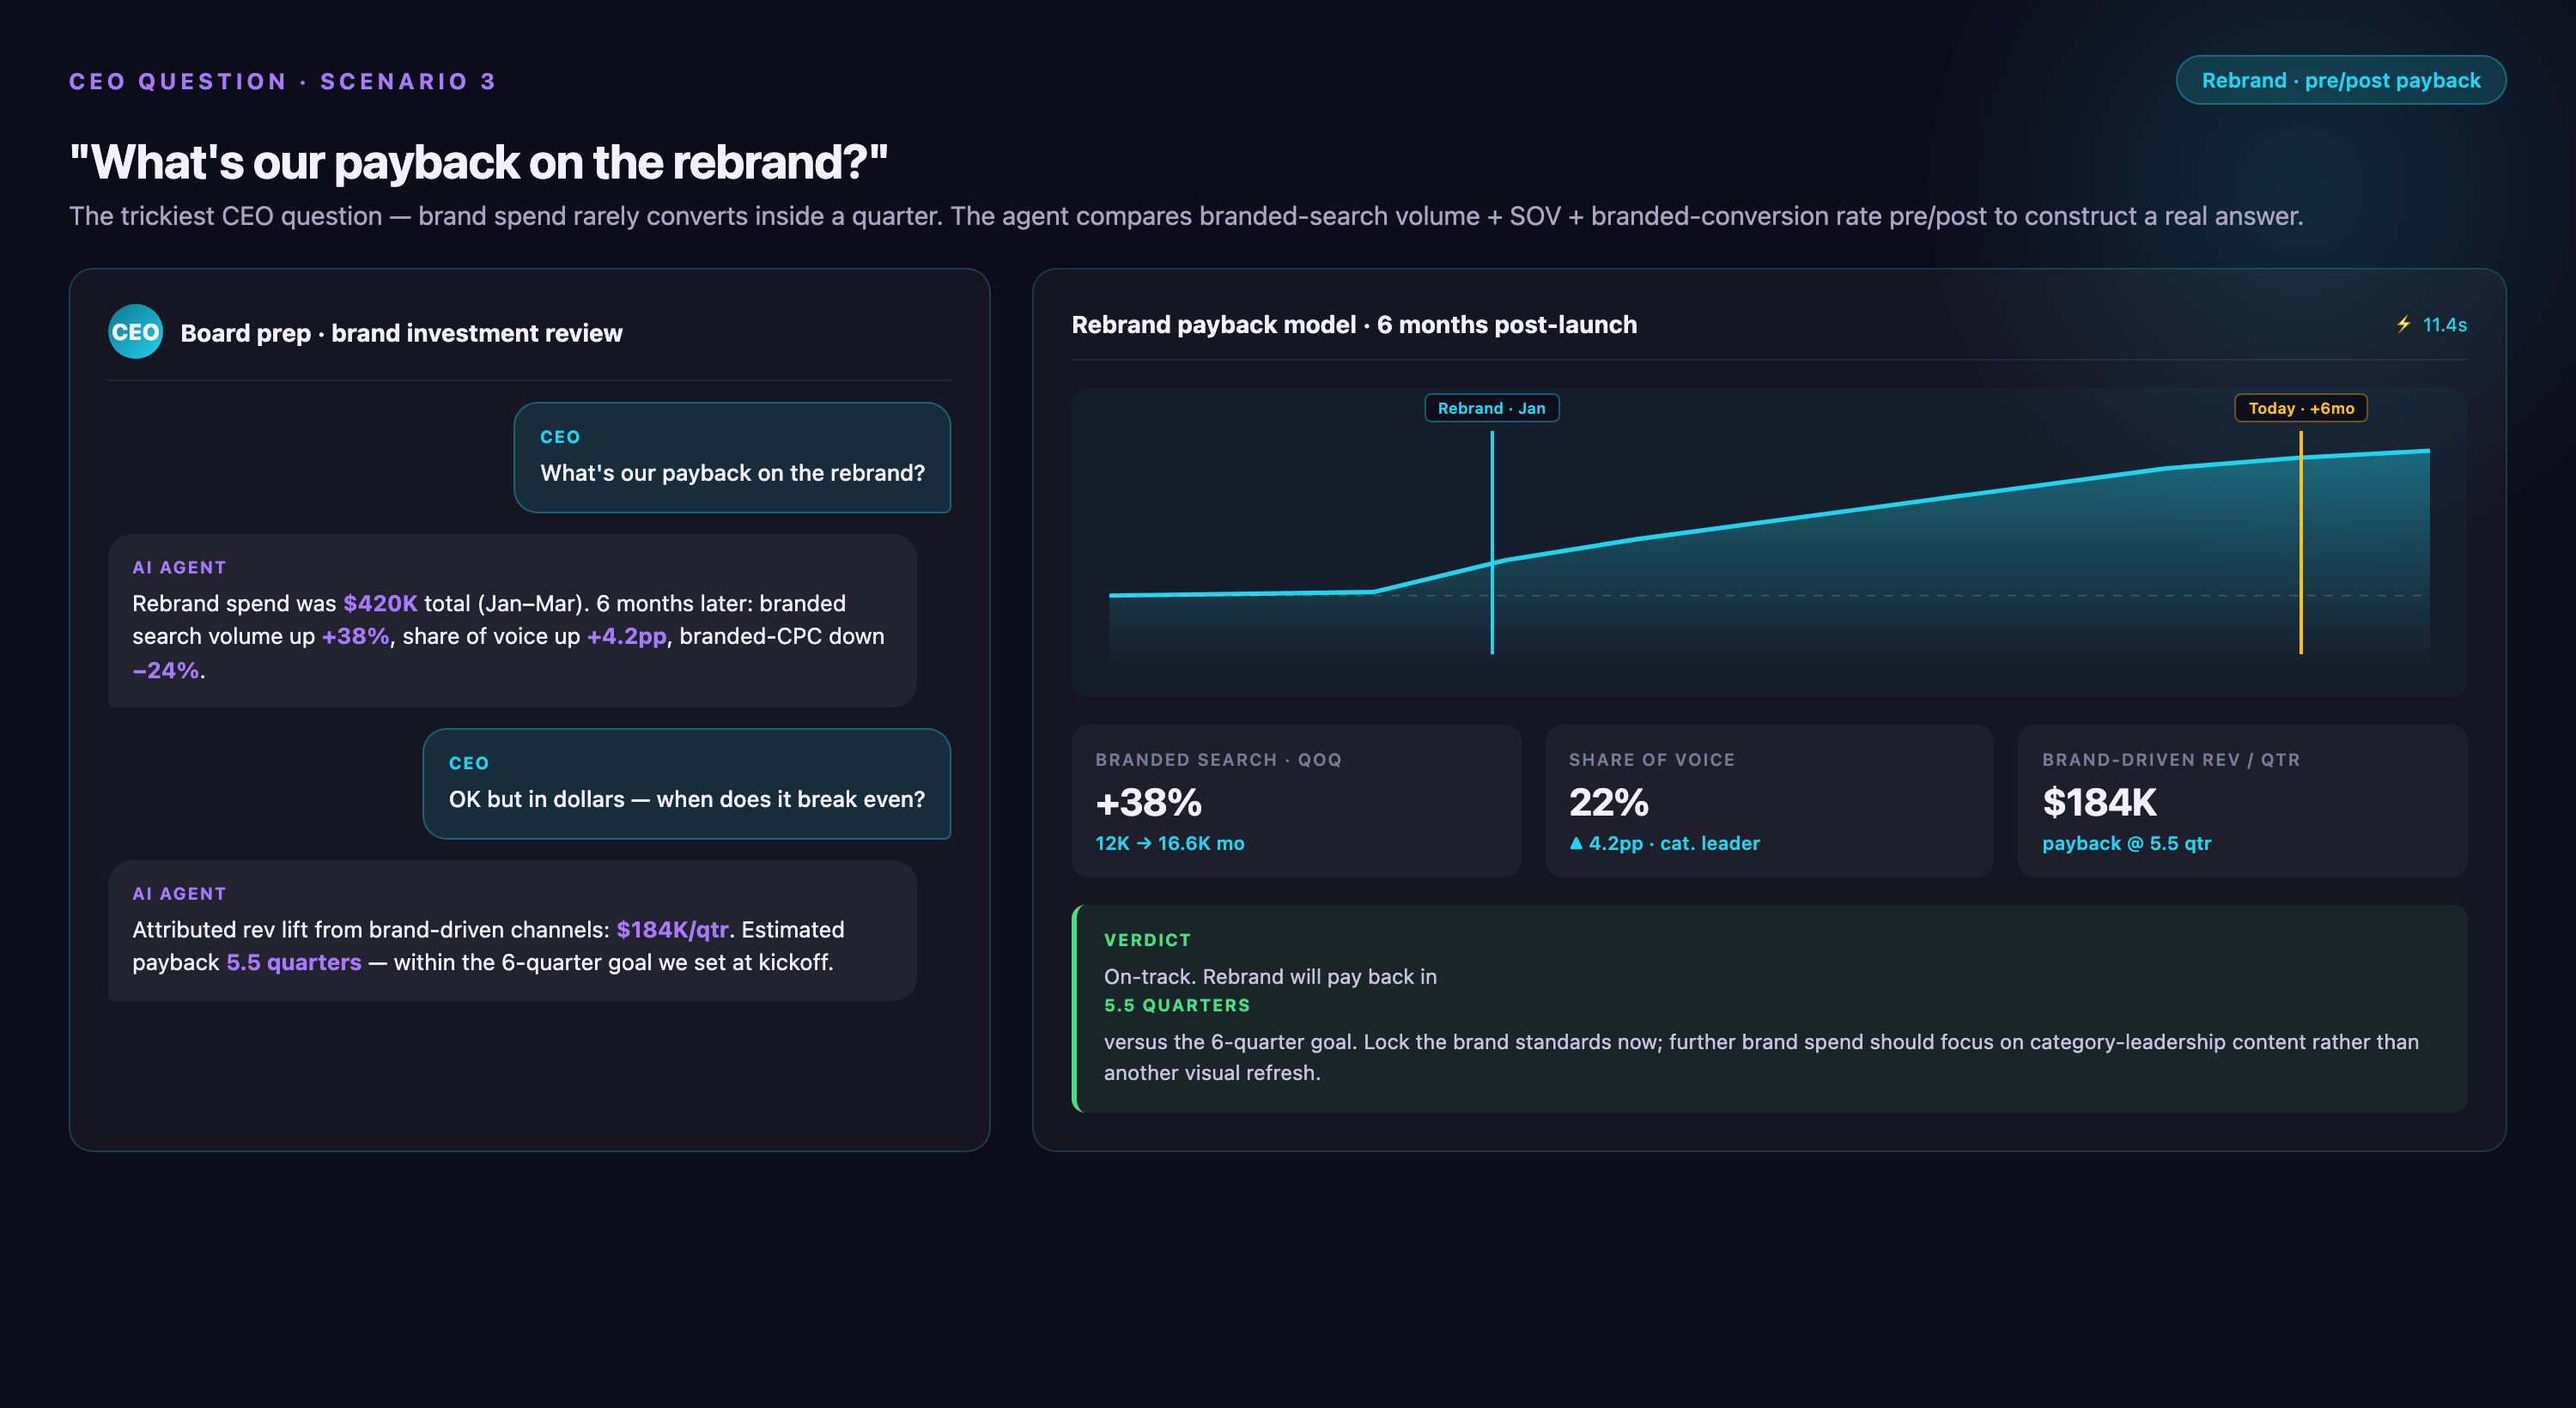
• The dashboard gap: Brand metrics (awareness, share of voice, sentiment, search volume) lived in one dashboard; revenue metrics lived in another. No data model linked the two. The rebrand drove awareness, awareness drove branded search, branded search drove demo requests, demos drove pipeline—but each step was tracked in a different system (social listening tool, SEMrush, HubSpot, Salesforce) and never joined.
The data model fix: Build a brand-to-revenue attribution model that joins: (1) Brand campaign spend and timing (when did rebrand launch, when did PR hit, when did new site go live). (2) Branded search volume by week (SEMrush API or Google Trends). (3) Website sessions from branded search (GA4). (4) Conversions from those sessions (GA4 or HubSpot). (5) Pipeline and revenue from those conversions (Salesforce). Calculate: incremental branded search volume attributable to rebrand (baseline vs post-launch) × conversion rate × ACV = incremental revenue. In this case, the rebrand drove 12,000 incremental branded searches over 6 months, 8% converted to demo, 18% of demos closed at $45K ACV = $7.8M in influenced pipeline, $1.9M closed in first 6 months = 2.4× payback in half a year. But without the data model, it was invisible.
Common Mistakes in CMO Reporting
Four mistakes recur in chief marketing officer reporting across industries, and each one damages executive trust in the dashboard.
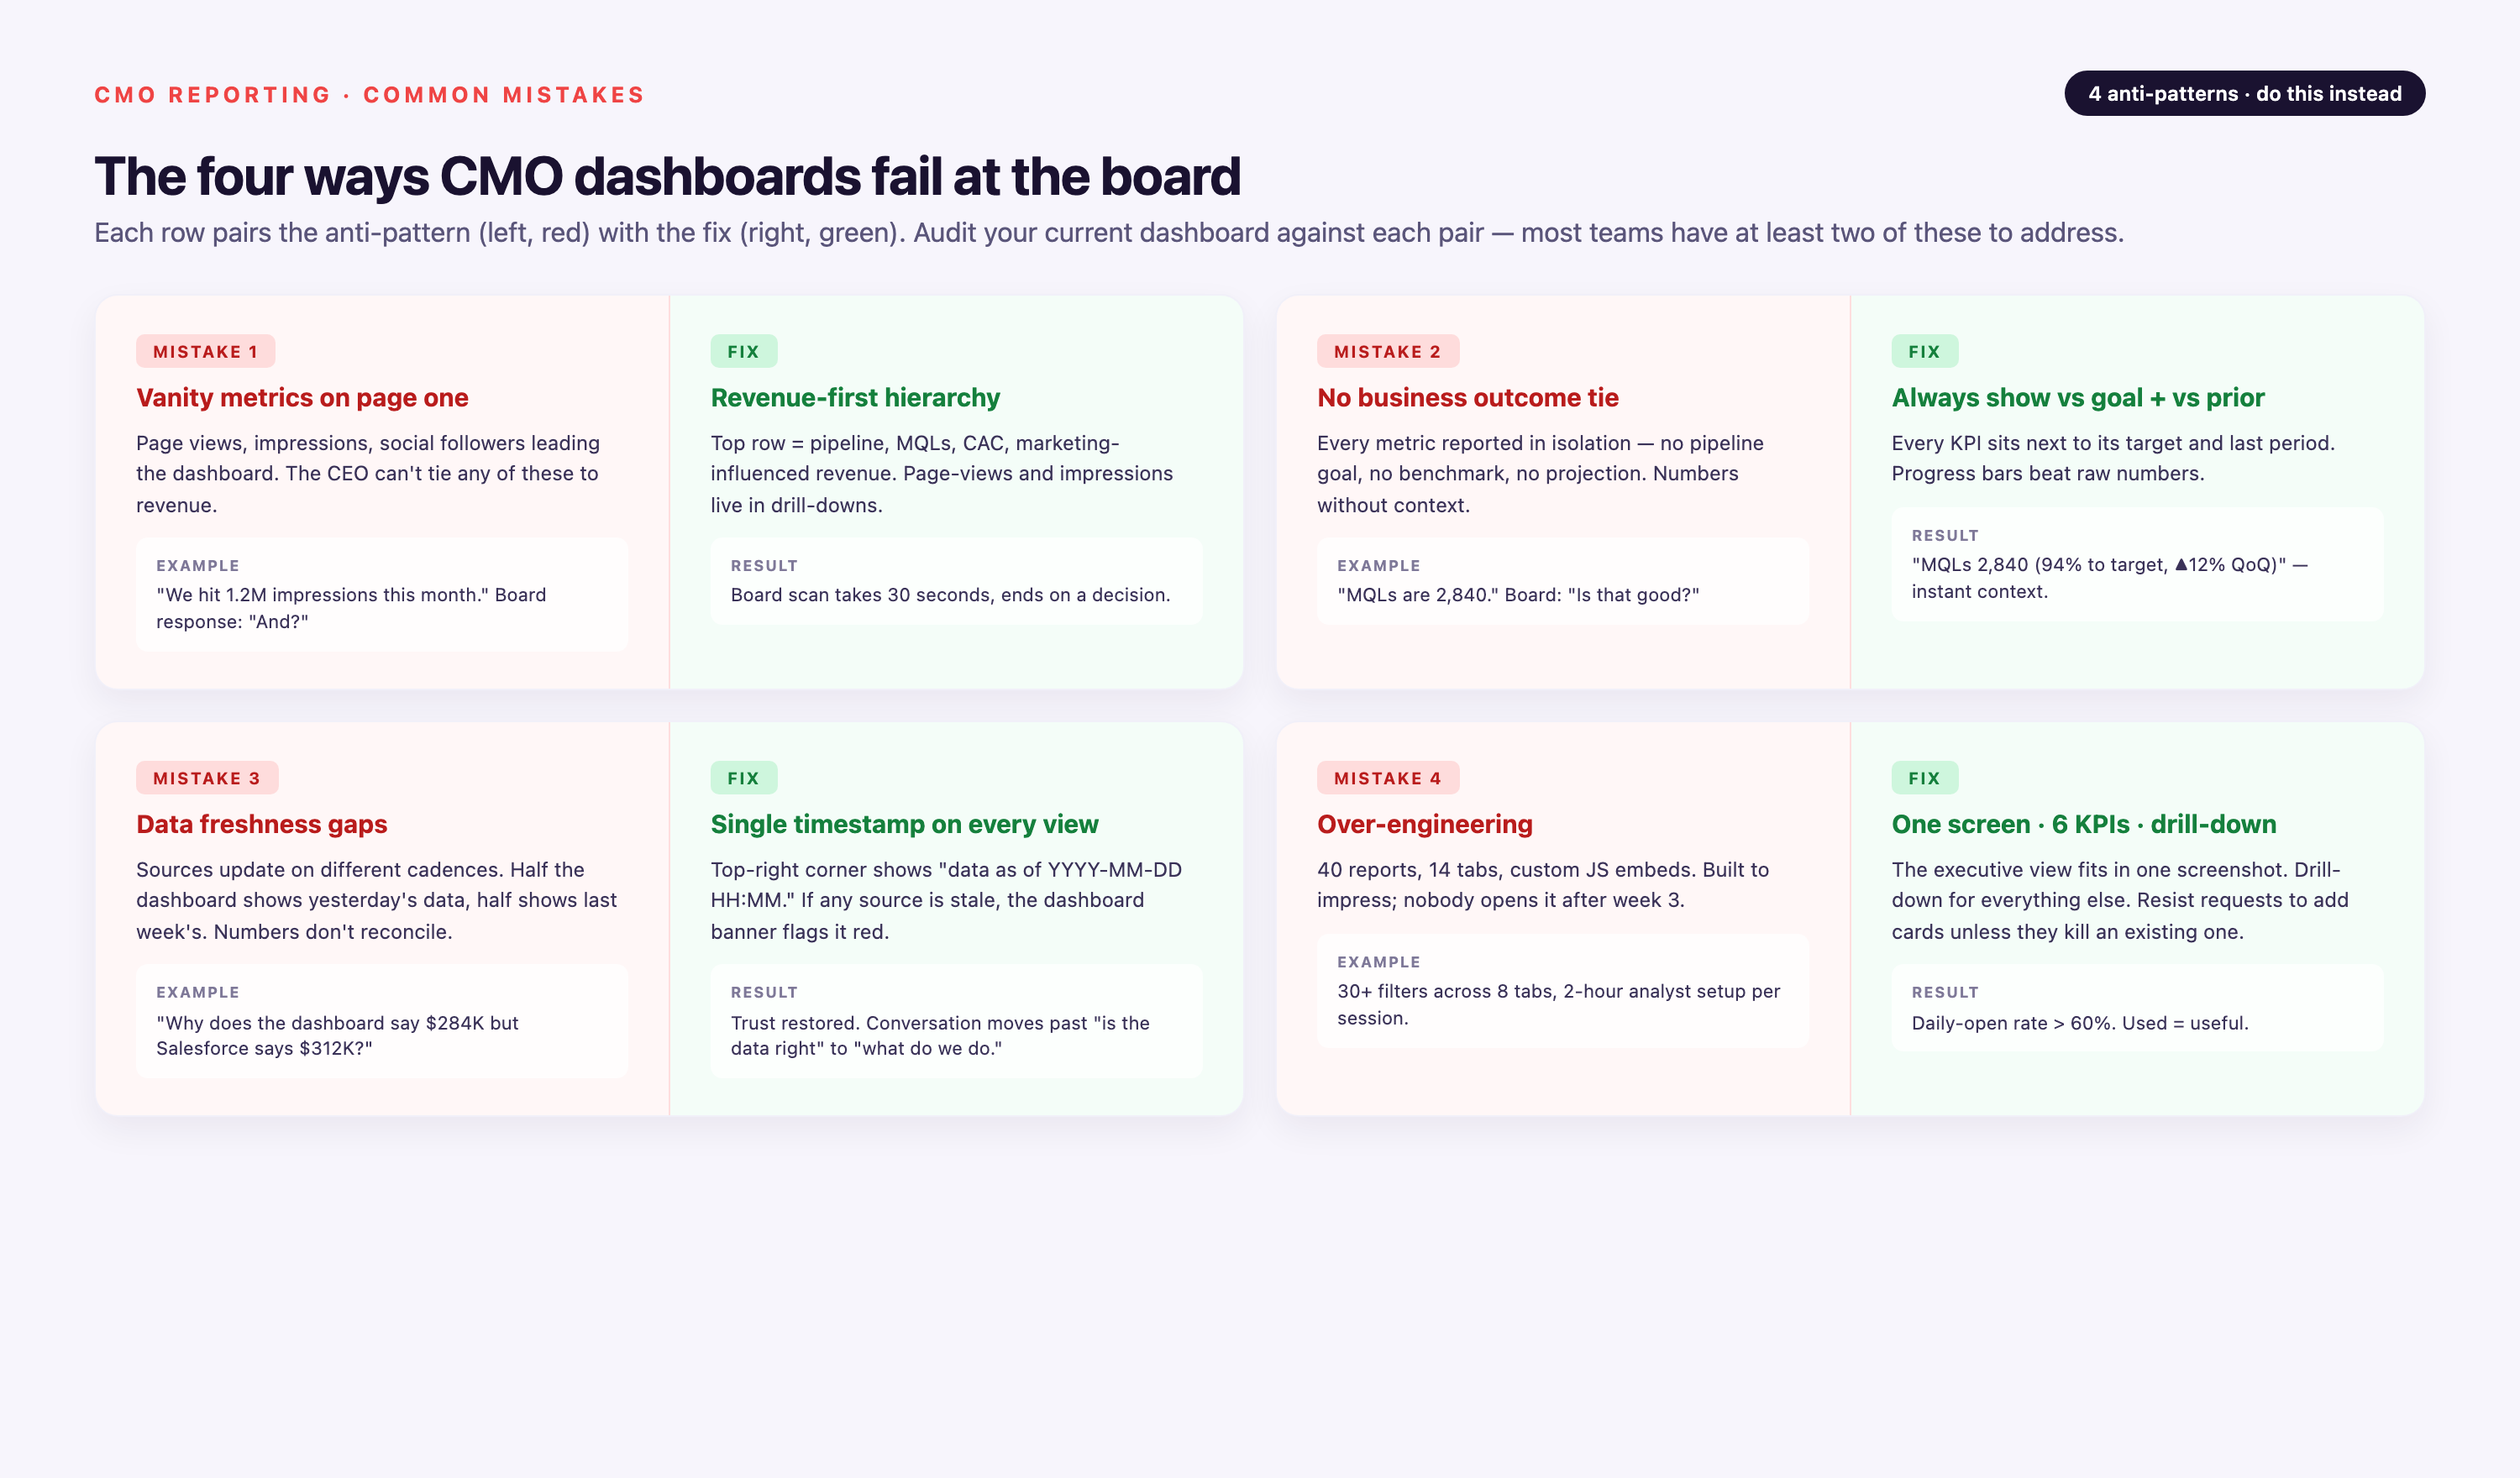
1. Vanity Metrics on Page One
Impressions, clicks, social followers, email open rates. These belong deep in channel-level reports, not on the CMO dashboard. If the CFO can't tie a metric to a dollar, it doesn't belong in the headline row. Exception: brand share of voice and branded search volume are acceptable as leading indicators, but only if you've previously demonstrated (via historical correlation or attribution analysis) that they predict pipeline 1-2 quarters out. Otherwise, they're vanity.
2. No Business Outcome Tie
A dashboard showing 40,000 MQLs this quarter is useless without the MQL-to-revenue conversion rate and the dollar value. Every top-of-funnel metric needs a downstream revenue link, either in the same tile ("40,000 MQLs → 12,000 SQLs → 1,200 closed → $18M revenue, 30% conversion") or in an adjacent rollup view. The CEO doesn't care about MQL volume—they care whether those MQLs turned into money. Show the full chain or don't show the top.
3. Data Freshness Gaps
A dashboard refreshed weekly misses the Monday anomaly the CEO sees in Salesforce on Tuesday, and you lose credibility ("why am I learning about pipeline changes from the CRM and not from you?"). Enterprise CMO dashboards should refresh daily at minimum for pipeline and revenue metrics; hourly for paid spend and website traffic during active campaigns. Cost implication: hourly refresh requires either native platform integrations (HubSpot, Marketo auto-refresh) or a data pipeline with scheduled incremental loads (Improvado, Fivetran). Nightly batch ETL is insufficient for exec dashboards.
4. Over-Engineering
Forty-seven tiles, five filter controls, three drill-down paths. The executive user bounces. Start with the 10-14 metrics above and resist additions unless the CMO or CEO asks for them three times. Exception: if your dashboard serves two audiences (CMO daily self-diagnostic + board quarterly review), build two views. Don't try to serve both in one overcrowded screen.
Tools for Building CMO Dashboards
Three tool categories cover the CMO dashboard stack: BI platforms for visualization, marketing platforms for native reporting, and unified data platforms for extraction and transformation. Most enterprise teams use one from each category.
| Category | Tool | Best For | Limitation | Typical Cost |
|---|---|---|---|---|
| BI Platforms | Tableau | Complex visualizations, exec presentation-quality design, drill-down depth | Steeper learning curve; requires data prep or live connection to clean data source | $70/user/month (Creator), $42 (Explorer), $15 (Viewer) |
| Power BI | Microsoft ecosystem integration, scheduled email distribution, lower cost for large viewer base | Less flexible for custom data models than Tableau or Looker | $10/user/month (Pro), $20 (Premium per user) | |
| Looker | Version-controlled semantic layer (LookML), Git-based collaboration, governed metric definitions | Requires technical resource to write LookML; not marketer-friendly for ad-hoc exploration | Custom pricing (typically $3K-$10K+/month depending on data volume) | |
| Qlik Sense | Associative data engine (click one element, all related data highlights), strong for exploratory analysis | Smaller user community than Tableau/Power BI; fewer pre-built marketing templates | Custom pricing (comparable to Tableau) | |
| Marketing Platforms | HubSpot | Integrated CRM + marketing automation, easy for marketers to build reports, no separate BI license needed | Limited to HubSpot-tracked data; external ad spend and finance data require integrations; attribution window capped at 90 days | Included in Marketing Hub Professional ($800/mo) and Enterprise ($3,200/mo) |
| Adobe Marketo Engage | Revenue cycle analytics, program-level reporting, strong for attribution within Marketo ecosystem | Requires Salesforce or Microsoft Dynamics CRM for closed-loop revenue; reporting UI less intuitive than HubSpot | Custom pricing (typically $2K-$5K+/month for mid-market) | |
| Salesforce Marketing Cloud | Deep Salesforce CRM integration, Einstein analytics for AI-powered insights, multi-cloud (email, social, ads) | Expensive; requires Salesforce expertise; dashboarding via separate Einstein Analytics license | Custom pricing ($1K-$15K+/month depending on clouds and volume) | |
| Unified Data Platforms | Improvado | 1,000+ marketing-specific connectors, marketing data governance layer, custom connector builds in days, AI Agent for natural-language queries, dedicated CSM + professional services included | Higher price point than DIY Fivetran + dbt; overkill for teams with <10 data sources or <$500K annual ad spend | Custom pricing (contact sales; typically operational within a week) |
| Supermetrics | Low-cost entry point, Google Sheets and Data Studio native, good for small teams or single-channel focus | No transformation layer; limited to ad platform and analytics connectors (no CRM, finance, or vertical-specific sources); no governance or version control | $19-$239/month per data source | |
| Funnel.io | Marketing-focused (200+ connectors), automatic cost and conversion mapping, Data Studio and Tableau integrations | Shallower transformation capabilities than Improvado; requires separate warehouse for advanced joins | $1K-$3K+/month depending on sources | |
| Fivetran | General-purpose (400+ connectors across all business functions), reliable for SaaS and database replication, strong engineering team support | Not marketing-specific; no semantic layer (requires dbt or Looker on top); connector setup is technical | $1/credit (varies by data volume; typically $2K-$8K/month for mid-market) | |
| Adverity | Marketing and advertising focus, data quality monitoring, EU-based (GDPR native) | Smaller connector library than Improvado or Fivetran; less U.S. market presence | Custom pricing |
Architecture recommendation: For teams with fewer than 5 sources and simple first-touch attribution, native marketing platform dashboards (HubSpot, Marketo) are sufficient. For 5-20 sources with existing data warehouse and engineering team, use Fivetran or Stitch to extract, dbt or Looker LookML for transformation, and Tableau or Power BI for visualization. For 20+ sources without engineering team, or regulated industries requiring BAA and governance, use Improvado or Funnel.io as the unified platform—they handle extraction, transformation, semantic layer, and often include managed warehouse. This removes the burden of maintaining point-to-point connectors and prevents schema drift.
True Cost of a CMO Dashboard
Tool licenses are the visible cost; the hidden costs are data quality maintenance, analyst time, executive time, and opportunity cost of wrong metrics. This table shows 12-month total cost of ownership for three implementation scales.
| Cost Component | Small ($10-50M revenue) | Mid-Market ($50-200M) | Enterprise ($200M+) |
|---|---|---|---|
| BI Tool License | Power BI: $1,200/yr (10 users × $10/mo) | Tableau: $10,000/yr (10 Creator, 20 Viewer) | Looker or Tableau: $50,000+/yr |
| Data Warehouse | None (use native platform or Google Sheets) | Snowflake: $24,000/yr (~$2K/mo for typical volume) | Snowflake or BigQuery: $60,000+/yr |
| Unified Data Platform | Supermetrics: $3,000/yr (5 sources) | Fivetran: $36,000/yr or Improvado: $48,000+/yr | Improvado: $100,000+/yr (50+ connectors, governance, BAA) |
| Marketing Ops Headcount | 0.25 FTE to maintain: $25,000 allocated cost | 0.5 FTE to maintain: $50,000 | 1 FTE dedicated analyst: $120,000 |
| Executive Time | 2 hrs/month (CMO + CEO) for metric review: ~$8,000 opportunity cost | 4 hrs/month (CMO, CEO, CFO) for review + definition work: ~$20,000 | 6 hrs/month (exec team + board prep): ~$40,000 |
| Data Quality Incidents | 1 incident/quarter × 4 hrs to resolve × $150/hr: $2,400 | 2 incidents/quarter × 8 hrs × $150/hr: $9,600 | 4 incidents/quarter × 12 hrs × $200/hr: $38,400 |
| Opportunity Cost of Wrong Metrics | Low (small budget, faster to pivot) | Medium—6 months optimizing MQLs when CEO cared about pipeline = ~$50K in misallocated spend | High—board loses confidence, budget frozen, CMO replaced = unquantifiable but highest cost |
| 12-Month Total (Visible + Hidden) | ~$40,000 | ~$150,000 | ~$400,000+ |
The largest hidden cost is opportunity cost—when the dashboard optimizes for the wrong metric (MQLs instead of pipeline, or last-click ROAS instead of incrementality), the organization misallocates capital for quarters before the error is discovered. A mid-market company spending $2M/year on marketing and optimizing for MQLs when pipeline velocity mattered could waste $500K in slow-converting spend before correction. That's why metric governance (written definitions, finance approval, quarterly reconciliation) and executive alignment (CEO explicitly states top 3 metrics) are higher ROI than adding more dashboard tiles.
How Improvado Powers CMO Dashboards
Improvado sits between the CMO's data sources and the CMO's dashboard, handling extraction, transformation, governance, and loading. The product extracts data from 1,000+s—Google Ads, Meta, LinkedIn, TikTok, HubSpot, Salesforce, GA4, Amazon DSP, and vertical-specific sources like Doximity for pharma or Epic EMR spend data for healthcare—transforms it through a Marketing Data Governance layer with 250+ pre-built validation rules, loads it into Snowflake, BigQuery, Redshift, Databricks, or a native Improvado-managed warehouse, and renders dashboards in Tableau, Power BI, Looker, or any BI tool the team already uses. Custom connectors (for proprietary systems or niche platforms) are built in days, not months.
On top of the warehouse, the Improvado AI Agent answers natural-language questions—"what drove the 15% MER drop last week?" or "show me CAC by channel for enterprise deals closed this quarter"—by running the SQL, joining the right tables, and returning a drill-down with contributing channel, campaign, and creative. For regulated industries, Business Associate Agreements (BAA) are available for HIPAA-covered entities, and the architecture operates above the tracking layer—aggregated campaign and spend data, not individual user tracking. Improvado is SOC 2 Type II certified and supports GDPR and CCPA compliance.
The result for the CMO: one source of truth for the 14 metrics above, governed metric definitions that prevent formula drift, one dashboard the board will read, and one AI agent that answers the CEO's follow-up questions without a two-week request queue to marketing ops. Typical implementation time is days, not months, with a dedicated customer success manager and professional services included (not an add-on). Improvado preserves 2 years of historical data even when connector schemas change, preventing the "we can't reproduce Q2 numbers" failure mode.
Limitation: Improvado's price point and feature depth are overkill for teams with fewer than 10 data sources, under $500K annual marketing spend, or simple first-touch attribution needs. For those scenarios, native platform dashboards (HubSpot, Marketo) or lighter ETL tools (Supermetrics, Funnel.io) are more cost-effective. Improvado is built for complex enterprise stacks where governance, compliance, and executive trust are non-negotiable.
When You Don't Need a CMO Dashboard Yet
Not every company is ready for a formal CMO dashboard. Four scenarios where building one is premature, and what to do instead.
1. Pre-Product-Market Fit (Under $2M ARR, High Experimentation)
A dashboard formalizes metrics before you know what to measure. When you're still testing messaging, ICP, and channels, locking in CAC, LTV, and attribution models is counterproductive—the definitions will change monthly. Use instead: A simple spreadsheet with weekly cohort tracking (spend, leads, conversions by source) and qualitative notes ("this message resonated, this audience didn't"). Graduate to dashboard when you have repeatable playbook (same channels, same ICP, same funnel for 3+ months).
2. Founder-Led Sales with Fewer Than 20 Customers
When the CEO knows every customer by name and closes every deal, a CMO dashboard is theater—it reports on activity the CEO already sees firsthand. Use instead: CRM hygiene (Salesforce or HubSpot with disciplined lead source tracking) so when you do scale, historical attribution is intact. Graduate to dashboard when sales team grows beyond founder (VP Sales hired, AEs ramped) and CEO can't track every deal.
3. Marketing Budget Under $500K/Year or Fewer Than 5 Data Sources
At low spend and source count, CAC and LTV are too noisy (sample size too small), and dashboard infrastructure cost (BI tool + warehouse + data platform = $30K-$80K/year) exceeds the value of insights. Use instead: Native platform dashboards (HubSpot, Google Ads, Meta Ads Manager) with monthly manual rollup in Google Sheets. Graduate to unified dashboard when you cross $500K annual spend or 5+ active paid channels.
4. Company in Pivot or Repositioning
When GTM motion is changing—new ICP, new product line, new sales model (PLG to enterprise, or vice versa)—the old dashboard's segmentation, attribution, and benchmarks are obsolete. Building a new dashboard before the new motion stabilizes leads to definition churn and wasted work. Use instead: Lightweight tracking of new-motion experiments (separate GA4 property, separate HubSpot pipeline, separate ad account) with weekly qualitative review. Graduate to dashboard when new motion is repeatable (90 days of consistent funnel performance, sales team trained, ICP validated).
Conclusion
A CMO dashboard that survives board review does four things: (1) answers the CEO's top three questions—are we hitting pipeline, where is spend leaking, what changed—in under 30 seconds, (2) ties every metric to a revenue outcome or leading indicator that predicts revenue, (3) refreshes faster than the CEO checks Salesforce so you're never behind, and (4) has governed metric definitions that finance trusts and can reconcile. The readiness diagnostic in this guide scores whether your current reporting meets that bar. The 14 metrics, 5 layout principles, and 5 archetypes by company type provide the blueprint. The three CEO questions that break dashboards show where most implementations fail—lack of drill-down, no incrementality view, brand disconnected from revenue. And the decision tree and cost model show when to build in native platform, when to add a data warehouse, and when infrastructure cost exceeds value.
For teams managing 10+ data sources, multi-channel attribution, or regulated-industry compliance, a unified data platform (Improvado, Fivetran + dbt, or Funnel.io depending on technical resources) is the difference between a dashboard that's trusted and one that's questioned every quarter. The goal is a single artifact the CEO reads weekly, the board references in capital allocation decisions, and the CFO uses to defend marketing budget—not the 40-tab spreadsheet marketing ops sends around every Monday.
Related reading: CMO Dashboard Template 2026: Build Executive Reporting

