Video marketing has turned the tables around for social media marketing strategy as a whole. Marketing on social media domains became a billion-dollar industry in no time after the mega power of video ads was introduced. This could be because video content is consumed much faster and retrieved for longer in the minds of the viewers. Regardless, we know that a video marketing strategy should be central to your overall marketing plan.
Also, video production is more cost-effective than any other form of content because you can now shoot a high-quality video on your smartphone. Sure, professional lighting, camera equipment, and sophisticated editing software would be needed but that’s only a part of your marketing budget if your firm has a full-blown marketing agency in place.
Advertising through videos is especially gigantic on platforms like YouTube, Instagram, and TikTok. YouTube is the king of videos without any doubt. The other two platforms are just as rewarding. You just need to learn the professional specs and technicalities to be met, and the rest really depends on the extent of your creativity. You can also brush up with the trend of social media scheduling. Tools like RecurPost can be a total game-changer for your brand’s social media marketing strategy.
This article will educate you on the benchmarks that are to be followed if you want to advertise on social media giants like YouTube, Instagram, and TikTok.
YouTube Ads Benchmarks
People spend a significant amount of time on YouTube, meaning more and more advertisers are drawn towards the platform. So, if you are someone who is looking to spend money on YouTube Ads, you would certainly want to do it right. In order to get it right, you will have to study certain benchmarks set by the industry to know if you are underperforming.
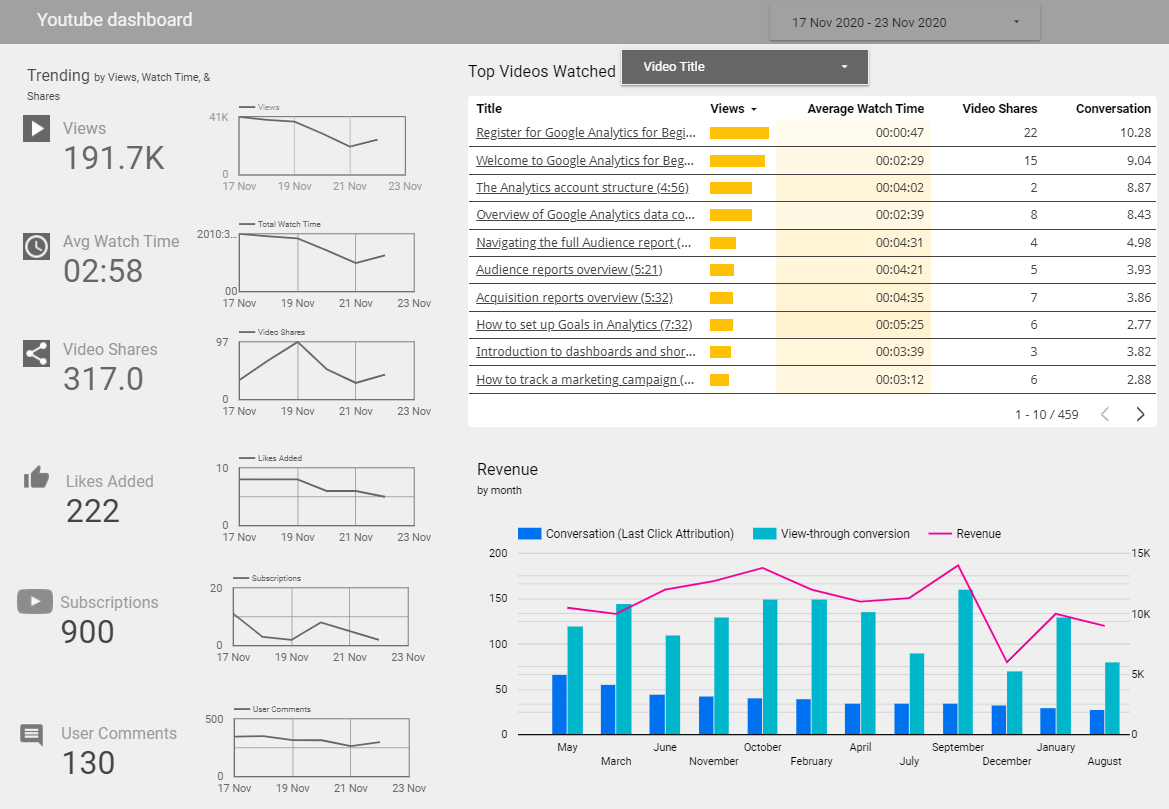
Besides, you might need a comprehensive YouTube dashboard to understand better how your videos perform. If you don't have one yet, we've got you covered.
Our YouTube dashboard covers all vital YouTube metrics, from views to revenue generated with your videos. With this template, you no longer have to mess around with tangled metrics across hundreds of videos.
View rate benchmark
The average view rate for YouTube Ads is 31.9% as per the data from the Strike Social Benchmark report.
The average is derived by dividing the number of views by the total impressions.
- View rate as per age group
YouTube Ads view rate as per age group would be:
- View rate as per Gender
Here is how YouTube Ads view rate fares as per gender:
- View rate as per month
Here is YouTube Ads view rate by the month:
- View rate as per the device
Here is a representation of YouTube Ads view rate by the device:
YouTube Ads CTR benchmark
The average YouTube Ads CTR would be 0.65%.
💡CTR stands for Click Through Rate. You can derive it by dividing the total number of clicks by all the views.💡
- YouTube Ads CTR by the industry
YouTube Ads CPV
The average YouTube Ads CPV would be $0.026
💡CPV stands for Cost Per View. We can derive CPV by dividing the overall cost by the number of views.💡
- CPV as per age group
Here is how CPV as per age group breaks down
- CPV as per gender
Here is how CPV as per gender breaks down:
- CPV as per month
Here is how CPV as per month breaks down:
- CPV as per the device
Here is how CPV as per device breaks down:
- CPV as per industry
Here is how CPV as per industry breaks down:
Even though these metrics seem pretty straightforward, tracking them might be too challenging. Performance metrics are scattered across tens of videos, so it's hard to build a comprehensive picture of how viewers navigate through the content and what videos drive more conversions.
Here, at Improvado, we help marketers make sense of their video performance metrics. Improvado gathers all data and converts it into the analysis-ready format. Then, the platform stores all insights in a unified data storage.
Marketers can connect any visualization tool (or use our dashboard templates) to the storage to get a different perspective on their video marketing performance. What's more, they can merge these insights with metrics from other sources, such as TikTok, to build a holistic picture of their efforts and better allocate marketing dollars.
TikTok Ads Benchmarks
Advertising on TikTok is a no-brainer because the app has shown unprecedented growth in the past 2-3 years. It is the 2nd most downloaded app worldwide across Apple App Store and Google Play. Your brand must consider advertising on this platform if it isn’t already. We will have a quick run-through of TikTok Ads benchmarks so that you do not fall behind the industry standards.
🚀Read our Global Digital Advertising Spend by Industry in 2021🚀
TikTok engagement rate benchmark
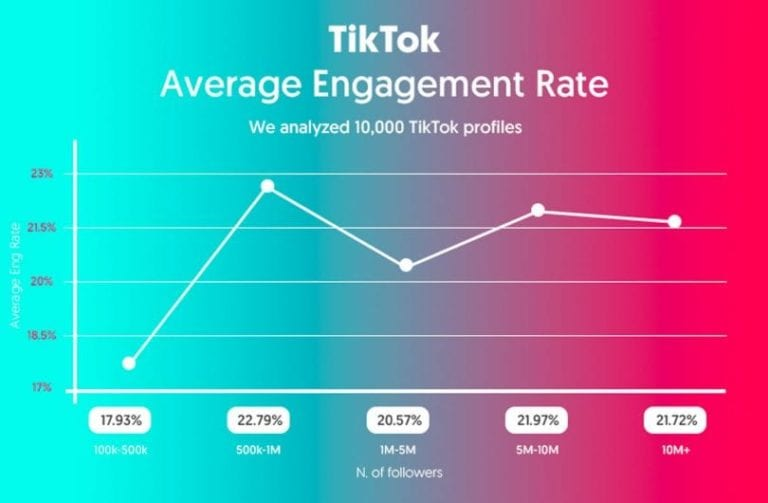
The engagement rates on TikTok range from 3 % to 9% based on the brand’s following. The platform is every brand’s dream because of the stellar engagement levels. The volume of content that is released is so high that users do not think before liking, posting, or following content.
Here’s a chart representing the average engagement rate on TikTok.
TikTok CTR benchmarks
There are multiple types of paid Ads formats on TikTok and all of them reap high engagement rates. Here are CTR benchmarks for different ads formats:
- Top-view: 12-16% CTR for in-feed video with sound on
- Take-over: 7-10% CTR, starting when TikTok is opened
- In-Feed video: 5-7% ER and 1.5- 3% CTR to site for Standard in-feed Ad unit.
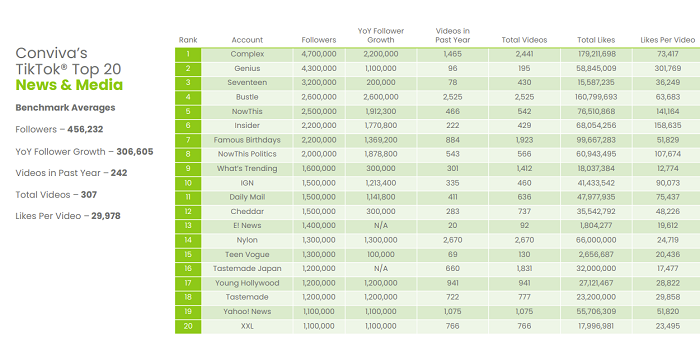
To understand the TikTok performance metrics better and perform well, Conviva (streaming analytics provider) has published an elaborate report on TikTok benchmarks and strategy. The report provides insights on 900 branded TikTok accounts, from across 10 industries.
The 45- page report can be downloaded here, and can be used to gain meaningful insights like which are the most followed brand accounts along with the ones that have seen the fastest growth.
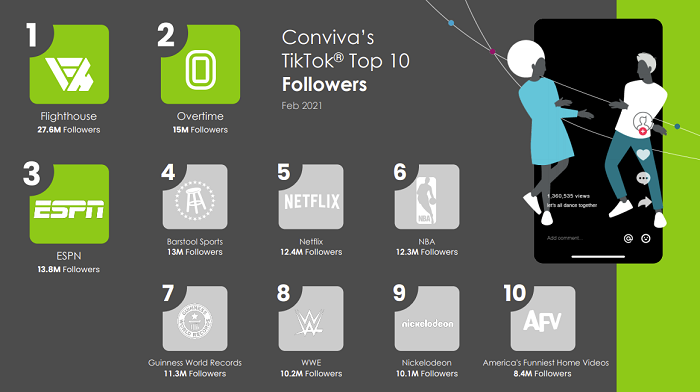
The report also entails industry-specific performance statistics. It further elaborates on the growth that is seen by each of the featured brands and their individual upload engagement.
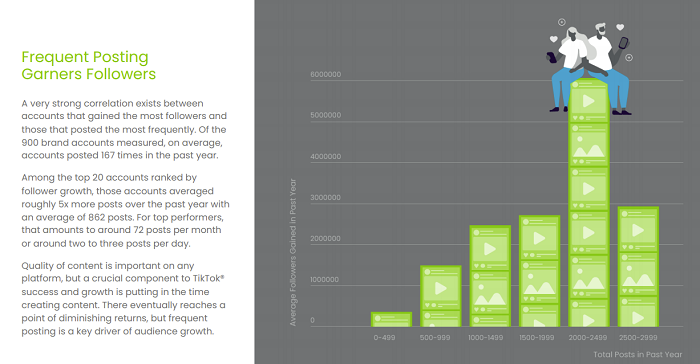
There are also some strategic insights on common strategies adopted by brands:
Instagram reels Ads benchmarks
Instagram reels are very resourceful for brands who want to advertise on Instagram. They have the potential to reach people who do not follow you and give you a global stance where brands and creators can be discovered by everyone.
🚀Get a holistic view of Instagram ads with Instagram reporting tool🚀
Instagram reels view rate benchmark
A video view rate would be a minimum of 3 seconds, meaning that if a user is scrolling through the newsfeed and a video lasts on their screen for at least 3 seconds, it will count as 1 view.
Post Video View Rate = 3-second videos divided by Reach
Profile Video View Rate = Average of all post video view rates during a given time period.
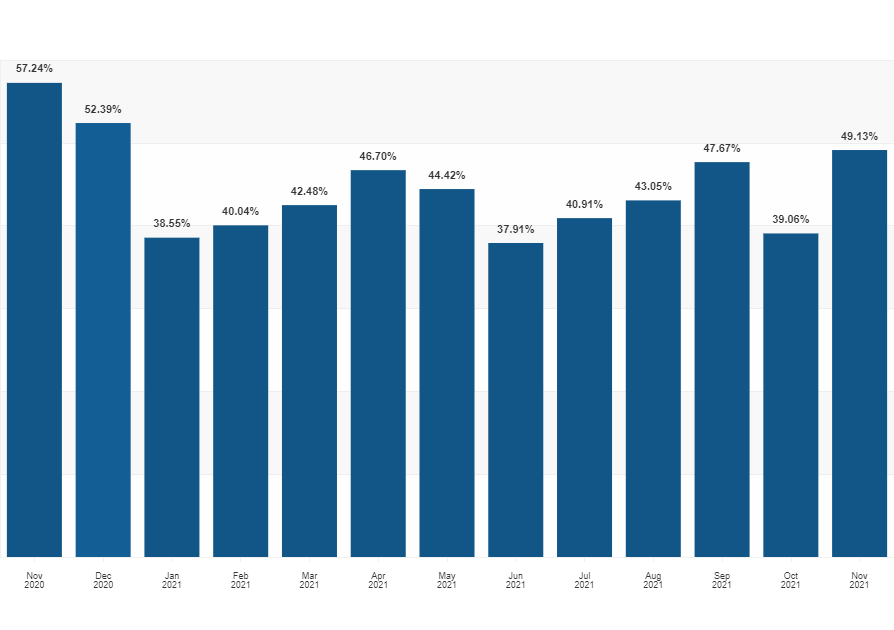
Here is a graph that represents the video view rate on Instagram for the year 2021:
Instagram reels engagement rate benchmark
Engagement on your Instagram is volatile. One post could drive in mad engagement and another one simply wouldn’t, and there is not much explanation as to why exactly that happens. However, social media analytics would help us get to the depth of how individual actions affect engagement rates on your page.
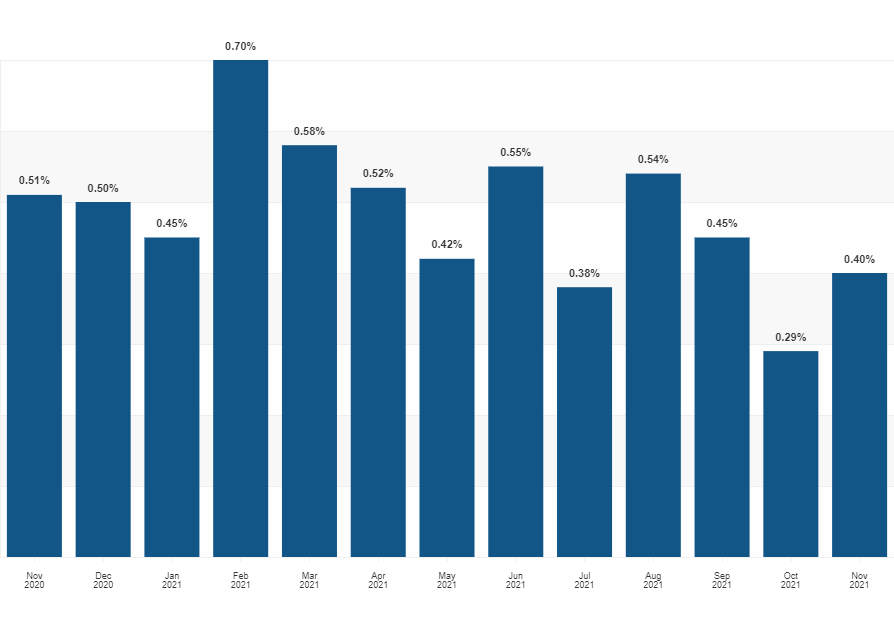
Here is a chart that represents the engagement rate on Instagram public posts for the year 2021:
Instagram reels CTR benchmark
Instagram has a Click Through Rate of 0.88%.
Instagram reels CPC benchmark
The cost per click for Instagram reels stands as the following:
- The cost per click for Instagram Ads is $0.40-$0.70 (likes, link clicks, reactions, shares, comments)
- Instagram Ads cost per click to destination URL is $0.50 - $ 0.95
- The cost per engagement for Instagram Ads is $0.01 - $0.05
- The cost per thousand impressions for Instagram Ads is $2.50 - $ 3.50
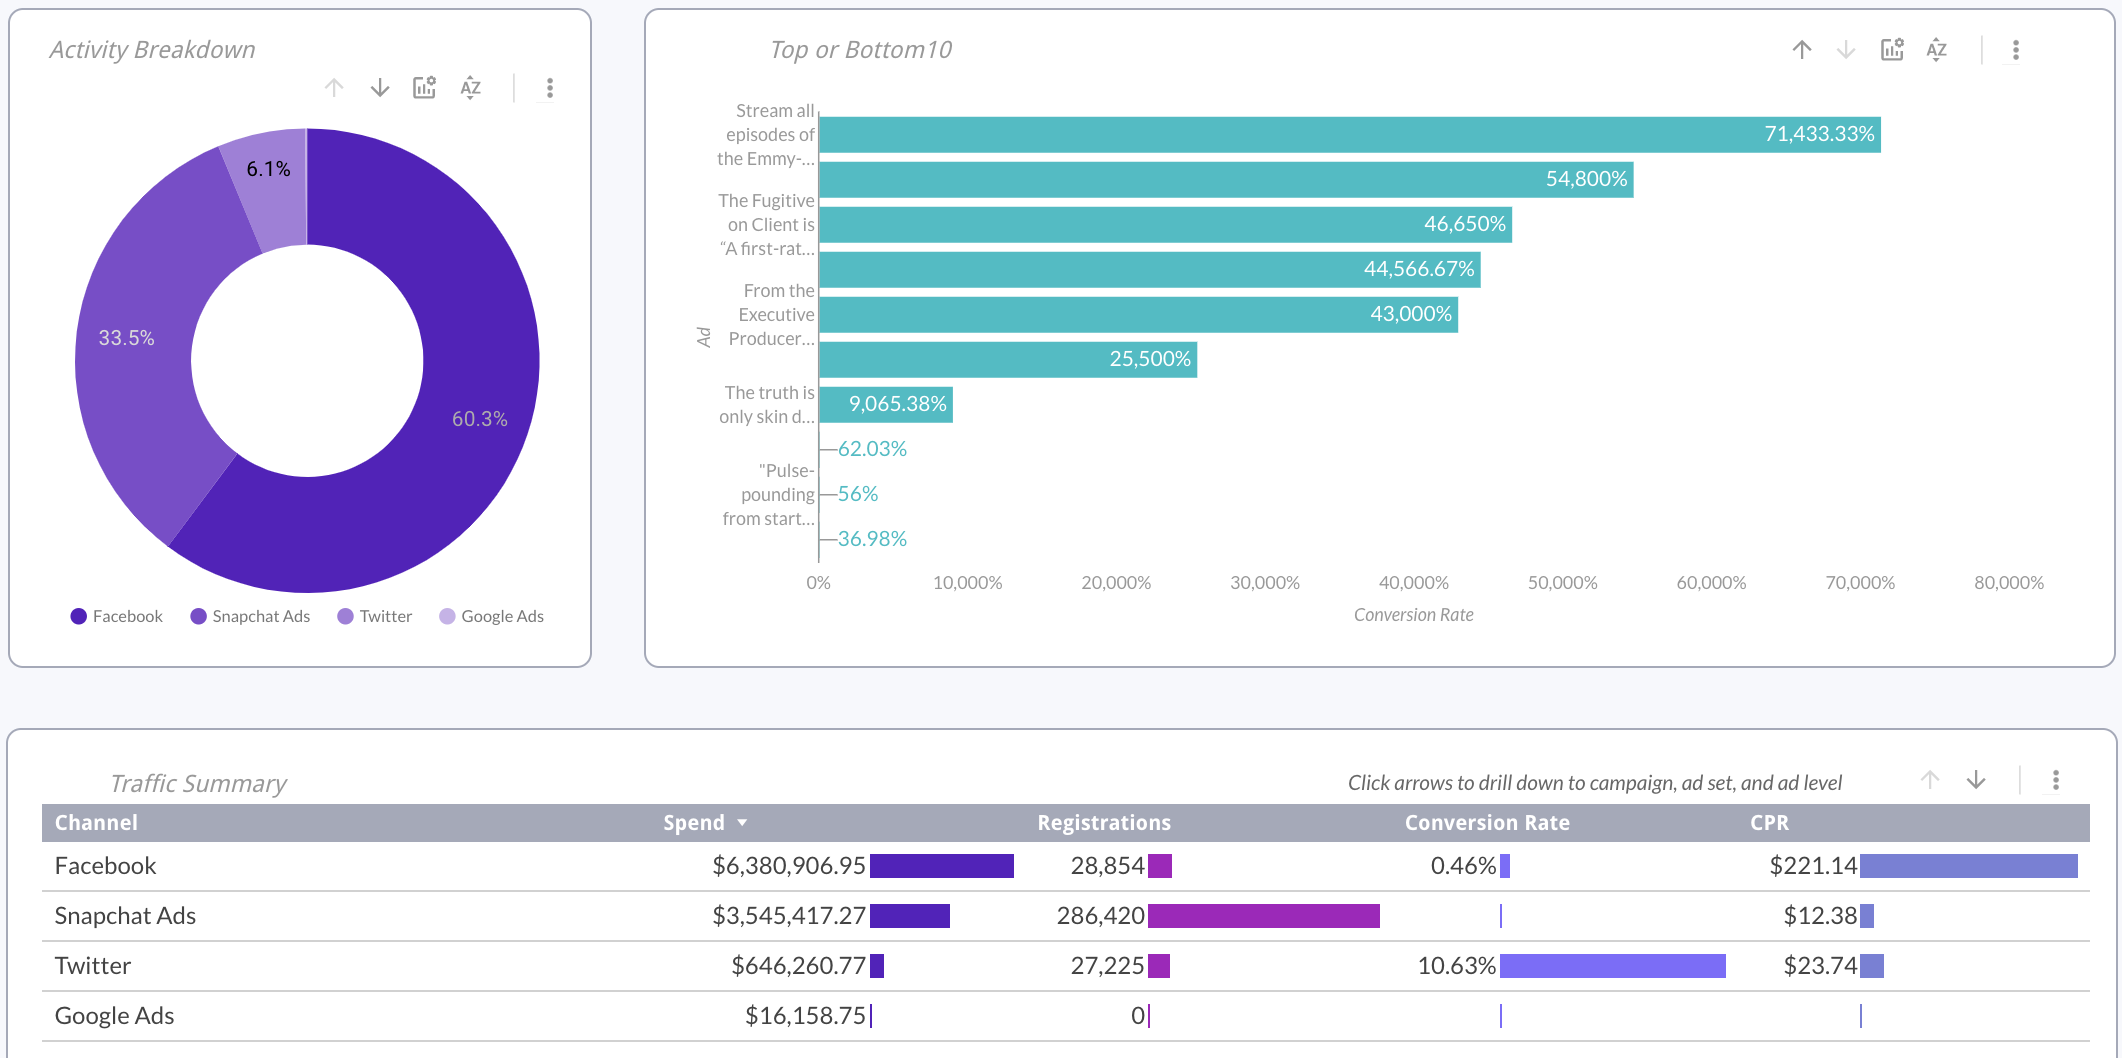
To get a better grasp of your TikTok and Instagram performance, you might need a social media marketing dashboard. And we're glad to share our own go-to dashboard template with you.
You can merge data from TikTok, Facebook, Instagram, Snapchat, and other social media platforms to monitor the overall ad spend, number of impressions, conversions, CPC, and a range of other metrics across all campaigns.
Conclusion
Being thorough with the latest social media statistics benchmarks would definitely help brands in shaping their social media marketing strategy for success. The above-mentioned statistics would act as a benchmark for your firm. If your stats are any different than these, you might want to conduct insightful research about why your product content is not working. Getting these insights and staying close to the benchmarks will help you stay above your competitors in the market.
.png)



.png)
