
One platform many businesses have overlooked in recent years is Pinterest, a visually engaging platform bursting with potential. Pinterest has over 450 million monthly active users, and 45% of its US user base has a household income of over $100K. Shopping and link-clicking are common occurrences on the platform, and many people use the app specifically to get inspiration for purchases.
If your brand decides to take the leap and advertise on Pinterest, you’ll need a Pinterest ads dashboard. The native platform offers basic analytics, but modern marketers face a bigger challenge. Your Pinterest campaigns don't exist in a vacuum. They interact with your efforts on Google, Facebook, and other channels. Without a unified view, you're flying blind, unable to see the full picture of your marketing performance.
This guide will show you how to move beyond the basics and build a Pinterest Ads dashboard that drives real growth.
Key Takeaways:
- The native Pinterest Ads Manager is a good starting point but lacks the cross-channel context needed for holistic marketing analysis.
- A centralized Pinterest Ads dashboard automates reporting, standardizes metrics, and provides a single source of truth for your entire team.
- Essential metrics go beyond impressions and clicks. You must track cost (CPC, CPM), conversions (CPA), and profitability (ROAS).
- Building a powerful dashboard involves integrating data from all marketing sources to understand the complete customer journey and optimize for total ROI.
What Is the Pinterest Ads Dashboard?
Every advertiser on Pinterest interacts with a dashboard. It's the central hub for creating, managing, and monitoring your campaigns. However, it's crucial to distinguish between the native tool provided by Pinterest and a more powerful, centralized dashboard solution.
The Native Pinterest Ads Manager: Your Starting Point
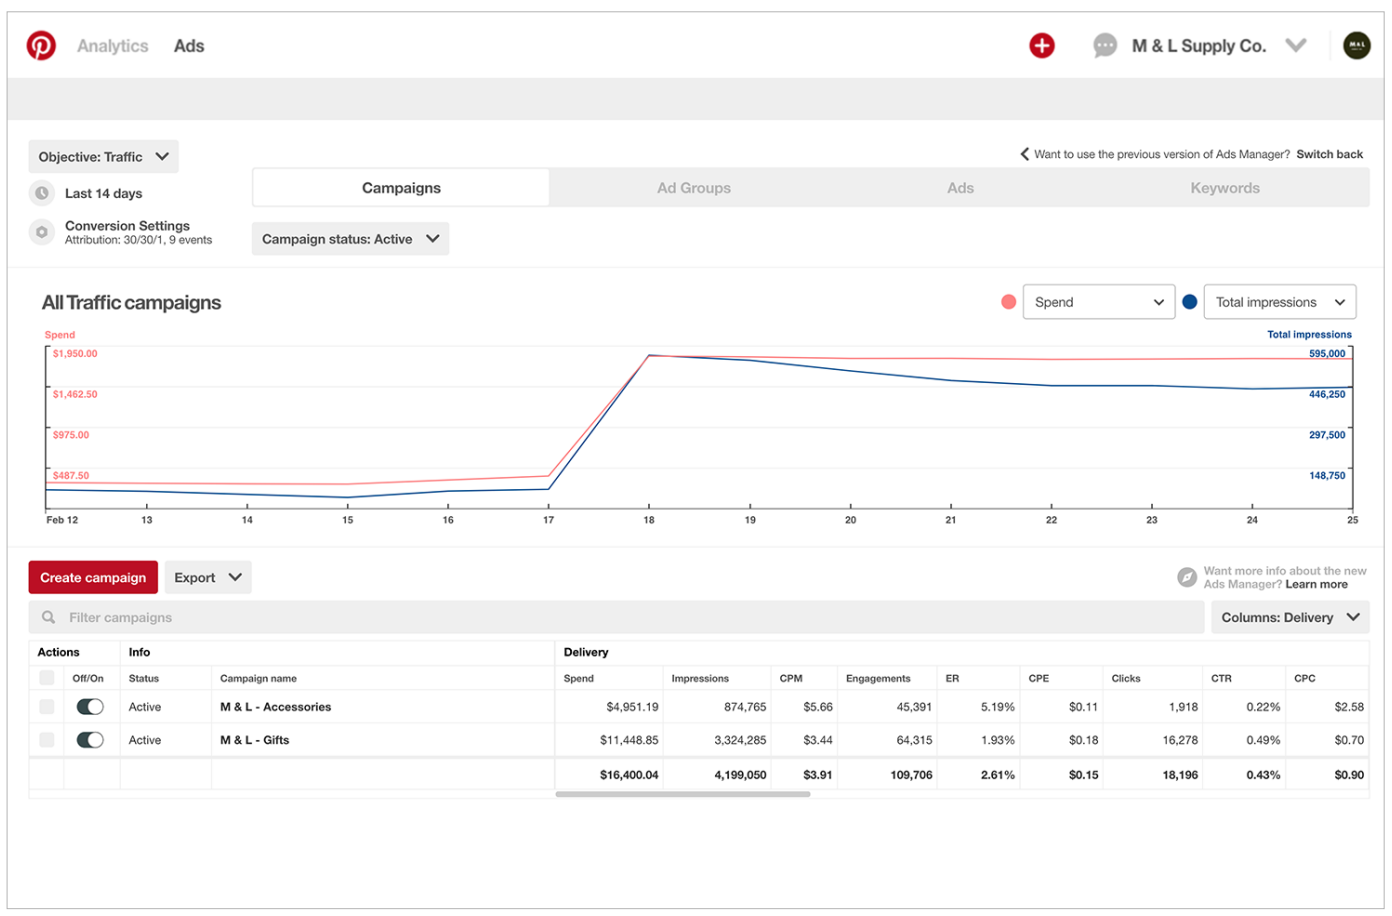
Pinterest Ads Manager is the built-in interface where you'll find your performance data. It's where you launch campaigns, set budgets, and define targeting.
It provides a functional overview of what's happening within the platform. Inside the Ads Manager, you get access to several core features.
- You can view data at the campaign, ad group, or individual ad (Pin) level.
- The reporting table allows you to customize columns to show specific metrics.
- You can also filter by objectives, date ranges, and campaign status.
It’s a solid tool for day-to-day campaign management and quick performance checks inside the Pinterest ecosystem.
The Critical Limitations of Pinterest's Native Analytics
The primary weakness of the native dashboard is its isolation. It only shows you Pinterest data. This creates significant data silos.
You can't easily compare your Pinterest CPA against your Google Ads CPA. You can't see if a user who first saw your brand on Pinterest later converted through a search ad.
This lack of a unified view makes true performance marketing and budget optimization nearly impossible.
Why You Need a Unified, Cross-Channel View
Modern marketing is a complex web of touchpoints. A customer might discover your product on Pinterest, research it on Google, and finally purchase after seeing a retargeting ad on Instagram.
A centralized dashboard breaks down the walls between these platforms. It pulls all your data into one place, giving you a complete view of the customer journey and allowing you to attribute value correctly across all your channels.
Setting Up and Navigating Your Pinterest Ads Manager
Before you can build an advanced dashboard, you must understand the basics of the native tool.
Accessing Your Dashboard Through a Business Account
To run ads on Pinterest, you need a Pinterest Business account.
It's free to create or convert from a personal profile. Once set up, you can access the Ads Manager through the "Ads" dropdown menu in the top navigation.
This is your gateway to campaign creation and performance reporting.
Understanding the Main Interface: Campaigns, Ad Groups, Ads
The Ads Manager is structured hierarchically.
At the top are Campaigns, where you set your advertising objective (for example, brand awareness, consideration, conversions). Within each campaign, you have Ad Groups, where you define your budget, schedule, targeting, and bidding.
Finally, within each ad group are your actual Ads – the creative Pins that users will see.
Customizing Columns and Date Ranges for Basic Reporting
The reporting view is highly customizable. You can use the "Columns" button to select from dozens of available metrics. This lets you tailor the view to your specific goals.
The date range selector allows you to analyze performance over specific periods, like last week, last month, or a custom timeframe. Mastering these two features is key to initial analysis.
A Step-by-Step Guide to Finding Your Core Data
To find your data, navigate to the Ads Manager. Select the "Reporting" tab. Use the filters at the top to select the campaigns you want to analyze.
Adjust the date range to your desired period. Then, use the "Columns" dropdown to add or remove metrics like Impressions, Outbound Clicks, Total Spend, and key conversion actions.
You can then export this data as a CSV for external analysis, though this manual process is what advanced dashboards aim to eliminate.
12 Essential Metrics for Your Pinterest Ads Dashboard
A dashboard is only as good as the data it displays. Focusing on the right metrics is crucial for understanding performance and making smart optimizations. Here are 12 essential KPIs to include in your Pinterest Ads dashboard, grouped by their function in the marketing funnel.
Awareness Metrics: Impressions & Reach
Impressions are the total number of times your Pin has been displayed. Reach is the number of unique users who saw your Pin. These top-of-funnel metrics tell you how broad your visibility is. High impressions with low engagement might signal a problem with your creative or targeting.
Engagement Metrics: Pin Clicks, Saves (Repins), & Engagement Rate
Pin Clicks occur when a user clicks on your ad to see it up close. Saves (or Repins) are when a user saves your Pin to one of their boards – a strong signal of interest. Engagement Rate (total engagements divided by impressions) provides a holistic view of how well your creative is resonating with your audience.
Traffic Metrics: Outbound Clicks & Click-Through Rate (CTR)
Outbound Clicks are what truly matter for driving traffic. This metric counts how many users clicked through from your ad to your website or landing page.
The Outbound Click-Through Rate (Outbound Clicks divided by Impressions) measures the effectiveness of your ad at persuading users to take action.
Cost Metrics: Ad Spend, Cost-Per-Click (CPC), & Cost-Per-Mille (CPM)
Ad Spend is the total amount of money you've spent. Cost-Per-Click (Spend divided by Outbound Clicks) tells you the price of each visit. Cost-Per-Mille (Spend divided by Impressions, multiplied by 1,000) tells you the cost to reach 1,000 users. Monitoring these helps you manage your budget and efficiency.
Conversion Metrics: Conversion Rate, Cost Per Acquisition (CPA)
Conversion Rate measures the percentage of users who complete a desired action (like a purchase or lead form submission) after clicking your ad. Cost Per Acquisition (Spend divided by Conversions) is one of the most important metrics. It tells you exactly how much you're paying to acquire each new customer.
ROI Metrics: Return on Ad Spend (ROAS) & Revenue
Revenue is the total value generated from conversions. Return on Ad Spend (Revenue divided by Ad Spend) is the ultimate measure of profitability. A ROAS of 4:1 means you're generating $4 in revenue for every $1 you spend on ads. This metric is critical for proving the value of your marketing efforts to leadership.
The Strategic Benefits of a Centralized Pinterest Ads Dashboard
Moving beyond the native tool to a unified dashboard isn't just a matter of convenience. It unlocks strategic advantages that can transform your entire marketing operation.
Gain Unprecedented Transparency and Accountability
A central dashboard creates a single source of truth. Everyone from the CMO to the paid media specialist looks at the same data. This eliminates confusion and debate over which numbers are "correct." It fosters a culture of transparency and makes it easy to hold teams accountable for performance goals.
Automate Reporting and Reclaim Hundreds of Hours
Marketers spend an enormous amount of time on manual data collection and reporting. A unified dashboard automates this entire process. Instead of downloading CSVs and building reports by hand, you get live, always-on dashboards.
This frees up your team to focus on high-value tasks like strategy and analysis. Implementing reporting automation is a key step toward scaling your analytics capabilities.
Standardize Metrics for True Cross-Channel Comparison
Does "engagement" mean the same thing on Pinterest as it does on Facebook? Often, it doesn't. A centralized platform can standardize these metrics with a consistent naming convention. This allows for true apples-to-apples comparisons, helping you understand which channels are truly the most effective for your business.
Fuel Faster, Smarter Decision-Making with Real-Time Data
The market moves fast. Waiting for a weekly or monthly report is no longer acceptable. An automated dashboard provides real-time or near-real-time data. This allows you to spot trends, identify problems, and capitalize on opportunities as they happen, giving you a significant competitive advantage.
Building Your High-Performance Pinterest Ads Dashboard: A 5-Step Process
Creating a dashboard that drives results is a systematic process. It starts with strategy and ends with clear, actionable visualization. Here’s a five-step framework for building a world-class Pinterest Ads dashboard.
Step 1: Define Your Key Performance Indicators (KPIs)
Before collecting any data, you must define what success actually means for your business. KPIs act as the decision framework for every report, dashboard, and optimization action that follows. Without clear KPIs, analytics becomes descriptive rather than strategic.
Focus on three to five core KPIs that directly reflect business outcomes. These should be metrics leadership uses to evaluate performance, not secondary engagement signals.
Here are a couple of examples by industry and business model.
Ecommerce:
- Return on ad spend (ROAS)
- Cost per acquisition (CPA)
- Conversion rate
- Average order value (AOV)
- Revenue per visitor
B2B SaaS:
- Cost per qualified lead (CPL or SQL)
- Pipeline generated
- Customer acquisition cost (CAC)
- Lead-to-opportunity conversion rate
- Customer lifetime value (LTV)
Retail and omnichannel brands:
- Revenue lift
- Store or location-level conversions
- Incremental ROAS
- Cost per visit
- Media-driven sales attribution
Subscription businesses:
- Trial-to-paid conversion rate
- Churn rate
- LTV:CAC ratio
- Monthly recurring revenue (MRR) growth
KPIs must align directly with your business objectives. If the goal is growth, prioritize efficiency and scale metrics. If the goal is profitability, focus on unit economics and long-term value.
Clear KPI definition ensures that every downstream analysis answers the right questions.
Step 2: Centralize Your Data with an Automated Pipeline
This is the most critical technical step. A Pinterest Ads dashboard only works if data from every channel is collected and prepared consistently. You need an automated system that continuously extracts data from Pinterest Ads and aligns it with signals from Google Ads, Meta Ads, Google Analytics, e-commerce platforms, CRM systems, and other sources used in your marketing stack.
Platforms like Improvado simplify this process by providing a managed, end-to-end marketing data pipeline designed for complex, cross-channel analytics.
Instead of building fragile, custom ETL scripts or downloading exports manually, Improvado automates the heavy lifting so your dashboard always reflects fresh, accurate, and unified data.
Key Improvado capabilities that support this step include:
- Automated data ingestion from 1,000+ ad platforms, analytics tools, and revenue systems
- Connector maintenance to handle API changes without manual intervention
- Metric normalization so key KPIs are defined consistently across channels
- Schema standardization for dimensions like campaign, ad group, audience, and region
- Identity and entity mapping to link Pinterest performance with CRM and conversion data
- Governance and validation checks to catch anomalies before they reach dashboards
- Continuous refresh scheduling so your dataset stays up to date
- Flexible delivery into cloud warehouses (e.g., Snowflake, BigQuery, Redshift) or directly to BI tools
With this foundation in place, you gain a reliable, scalable source of truth that supports deeper analysis, faster optimization, and clearer performance comparisons across your entire marketing ecosystem.
Step 3: Clean and Transform Data for Accuracy
Raw data from different platforms is often messy and inconsistent. It needs to be cleaned, standardized, and transformed.
This involves tasks like handling currency conversions, standardizing campaign naming conventions, and joining data sets to create a unified view. This ensures the data in your dashboard is accurate and trustworthy.
Step 4: Choose a Visualization Tool (Looker Studio, Tableau, etc.)
Once you have clean, centralized data, you need a tool to visualize it.
Popular business intelligence (BI) tools include Looker, Tableau, Power BI, and more. The right tool depends on your team's technical skills, budget, and specific feature requirements.
Step 5: Design Dashboards for Different Stakeholders (Exec vs. Manager)
Not everyone needs to see the same level of detail.
Your CMO needs a high-level executive dashboard showing overall ROI and channel performance.
Your paid media manager needs a granular, tactical dashboard for daily campaign optimization.
Tailor your visualizations to the specific needs of the audience to make the data as actionable as possible.
Comparison: Native Pinterest Analytics vs. Improvado Dashboard
Understanding the difference between the basic, built-in tool and a dedicated marketing analytics platform is key. This table highlights the major advantages of using a centralized solution like Improvado.
| Feature | Native Pinterest Ads Dashboard | Centralized Dashboard (via Improvado) |
|---|---|---|
| Data Sources | Pinterest Ads only | Pinterest Ads + 1,000+ marketing platforms (Google, Facebook, etc.) |
| Data Freshness | Near real-time, but only for Pinterest data | Automated, scheduled refreshes for all connected data sources |
| Cross-Channel View | Not available | Core feature; compare all channels side-by-side |
| Customization | Limited to pre-defined metrics and layouts | Fully customizable reports and visualizations in any BI tool |
| Attribution Modeling | Limited, last-touch attribution within Pinterest | Advanced, multi-touch attribution models across all channels |
| Data Transformation | None; data is presented as-is | Automated data cleaning, mapping, and standardization |
| Scalability | Difficult to manage with many campaigns or channels | Designed to scale with your business and data volume |
| Support | Standard platform support | Dedicated data experts and engineering support |
Optimizing Pinterest Ads Performance Using Dashboard Insights
A dashboard's ultimate purpose is to drive action. Here’s how to use the insights from your unified dashboard to actively improve your Pinterest ad campaigns.
Identifying High-Performing vs. Underperforming Creatives
Sort your ads by your primary KPI (like ROAS or CPA). Immediately, you'll see your winners and losers. Pause the underperforming ads and reallocate that budget to the top performers to instantly improve your overall campaign efficiency.
Adjusting Bids and Budgets Based on Real-Time ROAS
Your dashboard should show you which campaigns and ad groups are delivering the highest return. If a campaign has a high ROAS but is limited by its budget, consider increasing the spend.
Conversely, if a campaign is spending heavily with a low ROAS, it may be time to reduce its budget or adjust its strategy.
Refining Audience Targeting for Lower CPA
Analyze your audience performance data. You might discover that a specific age group or interest category is converting at a much lower CPA than others.
Use these insights to refine your targeting, focusing your budget on the most profitable segments and excluding those that are not performing well.
A/B Testing Pins, Headlines, and CTAs Effectively
Use your dashboard to rigorously measure the results of your A/B tests. Set up tests for different images, video lengths, headlines, or calls-to-action. A clear dashboard will show you a statistically significant winner, allowing you to iterate and improve your creative performance continuously.
Pinterest Dashboard Use Cases for Different Teams
A well-designed analytics setup serves multiple functions across the organization. Different teams will use the Pinterest Ads dashboard to answer different questions.
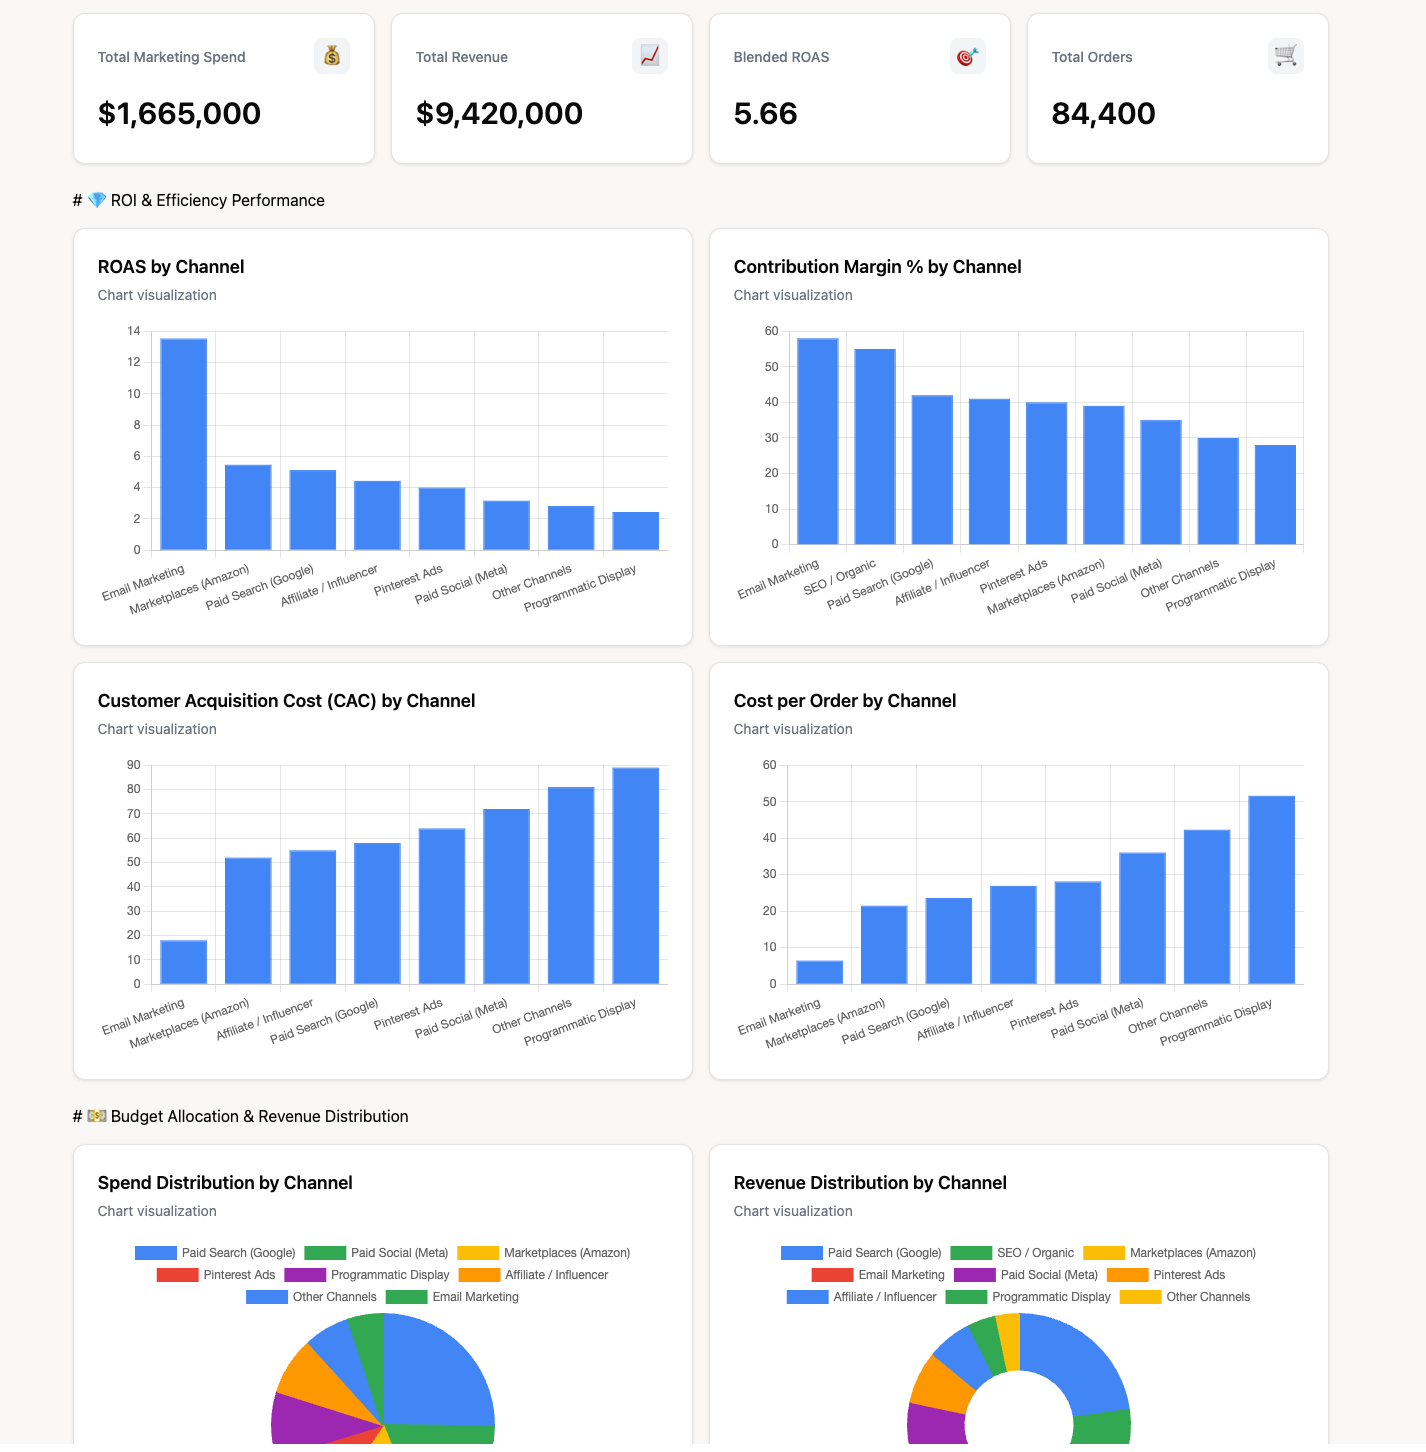
For Marketing Leadership: High-Level ROI and Budget Allocation
The CMO and VPs of Marketing need a 30,000-foot view. They use marketing analytics dashboards to track overall marketing ROI, channel mix performance, and progress toward quarterly business goals. The Pinterest data is seen in the context of the entire marketing budget.
Here’s an example of a cross-channel performance view.
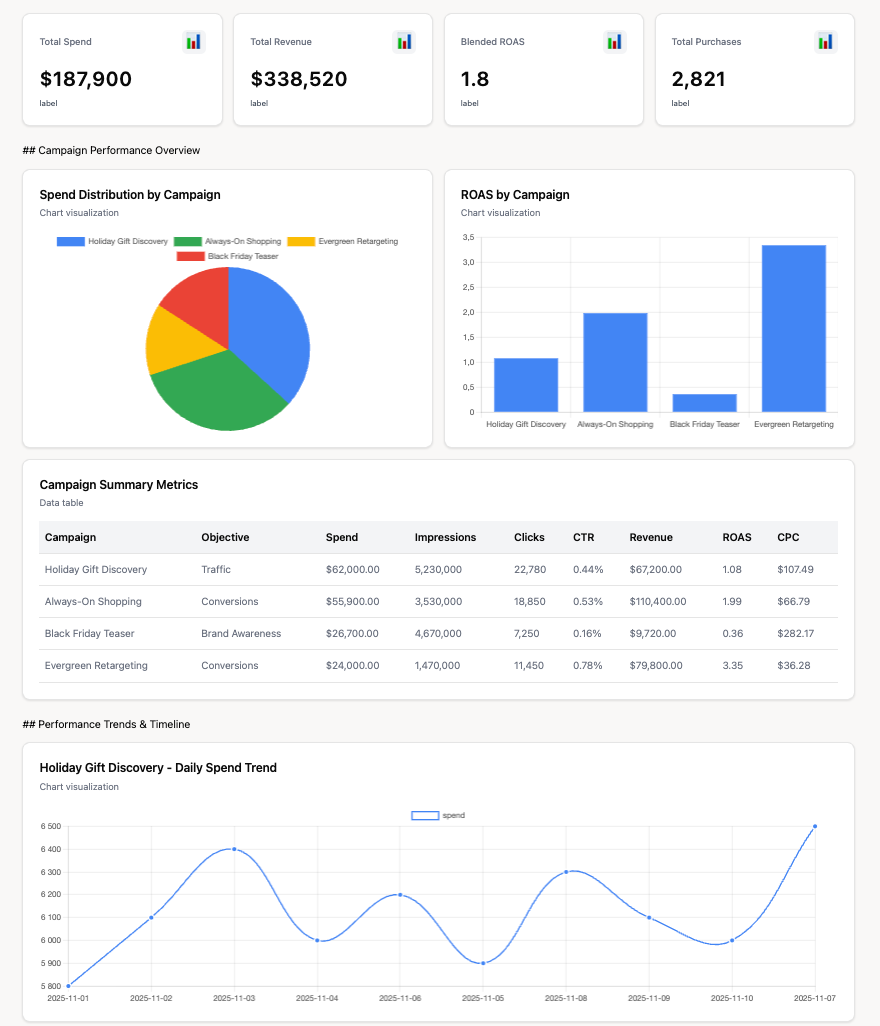
For Paid Media Managers: Granular Campaign Optimization
Paid media specialists live in the weeds of the data. They need detailed, tactical dashboards to monitor daily performance, pace budgets, troubleshoot issues, and make micro-optimizations to bids, creative, and targeting.
For Agencies: Client Reporting and Performance Proof
Agencies rely on dashboards to demonstrate value to their clients. They use shared KPI dashboards to provide transparent, real-time reporting on campaign performance, proving the effectiveness of their strategies and building client trust.
For Content Teams: Informing Organic Content Strategy
The insights from paid Pinterest campaigns are a goldmine for organic content teams. By seeing which topics, visuals, and formats perform best in paid ads, the content team can create more effective organic Pins, blog posts, and other assets, creating a powerful synergy between paid and organic efforts. This is a crucial component of modern social media analytics.
Conclusion
Pinterest Ads offer strong discovery and demand-generation potential. As campaigns scale, it becomes difficult to understand performance in context, compare Pinterest against other channels, or connect spend to downstream outcomes. A centralized Pinterest Ads dashboard solves this by bringing structure, consistency, and cross-channel visibility to your reporting.
Improvado supports this by providing the data foundation behind reliable Pinterest Ads dashboards. It aggregates Pinterest Ads data alongside other paid, analytics, and revenue sources, then cleans, standardizes, and governs it before delivery to dashboards or BI tools. This ensures accurate metrics, automated refreshes, and a single source of truth for analysis across teams and channels.
If you want a Pinterest Ads dashboard built on clean, unified data, request a demo of Improvado.

Related reading: Amazon Ads Dashboard: Track, Optimize & Master Campaigns (2026), LinkedIn Ads Dashboard: Track KPIs & Campaign Performance, How to Get Views on Pinterest 2026: Boost Blog Traffic | Improvado, TikTok Ads Dashboard Guide: Metrics, Setup & Tools (2026), Twitter Ads Dashboard Guide 2026 | Custom Reporting Templates