Whether you’re operating inside an agency or an in-house marketing team, your objectives, channels, and execution models can vary widely from one project to the next. But one responsibility remains universal across all marketing functions: producing accurate, timely reporting.
Data collection, normalization, visualization, and performance interpretation consume a significant share of a marketer’s workload. Modern marketing reporting tools streamline this process by automating the most time-intensive steps. They reduce manual effort, improving data reliability, and saving organizations up to 80% of the hours typically spent on analytics.
In this article, we break down the 10 best marketing reporting platforms and explore how each can enhance your team’s efficiency and decision-making.
Key Takeaways:
- When choosing a tool, prioritize data connectors, customization, scalability, and your team's technical skill level.
- Enterprise-level tools like Improvado offer advanced data transformation and governance, while tools like Databox and Klipfolio are great for simple KPI dashboards.
- AgencyAnalytics is an example of a platform that is built specifically for marketing agencies and freelancers but the platform provides limited capabilities for large-scale agencies.
What Are Marketing Reporting Tools?
Marketing reporting tools are platforms that collect, consolidate, and visualize performance data from multiple marketing channels. They automate the process of pulling metrics from ad platforms, analytics tools, and CRM systems, transforming raw data into dashboards, reports, and insights.
These tools help teams track KPIs, identify trends, compare channel effectiveness, and make data-driven decisions without relying on manual spreadsheets or fragmented platform-specific views.
Reporting vs. Analytics vs. Business Intelligence (BI)
These terms are often used interchangeably, but they have distinct meanings.
- Reporting focuses on organizing and summarizing data to show what happened. It answers questions like "How many leads did we generate last month?"
- Analytics digs deeper to understand why something happened. It answers questions like "Which channel drove the highest quality leads?"
- Business intelligence (BI) combines data from across the entire organization (marketing, sales, finance) to provide a holistic view for strategic decision-making.
Modern marketing reporting software often blends these functions. They provide automated reports while also offering analytics capabilities to help you understand performance drivers.
Why Marketing Reporting Tools are Essential for Growth
As marketing organizations scale, the volume and complexity of their data quickly outpace what individual platforms or manual workflows can support. Automation becomes an inevitable next step.
Reporting tools establish a consistent analytical foundation – one that informs decisions across the entire customer journey rather than relying on isolated metrics.
Teams that adopt these systems move faster, optimize with greater precision, and allocate budgets based on verifiable impact instead of assumptions.
Save Time and Reduce Manual Errors
Marketing reporting software eliminates the repetitive, error-prone tasks of exporting data, cleaning spreadsheets, and stitching together metrics from different platforms. By automating data collection and standardization, these tools free teams from operational work and reduce the risk of misreporting caused by manual handling.
The result is faster analysis, cleaner datasets, and more reliable insights that teams can act on with confidence.
Gain a Unified View of Cross-Channel Performance
Many marketing organizations operate across multiple regions, brand lines, and business units, each running their own campaigns and managing their own data sources.
A modern digital reporting platform unifies all of these signals into one consolidated view. Instead of toggling between accounts or reconciling regional reports, teams can analyze performance across channels, markets, and product lines in a single framework.
This unified perspective enables more accurate comparisons, clearer trend identification, and smarter budget allocation across the entire organization.
Enhance Client Communication (For Agencies)
For marketing agencies, clear and professional reporting is vital. A marketing agency reporting tool with white-labeling features allows you to create branded, interactive dashboards for your clients.
This transparency builds trust and clearly demonstrates the value you provide. Clients can log in anytime to see their results, reducing back-and-forth emails.
Prove Marketing ROI and Secure Budget
Every marketing leader needs to answer the question: "What was the return on our investment?"
To do this, reporting platforms connect media spend with downstream signals from your CRM and revenue systems. This allows you to link campaigns not just to clicks or leads, but to qualified pipeline, closed-won revenue, and customer value.
With these data streams unified under a consistent attribution and transformation model, you can quantify true ROI and distinguish incremental impact from noise.
This level of clarity enables more confident budget decisions, strengthens marketing’s position in financial planning, and provides the evidence needed to secure future investment.
Key Features to Look for in Marketing Reporting Software
The market is filled with options. Choosing the right one depends on your specific needs. Here are the core features to evaluate when comparing platforms:
- Data integration capabilities: A strong reporting platform should integrate seamlessly with your entire marketing ecosystem. Look for hundreds of pre-built connectors across ad platforms, analytics tools, CRMs, and revenue systems, as well as support for custom API sources and file-based ingestion.
- Data transformation: Raw platform data is inconsistent by default. The tool must automate ETL processes to reconcile naming differences, align metric definitions, and standardize fields like cost, conversions, and attribution windows, ensuring accuracy and comparability across channels.
- Customizable visualizations: The platform should offer flexible dashboard builders with configurable charts, tables, and calculated metrics. This allows teams to tailor reporting structures to specific KPIs, funnel stages, audiences, or business units without relying on engineering resources.
- Automated reporting and scheduling: Automated delivery of reports via email, Slack, or BI tools reduces manual effort and ensures stakeholders receive timely updates. The ability to schedule daily, weekly, or monthly refreshes helps keep cross-functional teams aligned.
- White-labeling: For agencies and distributed teams, white-labeling creates a seamless client experience. Look for customizable domains, branding, and visual themes that allow you to present insights under your own identity.
- AI-powered insights: Modern reporting platforms should do more than visualize data. AI-driven insights highlight trends, performance drivers, and optimization opportunities. Continuous anomaly detection flags sudden metric deviations, such as cost spikes or conversion drops, so teams can act before performance declines.
Comparison of the Top 10 Marketing Reporting Tools for 2026
We've analyzed the market to bring you a detailed breakdown of the best solutions. This comparison covers tools for every need, from simple dashboards for small businesses to enterprise-grade data platforms.
| Tool | Best For | Integrations | Data Transformation | AI Features | White-Label | Pricing Model |
|---|---|---|---|---|---|---|
| Improvado | End-to-end reporting for enterprise companies and agencies | 500+ | Advanced (ETL), AI-powered, no-code | AI Agent for report generation, anomaly detection | Yes | Custom |
| Looker Studio | Free basic reporting | 800+ | Basic (Formulas) | Limited | No | Free |
| Whatagraph | Small to mid-sized agencies | 40+ | Basic | No | Yes | Tiered (from $199/mo) |
| AgencyAnalytics | Agencies, freelancers | 70+ | Basic | No | Yes | Tiered (from $12/user/mo) |
| Databox | SMBs | 70+ | Basic | Yes (Insights) | Yes | Tiered (from $72/mo) |
| Klipfolio | Small to mid-sized agencies and orgs | 100+ | Moderate (Formulas) | No | Yes | Tiered (from $99/mo) |
| DashThis | Quick and easy reporting | 35+ | Basic | No | Yes | Tiered (from $45/mo) |
| Supermetrics | Data extraction to Sheets / BI | 100+ | Limited | No | No | By Destination |
| Funnel.io | Small to mid-sized companies | 500+ | Advanced | No | No | Tiered (from $399/mo) |
| TapClicks | Agency operations | 250+ | Moderate | Yes | Yes | Custom |
1. Improvado – Best for Enterprise & Data-Driven Teams
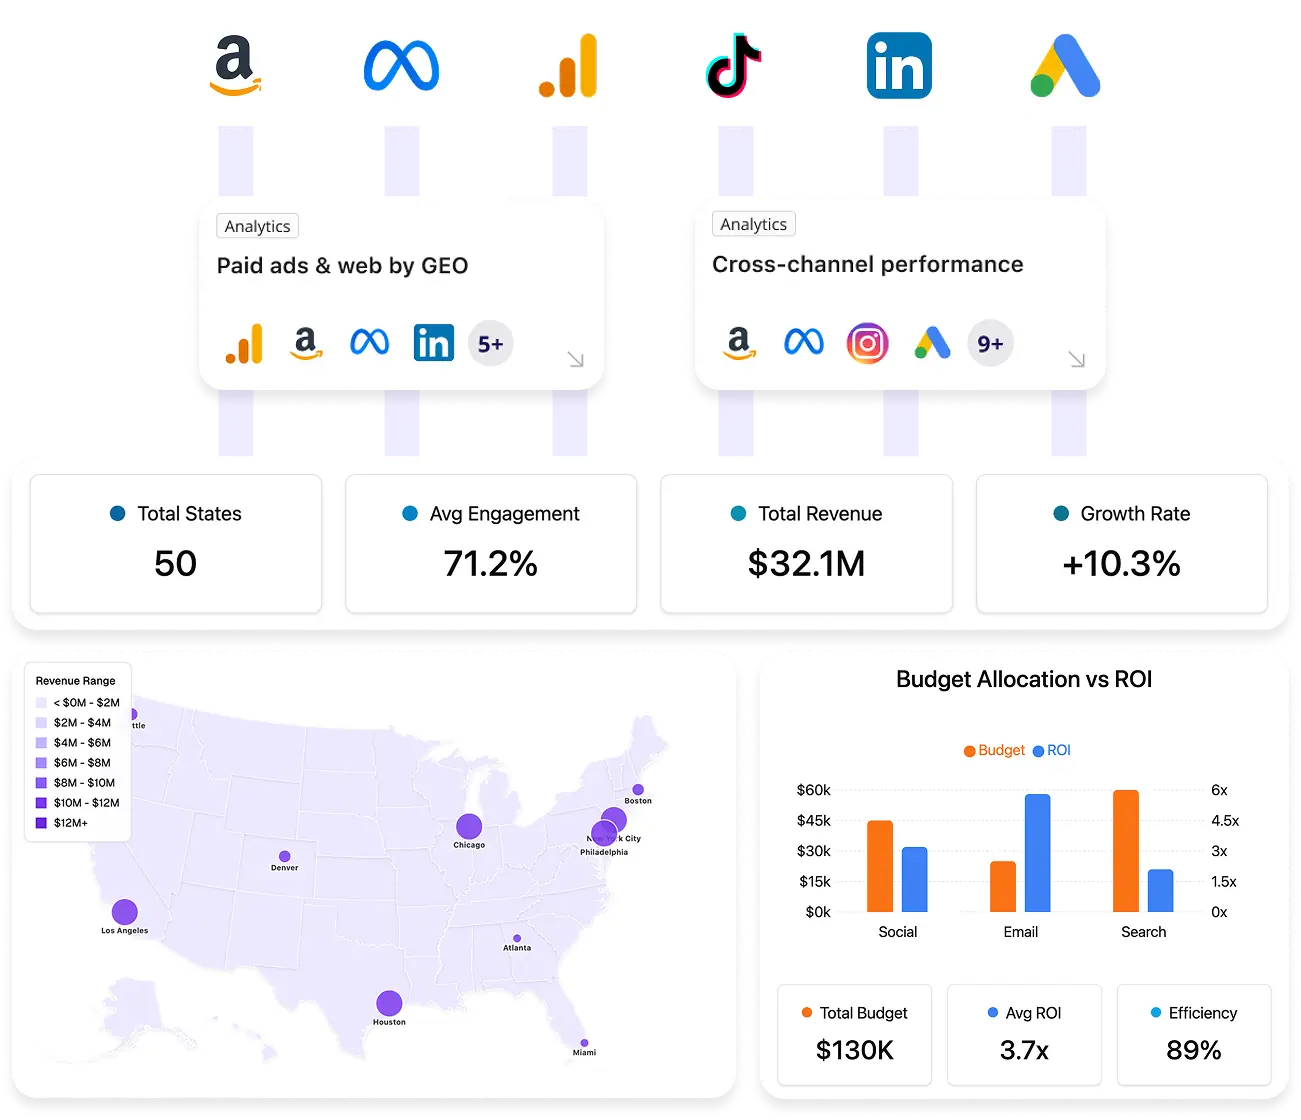
Improvado is one of the best marketing reporting software solutions designed for enterprise-grade companies and large-scale marketing agencies. It’s an end-to-end solution that assists at every stage of the marketing reporting cycle.
Key Features:
- Extensive Integrations: Connects to over 500 marketing and sales platforms, including offline and custom sources.
- Automated Data Transformation: Provides enterprise-grade ETL capabilities. It cleans, maps, and normalizes data from all sources, delivering an analysis-ready dataset.
- AI-Powered Analytics: Features an AI Agent that lets non-technical users ask data questions in plain English. Its Marketing Data Governance module monitors data quality and campaign compliance.
- Flexible Destination: Sends your cleaned data to any BI tool (like Tableau, Power BI), data warehouse (like BigQuery, Snowflake), or Improvado's own visualization platform.
- Data integration: Pulls data from 500+ marketing and sales platforms, including Linkedin Ads, Hubspot, Google Search Console, DV360, CRMs, and many others. It supports online, offline, and custom data sources.
- Data preparation: Improvado automatically applies data transformations, including deduplication, data cleansing, mapping, and unifying different naming conventions to prepare data for visualization and analysis.
- Data loading and storage: The platform loads clean data to a BI solution of your choice. It seamlessly connects with enterprise-grade storage solutions (Snowflake, BigQuery, and others) and provides data warehouse management services.
- Data visualization: Users can also utilize pre-built dashboards, like marketing attribution, advertising, or ecommerce templates to visualize data in a BI tool, or build a dashboard with AI Agent.
- Anomaly detection: The platform provides campaign monitoring, from pre-flight settings validation and in-flight metrics pacing and anomaly alerts to post-flight data checks and UTM validation.
- AI Agent: The agent is connected to your marketing database and enables users to ask data questions in everyday language, bypassing the need for complex SQL queries. AI Agent can perform analysis, build dashboards, send period-over-period reports, perform benchmarking, and provide recommendations.
Pros
- Unmatched scalability for large data volumes.
- Deep data granularity and customizability.
- No-code platform suitable for all skill levels.
- Dedicated support and professional services.
Cons
- May be overly complex for small businesses.
- Custom pricing requires a consultation.
Improvado Pricing
Improvado offers custom pricing plans based on data volume, number of data sources, and specific business needs.
All plans include access to all connectors and an unlimited number of accounts per source. Each package also includes customization credits to tailor the platform to specific business requirements.
2. Looker Studio (Formerly Google Data Studio) – Best Free Option
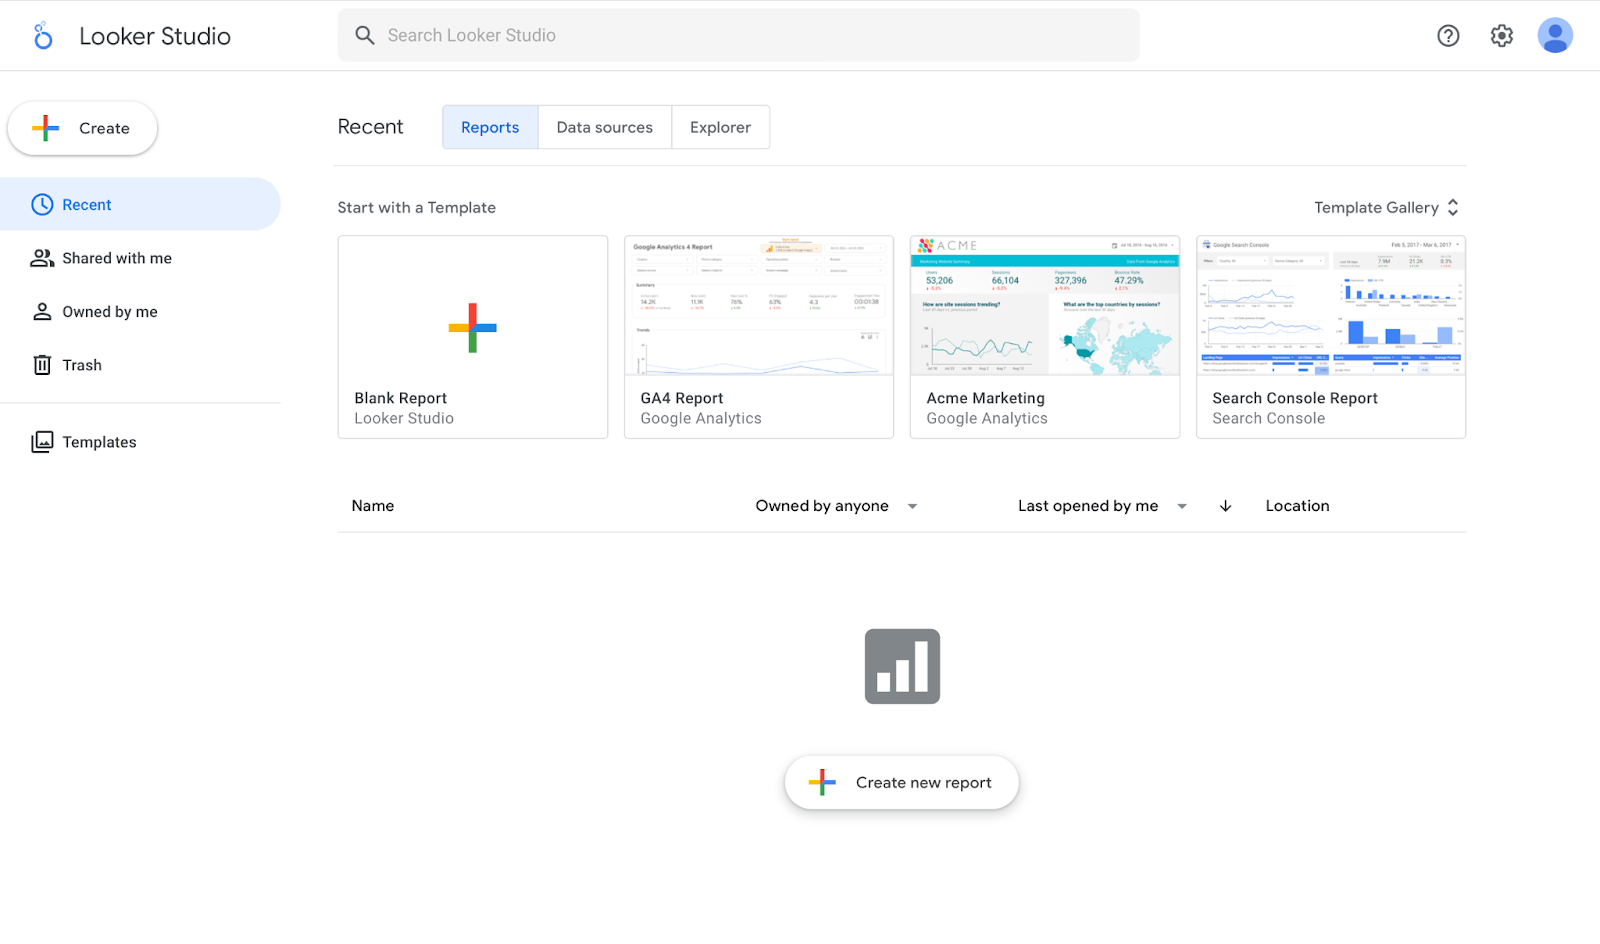
Looker Studio is a powerful and free tool for creating interactive dashboards. It integrates seamlessly with the Google ecosystem (Google Analytics, Google Ads, Search Console). It is an excellent starting point for businesses new to data visualization.
Key Features:
- Google ecosystem integration: Native connectors to all Google marketing and data products.
- Partner connectors: A large library of third-party connectors allows you to pull in data from non-Google sources.
- Customizable visuals: A flexible report editor with a wide range of charts, graphs, and design options.
Pros
- Completely free to use.
- Highly flexible and customizable.
- Strong community support and resources.
Cons
- Lacks automated data transformation; requires manual blending.
- Can be slow with large, complex datasets.
- No dedicated customer support.
Pricing:
Looker Studio is free. Some third-party data connectors may require a separate subscription fee.
3. Whatagraph – For Simple Agency Reporting
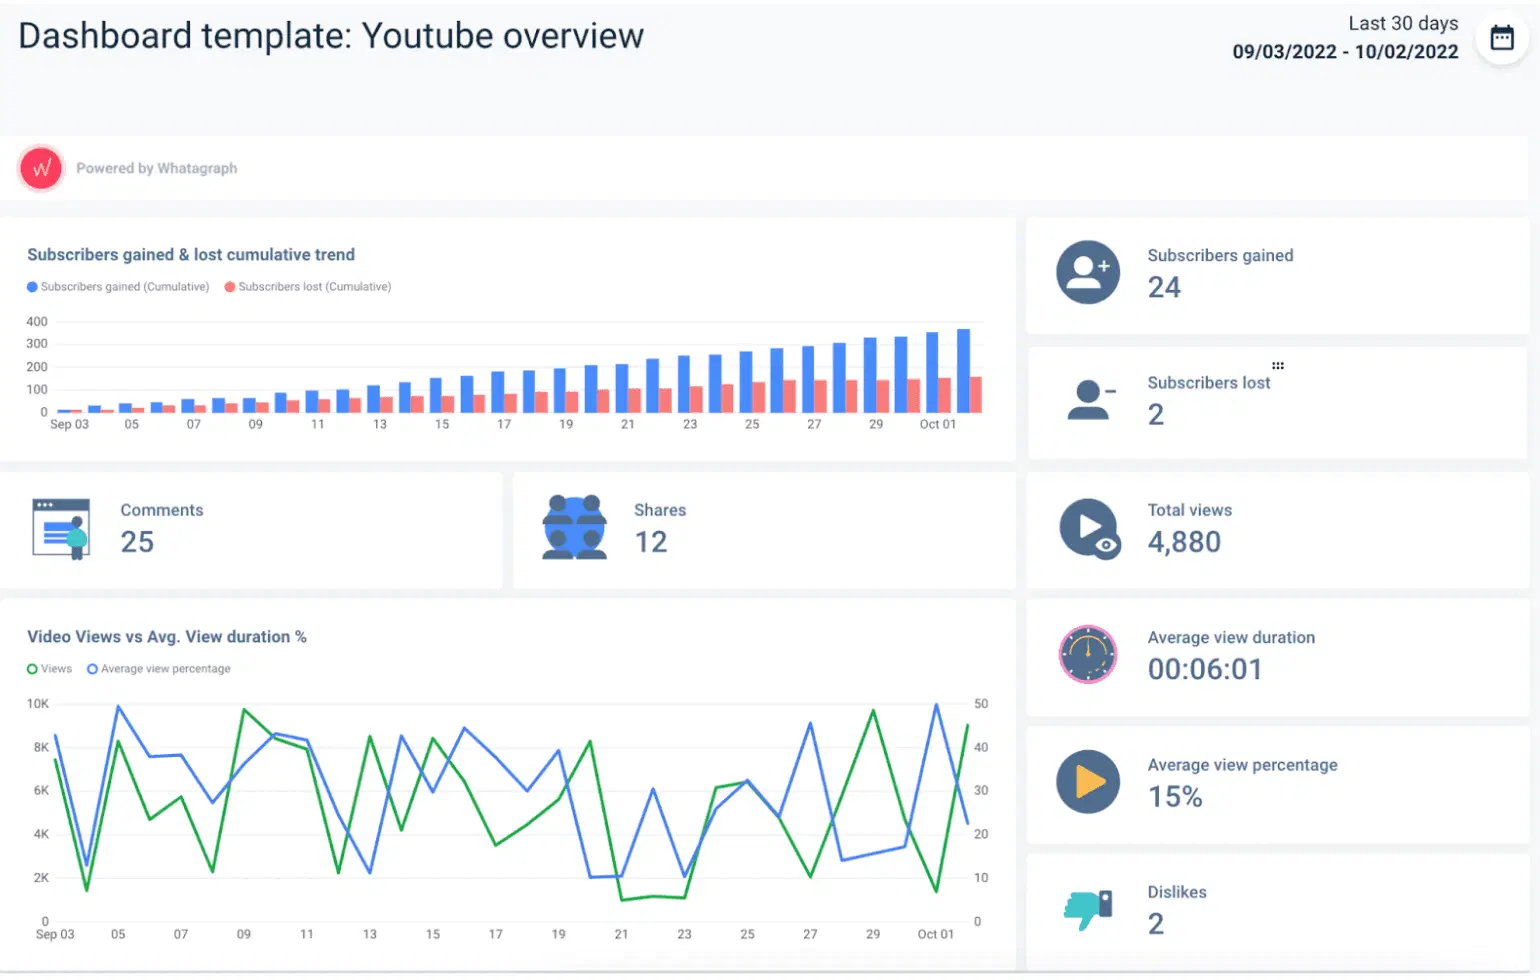
Whatagraph is another marketing-specific reporting platform. The tool automates key report generation processes, from data aggregation to visualization and sharing.
Whatagraph extracts data from 40 data sources, while the Whatagraph Public API allows users to import data from any external data source or website into their account. The tool offers 95 pre-designed report templates that cater to diverse use cases. A custom reporting dashboard can be built from scratch using drag-and-drop widgets. Custom metrics and formulas can be applied to enhance the accuracy and relevance of the reports.
Additionally, Whatagraph offers a white labeling option for marketing agencies seeking greater customization capabilities while sharing dashboards with clients. Agencies can personalize their reports with branding elements, such as logos, color schemes, and fonts.
Key Features:
- Template library: Offers over 95 pre-designed report templates to get you started quickly.
- White-Labeling: Extensive customization options let agencies brand reports with their logos and color schemes.
- Simple Interface: A user-friendly drag-and-drop builder makes report creation straightforward.
Pros
- Very easy to set up and use.
- Excellent report aesthetics.
- Good for client-facing reports.
Cons
- Limited number of native data integrations (40+).
- Basic data transformation capabilities.
- Can become expensive as you add data sources.
Whatagraph Pricing
Plans start at $299/month. A custom plan is available for larger needs.
4. AgencyAnalytics – All-in-One for Agencies
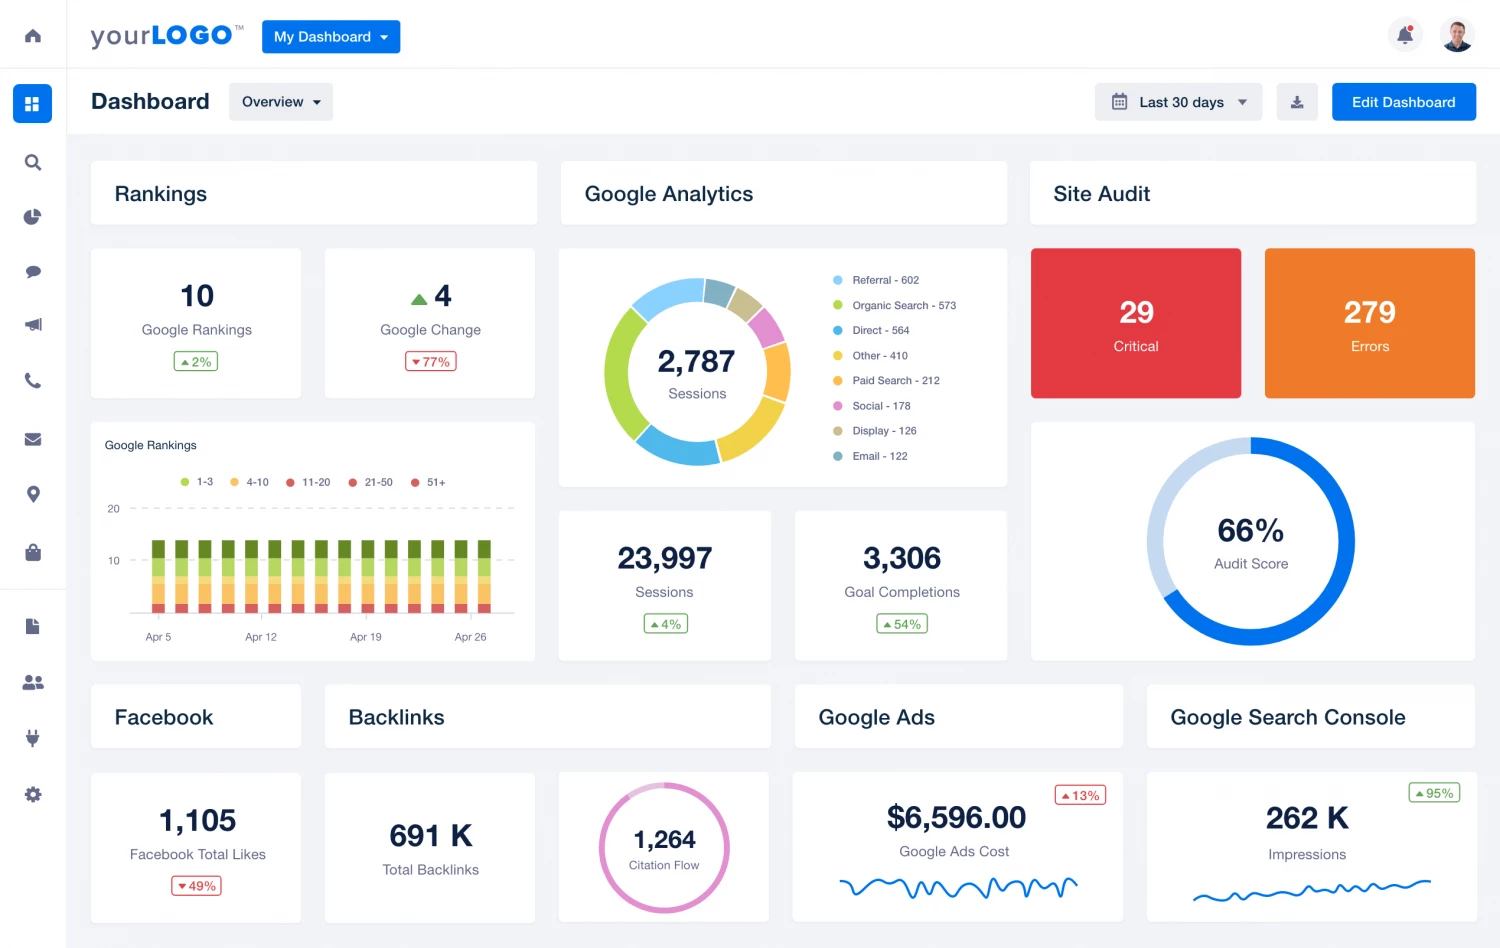
As the name suggests, AgencyAnalytics is built specifically for marketing agencies.
The platform supports integration with 70 marketing platforms, including Ahrefs, social media platforms, and others, enabling users to access their marketing data through a single dashboard.
However, despite a relatively small number of integrations, AgencyAnalytics does not provide an option for requesting custom integrations. Therefore, users may need to find workarounds when working with custom data.
AgencyAnalytics offers dozens of prebuilt dashboards and report templates, covering various aspects of marketing reporting, including PPC, social media, SEM, SEO, call tracking, email marketing, and more.
Users can also utilize a range of customizable widgets, custom metrics, and white labeling capabilities for enhanced client reporting.
Key Features:
- Agency-Centric Tools: Includes built-in SEO tools, project management integrations, and client messaging.
- Fully White-Labeled: Offers a custom domain, branded dashboards, and a client login portal.
- Automated Reports: Easily schedule and send customized reports to clients.
Pros
- Combines reporting with useful agency tools.
- Affordable, user-based pricing.
- Excellent white-labeling features.
Cons
- Limited integrations (70+) compared to data platforms.
- No option for custom integration requests.
- Basic data blending capabilities.
AgencyAnalytics Pricing
The Freelancer plan starts at $59 per month per client kit. The Agency plan starts from $179 a month.
5. Databox – For KPI Dashboards
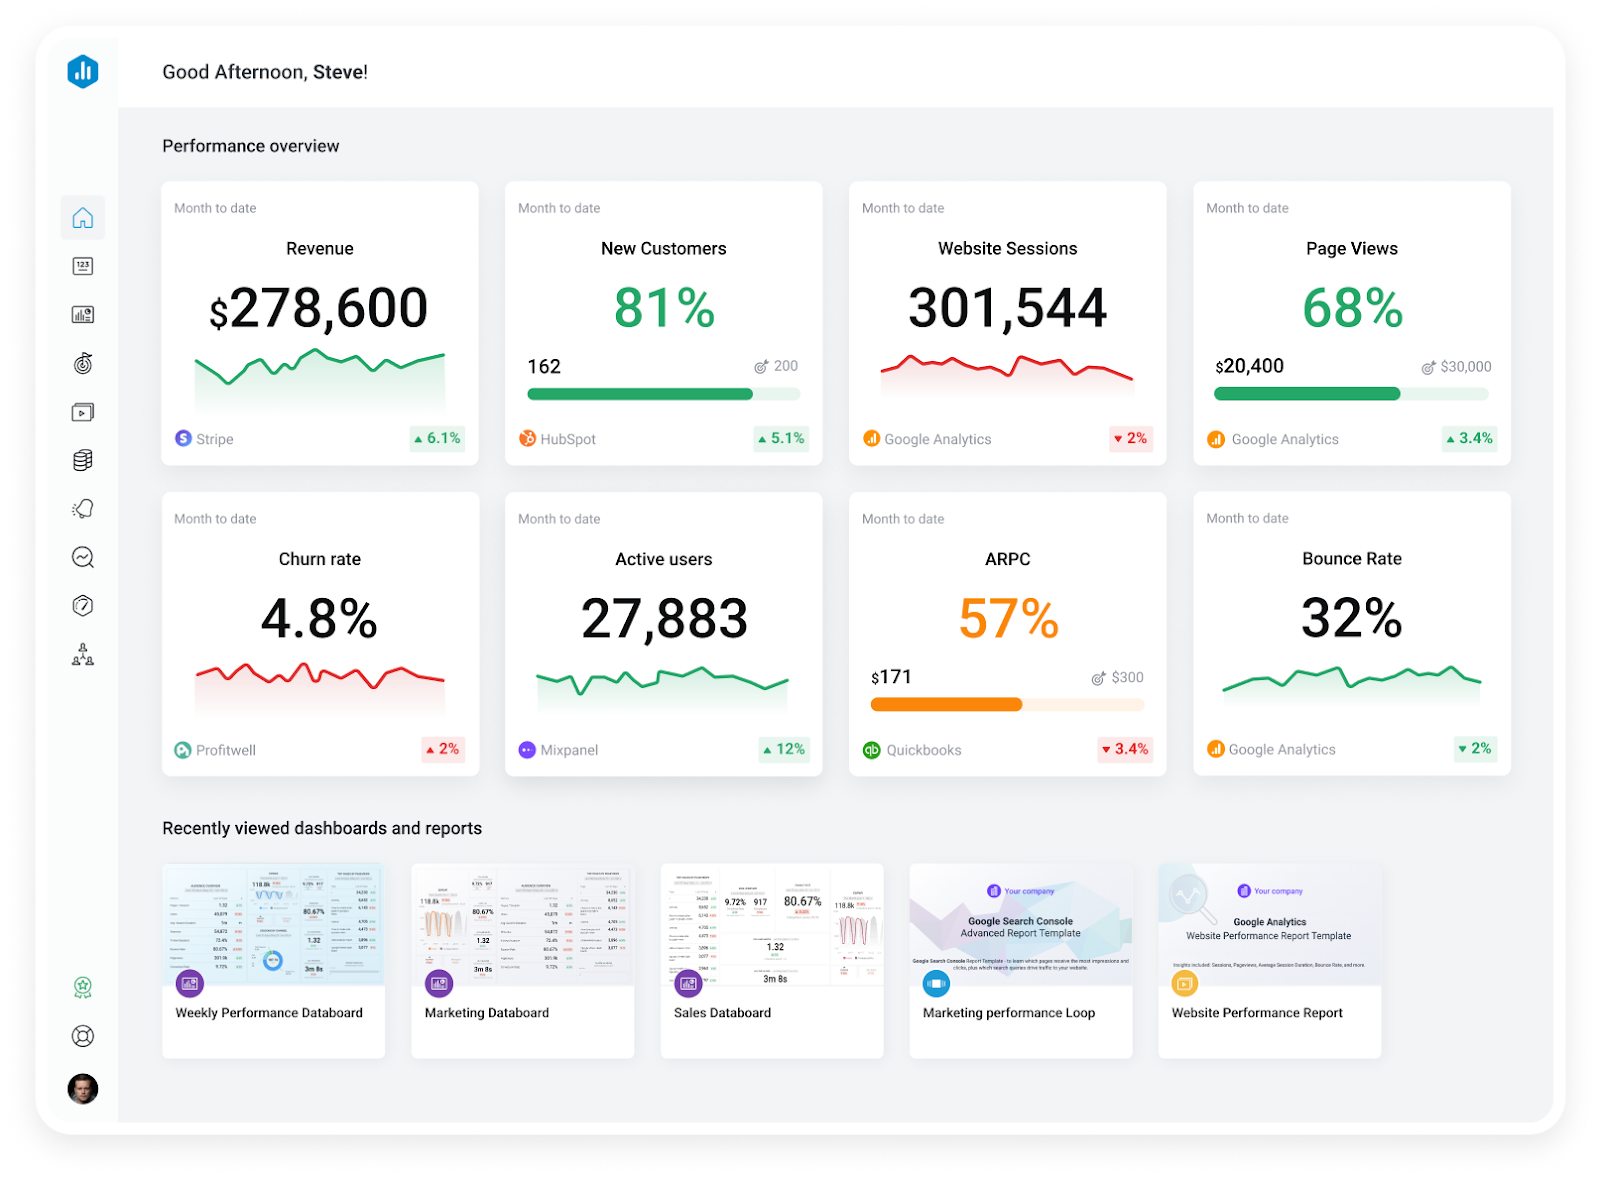
Databox is a business analytics and dashboarding platform that helps teams monitor performance metrics from multiple sources in one place. It focuses on simplifying KPI tracking and visualization for businesses that want quick, lightweight reporting without the need for extensive technical resources.
The platform connects directly to over 100 popular marketing, sales, and analytics tools, pulling data into customizable dashboards that update automatically.
Databox also has iOS and Android apps that users can utilize for accessing insights anywhere.
Key Features:
- Goal tracking: Easily set and visualize progress toward your marketing goals.
- Mobile app: Access your key metrics anytime, anywhere, on iOS and Android.
- Template gallery: Over 200 pre-built report templates to get started quickly.
Pros
- Excellent for tracking KPIs and goals.
- Intuitive and easy-to-use interface.
- Generous free plan to get started.
Cons
- Limited data transformation and customization. Custom metric builder is limited to certain integrations.
- Lacks support for custom connectors and advanced APIs.
- Offers limited segmentation and shrill-downs, suitable for more surface-level KPI monitoring.
- Can get pricey as your needs grow.
Databox Pricing
Plans start at $159 a month billed annually.
6. Klipfolio – For Custom Visualizations
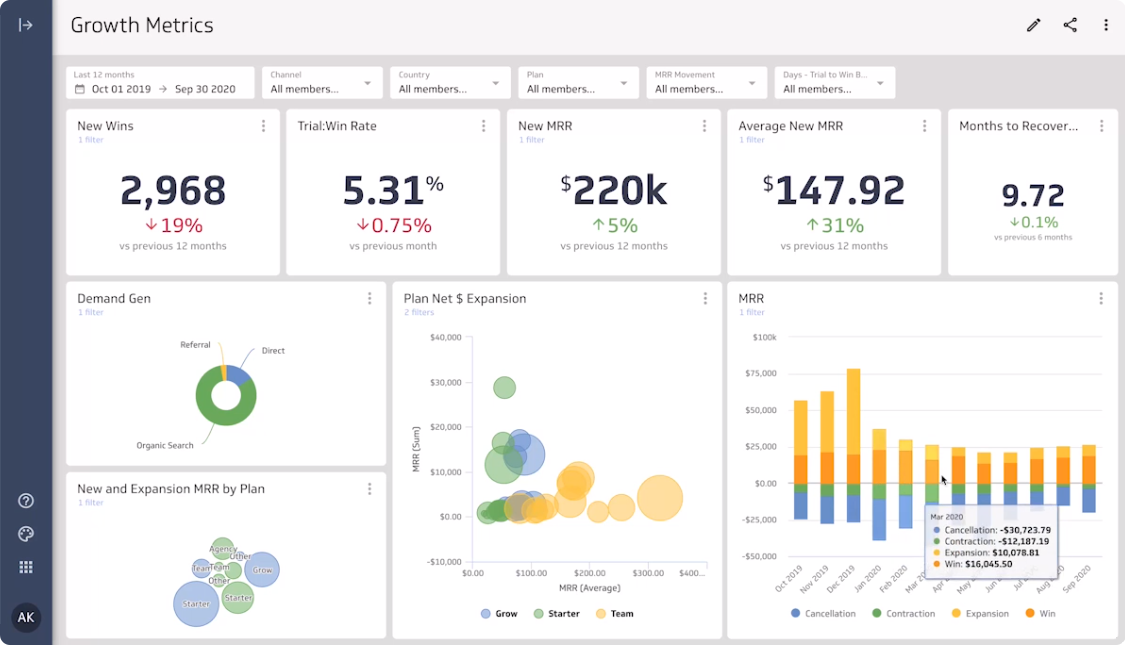
Klipfolio a low-code marketing reporting and analytics tool focused on dashboard reporting. It is better suited to smaller teams or organizations without complex governance or AI-driven analytics needs.
It is a cloud-based business dashboard and reporting platform that focuses on flexibility, enabling users to build custom dashboards and reports using a wide range of data connectors and visualization options.
Key Features:
- Powerful editor: Allows for complex formulas and data manipulations to create custom metrics.
- Flexible data sources: Connects to over 100 services, plus files, SQL databases, and REST APIs.
- Pre-built dashboards: Offers many pre-built visualizations and dashboard templates as a starting point.
Pros
- Highly customizable and flexible.
- Strong capabilities for data manipulation.
- Good for teams with technical expertise.
Cons
- Steep learning curve for non-technical users.
- User interface can feel dated.
- No custom connector requests.
Klipfolio Pricing
Klipfolio offers tiered plans starting at $90 per month for the Base plan with unlimited users, 3 dashboards, 130 integrations, and data refresh every 4 hours.
7. DashThis – For Quick and Easy Setup
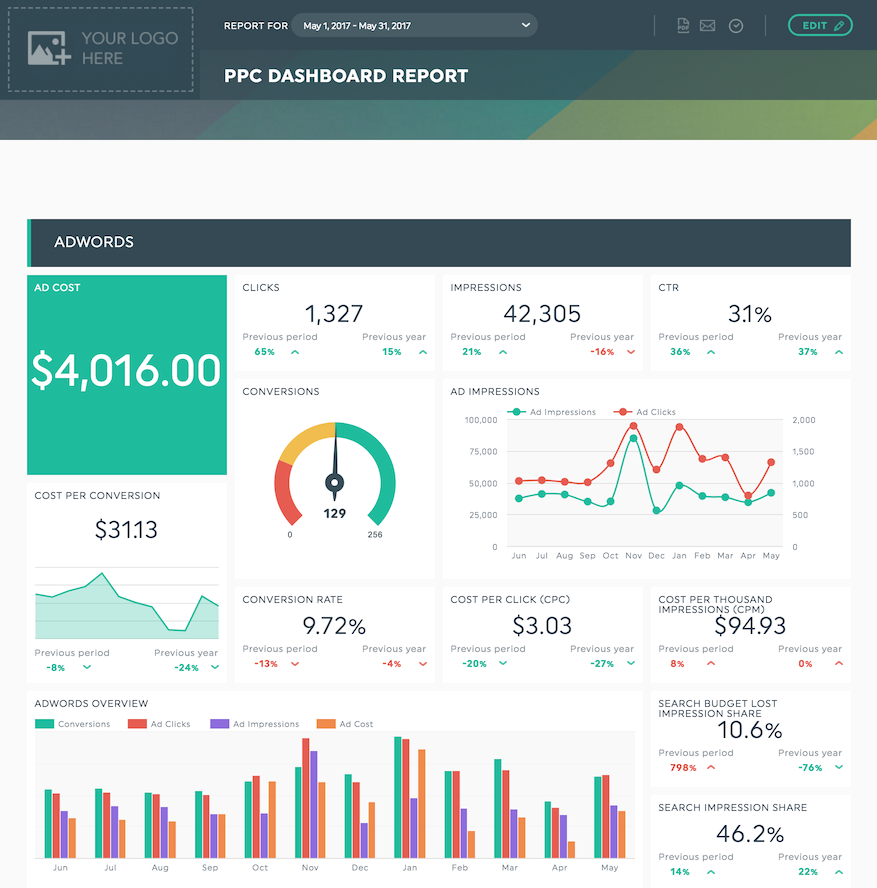
DashThis is a marketing reporting software that helps create functional, flexible, and effective dashboards.
The platform integrates with over 34 marketing channels, including popular marketing platforms like Google Analytics, Semrush, Google Ads, Facebook Ads, and more. Users can also utilize the Google Sheets integration to connect custom data to their dashboards, or import data using the platform's CSV file tool. However, it's worth noting that some customers have reported inconsistent data quality due to pushing data through flat-file integration.
DashThis-built dashboards are flexible and support the combination of metrics from multiple platforms for cross-channel analytics. In addition, users can access report and widget templates and take advantage of cloning options for quick report generation.
Key Features:
- Preset widgets: A large library of pre-configured widgets makes building dashboards fast.
- Report templates: Includes templates for common needs like PPC, SEO, and social media reporting.
- Unlimited users: All paid plans include unlimited users, making it great for collaboration.
Pros
- Extremely easy and fast to set up.
- Great customer support.
- Good value for the price.
Cons
- Lacks features like anomaly detection, predictive analytics, or smart recommendations.
- Very limited number of integrations.
- User reviews also mention issues with inaccurate data, poor filtering capabilities, and the inability to switch between data sources quickly.
- Less customization than other tools.
- Basic data processing features.
DashThis Pricing
DashThis pricing is structured around the number of dashboards you need, an approach tailored for agencies or teams creating reports per client or campaign. Prices scale with dashboards, starting at around $49/month for 3 dashboards.
8. Supermetrics – Best for Data Extraction
Supermetrics is a leader in pulling marketing data out of platforms and into destinations like Google Sheets, Looker Studio, and BI tools. It is not a standalone visualization tool itself but rather a powerful data connector.
Key Features:
- Wide range of connectors: Connects to over 100 marketing platforms.
- Destination flexibility: Feeds data directly into the tools your team already uses.
- Reliable data pulls: Known for its reliability and ability to pull deep, granular data.
Pros
- The industry standard for data extraction.
- Empowers your existing reporting tools.
- Simple to set up and use.
Cons
- It's just a connector; you still need a separate transformation and visualization tool.
- Pricing is by destination, which can add up.
- No data warehousing or advanced transformation.
- The manual nature of data cleaning and the lack of robust governance make it difficult for large teams or agencies to scale their reporting operations.
Supermetrics Pricing
Pricing varies significantly based on the data destination and sources. For example, the Google Sheets connector starts around $99/month.
9. Funnel.io – For Data Collection and Transformation
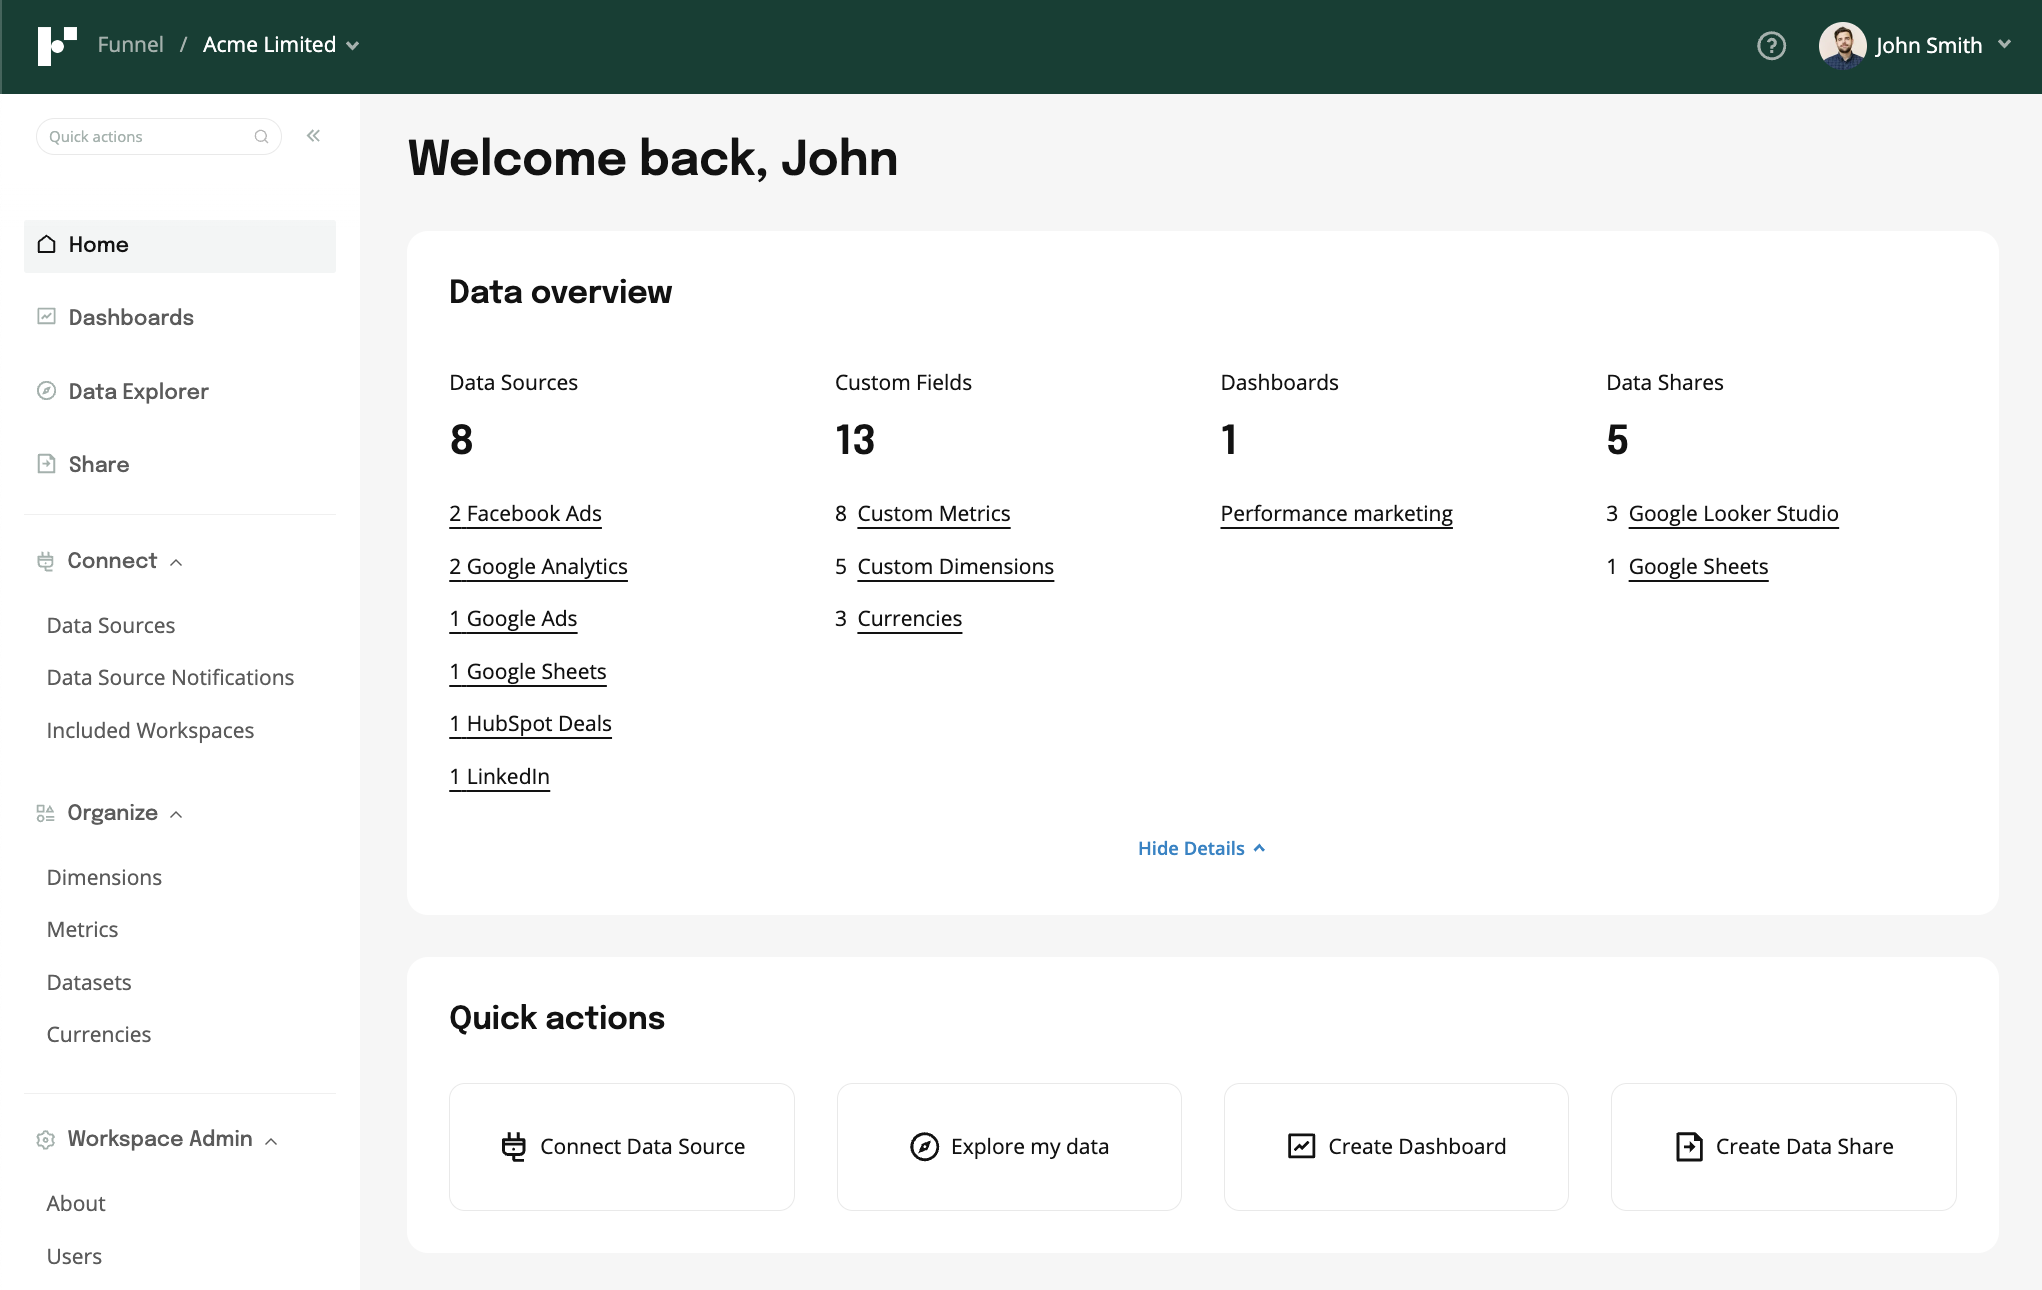
Funnel is a marketing intelligence platform designed to streamline the collection, preparation, and analysis of marketing data.
It focuses on collecting data from over 500 sources and transforming it into an analysis-ready state. It's designed to feed clean data into your BI tool or data warehouse.
Key Features:
- Massive connector library: Connects to virtually any marketing platform.
- Powerful data mapping: A user-friendly interface for grouping and classifying data from different channels.
- Data warehousing: Can store your harmonized data in its own managed data warehouse.
Pros
- Powerful at data collection and cleaning.
- Flexibility to send data anywhere.
- Handles complex data needs well.
Cons
- Despite a high number of data sources, Funnel provides low data granularity (fewer metrics and dimensions per data source) than its competitors.
- Pricing can be high for smaller businesses.
- Less focus on AI and data governance.
Funnel.io Pricing
Funnel.io offers four main pricing plans tailored to different organizational needs: Free, Starter, Business, and Enterprise.
10. TapClicks – For Large Agency Operations
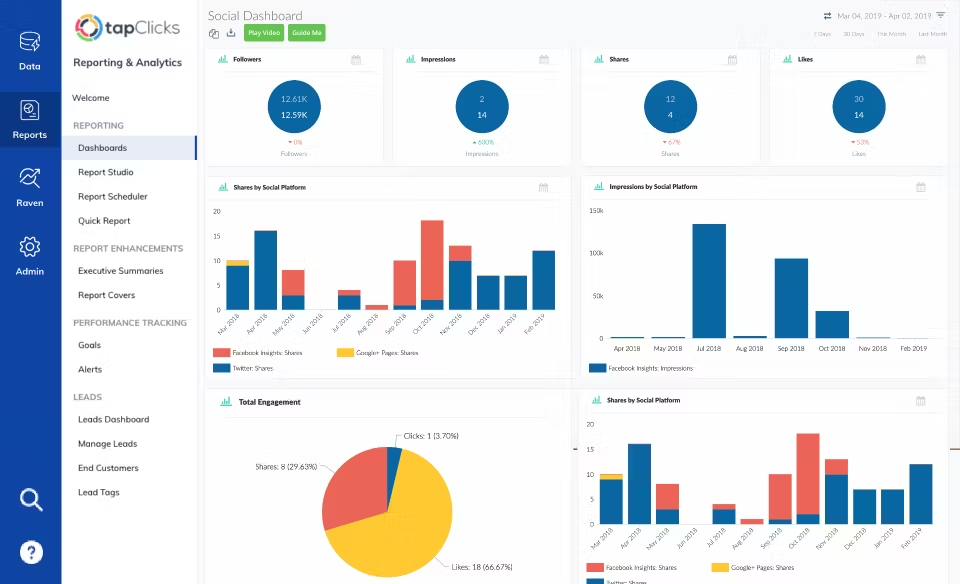
TapClicks is an all-in-one marketing operations platform that includes robust reporting. It is designed for large agencies and media companies that need to manage reporting, orders, and workflow in one place.
Key Features:
- Unified platform: Combines reporting with workflow management and order processing.
- SEO tool: Provides an all-in-one platform for site audits, rank tracking, link-building, and keyword research
- Strong connectors: Integrates with over 250 data sources.
- Scalable analytics: Designed to handle reporting for hundreds or thousands of clients.
Pros
- A complete solution for agency operations.
- Highly scalable for large client loads.
- Good set of integrations.
Cons
- Can be complex and expensive to implement.
- More than just reporting, which may be too much for some.
- Custom pricing requires a sales call.
TapClicks Pricing
The core of the TapClicks pricing model revolves around selecting a data package and then choosing a data destination. Each package includes support for up to 10 clients and unlimited users. After selecting a data package, users can choose their preferred data destination, such as TapReports, TapAnalytics, TapInsights, or a third-party destination.
How to Choose the Right Marketing Reporting Software
With so many options, selecting the perfect tool can feel daunting. Follow this simple, five-step process to make the right choice for your organization.
Step 1: Define Your Reporting Needs and Goals
Start by asking what you want to achieve. Do you need simple weekly PDF reports for clients? Or do you need complex, real-time dashboards for internal strategy? Are you trying to track high-level KPIs or dig into granular campaign data? Your goals will determine the level of sophistication you need.
Step 2: List Your Must-Have Data Sources
Create a comprehensive list of every platform in your marketing stack. This includes your ad platforms, analytics tools, CRM, email marketing software, and any other tools that hold important data. Your chosen reporting tool must have reliable connectors for all of them.
Step 3: Evaluate Your Team's Technical Skills
Be honest about your team's capabilities. Do you have data analysts who are comfortable with SQL and complex formulas? Or do you need a simple, no-code, drag-and-drop interface? Choosing a tool that matches your team's skill set is crucial for adoption and success. A powerful tool is useless if no one knows how to use it.
Step 4: Consider Your Budget and Scalability Needs
Reporting tools have a wide range of price points. Determine your budget upfront. More importantly, consider how the price might change as your business grows. Will the cost increase as you add more data sources, users, or data volume? Choose a platform that can scale with you.
Step 5: Request Demos and Run Trials
Never buy a tool based on its website alone. Shortlist your top 2-3 options and schedule a personalized demo with each. This lets you see the platform in action and ask specific questions. If a free trial is available, use it to connect a few data sources and build a test dashboard. This hands-on experience is the best way to determine if a tool is the right fit.
Conclusion
When you must develop, evaluate, and execute comprehensive marketing strategies, you deal with large volumes of data. You need a solution that can handle any data you need and present it in an easy-to-analyze format.
Improvado is an advanced marketing reporting software that aggregates your data, prepares it for analysis, and pushes it to your analytics, BI, or visualization tool of choice. Improvado's AI Agent provides quick access to insights through natural language.
Improvado provides a solution with a flat learning curve from which marketing teams of all sizes can benefit. Ultimately, the solution streamlines reporting and helps maximize the effectiveness of your sales and marketing efforts.
Get a demo today to learn more about Improvado and how it can improve your operations.
.png)


.png)
