
Marketers are in a toxic relationship with vanity metrics. They are seductive, easy to measure, and fantastic for a quick ego boost.
A viral post with 100,000 likes? A million page views this month? These numbers feel good. But as many leaders are discovering, feeling good doesn't equate to doing good for the business.
These metrics often obscure the truth, making it impossible to connect marketing efforts to the metrics that truly matter: revenue, customer lifetime value (LTV), and return on investment (ROI).
This obsession with surface-level data isn't just an internal problem. According to a study by Viant, 36% of CFOs cite the use of vanity metrics by CMOs as a top concern, reinforcing the perception of marketing as a cost center rather than a growth engine. When marketing can't prove its value in dollars and cents, budgets get cut and credibility erodes.
This guide is your intervention. We will provide a definitive breakdown of what vanity metrics are, how to spot them in your own reports, and most importantly, what actionable metrics to track instead to make smarter, data-driven decisions that command respect in the boardroom.
Key Takeaways:
- Definition: Vanity metrics are data points that look impressive on the surface but lack a direct correlation to business objectives like revenue or customer acquisition. They tell you what happened, but not why or what to do next.
- The Danger of Misleading Data: Relying on vanity metrics leads to poor strategic decisions, wasted marketing budgets, misaligned teams, and an inability to prove marketing's ROI to leadership.
- Actionable vs. Vanity: The key difference is context and connection to business goals. Actionable metrics are tied to specific objectives, are repeatable, and inform strategic decisions (e.g., Conversion Rate), while vanity metrics are often superficial (e.g., Page Views).
- The Solution is Deeper Analysis: Moving beyond vanity requires connecting marketing data to business outcomes. This involves tracking metrics like Customer Acquisition Cost (CAC), Lifetime Value (LTV), and conversion rates through the entire funnel, not just top-of-funnel engagement.
Quick answer
Vanity metrics are data points that look impressive on the surface but lack a direct correlation to business objectives like revenue or customer acquisition. Coined by Eric Ries in The Lean Startup, they measure activity rather than results, are easily manipulated, lack context, and fail to inform strategic decisions or prove marketing ROI.
What Are Vanity Metrics?
A vanity metric is a data point that is easily manipulated and appears impressive on a superficial level, but fails to provide meaningful insight into business performance or inform future strategy.
Coined by Eric Ries in "The Lean Startup," the term highlights metrics that are more about stroking egos than driving intelligent action. They make us feel good but don't help us make better decisions.
For example, a blog post might get 50,000 page views. This sounds fantastic. But if none of those viewers sign up for a newsletter, request a demo, or purchase a product, what was the actual business value of that traffic?
In this context, page views are a vanity metric. They measure activity, not results.
The Core Characteristics of a Vanity Metric
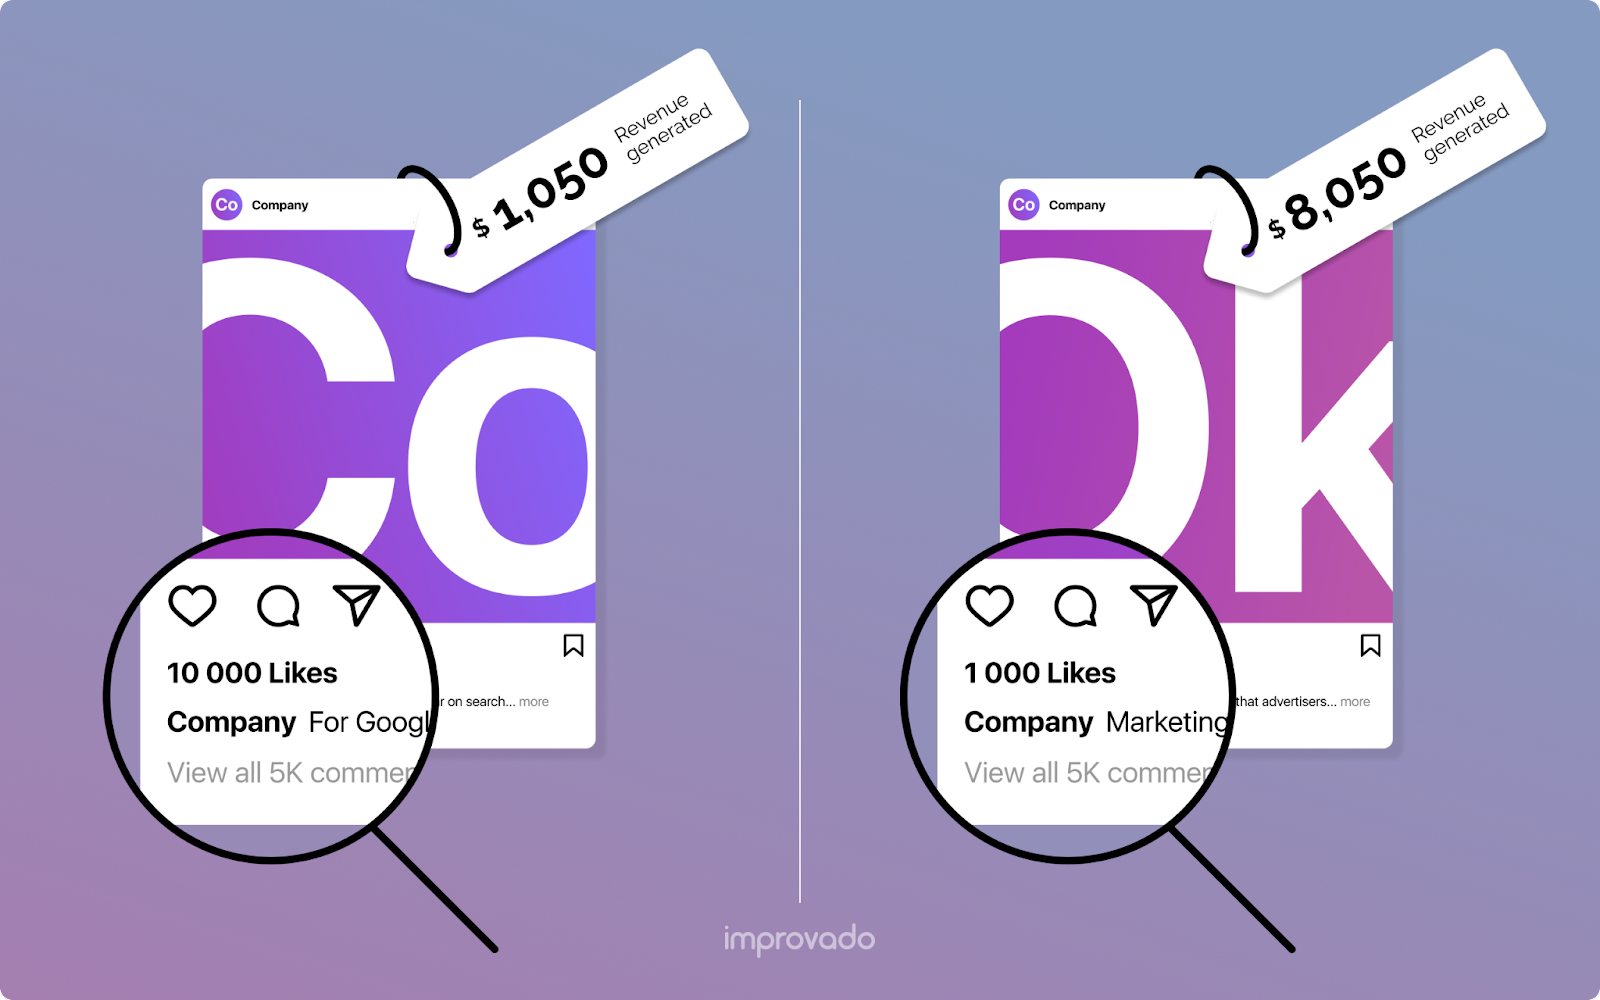
- Lacks Context: A vanity metric presented in isolation is almost always misleading. 10,000 new followers means nothing without knowing the engagement rate or how many convert into customers.
- Not Tied to Revenue: The most significant red flag is the inability to connect the metric back to a core business objective, such as revenue, profit, or market share.
- Easily Manipulated: You can almost always increase a vanity metric by simply spending more money. More ad spend will generate more impressions, but not necessarily more qualified leads or sales.
- Doesn't Inform Action: A good metric should help you answer the question, "What should we do next?" If a metric goes up or down and your strategic response is still a shrug, it's likely a vanity metric.
The Dangers of Relying on Vanity Metrics
Chasing vanity metrics is a dangerous practice that can derail your entire marketing strategy and damage your credibility within the organization. The ripple effects of reporting on the wrong KPIs can be felt across teams, budgets, and long-term business goals.
Wasted Time and Resources
When your team optimizes for the wrong goals, they waste precious time, energy, and budget.
A team focused on maximizing social media likes might spend weeks creating content that gets high engagement from a non-buying audience, while a competitor focused on conversion rates is quietly capturing market share.
Every dollar spent chasing a vanity goal is a dollar not spent on acquiring a valuable customer.
Poor Strategic Decision-Making
Vanity metrics create a false sense of security.
A rising number of email subscribers can mask a plummeting open rate and a disengaged list. A high website traffic number can hide a decline in conversion rate and a user experience problem.
When leadership sees these "good" numbers, they may wrongly conclude that the current strategy is working, preventing necessary pivots and optimizations. This leads to investing more in failing tactics and ignoring opportunities for genuine growth.
Inability to Prove Marketing ROI
This is the career-killer for marketers.
When the CFO asks how marketing contributed to the bottom line last quarter, answering with "We got 2 million impressions and 50,000 likes" is insufficient. Without a clear line connecting marketing activities to sales, leads, and customer value, marketing is perceived as a fluffy, non-essential expense.
This makes it the first budget to be cut during economic downturns and undermines the CMO's seat at the executive table.
Vanity Metrics vs. Actionable Metrics: A Detailed Comparison
The antidote to vanity metrics is actionable metrics. These are the KPIs that are directly linked to your business objectives and provide clear insights for strategic decision-making.
The distinction isn't always black and white. A metric can be vain in one context and actionable in another. The key is its connection to a specific, measurable business goal.
For example, website traffic is a vanity metric for a SaaS company trying to generate demos, but it's an actionable metric for a media company that sells advertising based on page views.
Here’s a detailed breakdown of the differences.
| Aspect | Vanity Metrics | Actionable Metrics |
|---|---|---|
| Definition | Superficial numbers that look good but don't correlate with business success. | Data that ties directly to business goals and helps inform specific actions. |
| Core Purpose | To impress or feel good; often used for surface-level reporting. | To measure progress, diagnose problems, and guide strategic decisions. |
| Typical Examples | Page views, social media followers, total downloads, email subscribers. | Conversion rate, customer acquisition cost (CAC), customer lifetime value (LTV), churn rate. |
| Impact on Decisions | Leads to inaction or poor decisions based on misleading data. ("Likes are up, let's keep doing this.") | Drives specific changes. ("CAC is up 20%, let's analyze channel performance.") |
| Connection to ROI | Weak or nonexistent. It's difficult to prove how they contribute to revenue. | Direct and measurable. Shows a clear link between an activity and its financial impact. |
| Repeatability | Often the result of luck or one-off events (e.g., a viral post). Hard to replicate. | Can be influenced and repeated through systematic, controlled changes. |
| Focus | Measures outputs and volume (the "what"). | Measures outcomes and value (the "so what"). |
| Question It Answers | "How much activity did we generate?" | "How is this activity impacting our business goals?" |
How to Identify Vanity Metrics in Your Own Reporting
Switching from vanity to actionable metrics requires a critical eye on your current dashboards and reports. It's about asking tougher questions of your data. To effectively identify metrics that might be leading you astray, run them through the following filters.
1. Does It Directly Influence a Business Objective?
This is the most crucial test. Take any metric you track and try to connect it to a core business goal like revenue, profitability, or customer retention.
If you have to make several logical leaps to form a connection – more likes might lead to more brand awareness, which could eventually lead to more sales – it’s likely a vanity metric.
An actionable metric has a direct path. For example, 'demo request form submissions' directly impacts the sales pipeline.
2. Can You Make a Specific Decision Based on This Metric?
Imagine the metric suddenly doubles or halves. What specific, concrete action would you take?
If your number of Twitter followers doubles overnight, what do you do differently tomorrow? Probably nothing.
But if your 'cost per qualified lead' doubles, you have an immediate, specific action: investigate your ad campaigns, landing pages, and targeting.
If a metric doesn't prompt a clear "if this, then that" decision, its value is questionable.
3. Is the Metric Measuring a Repeatable Process?
A sudden spike in website traffic because a celebrity tweeted about you is exciting, but it's not a repeatable strategy. You can't build a business on luck.
Actionable metrics measure the outcomes of deliberate, repeatable processes that you control.
For example, the conversion rate of an A/B test on a landing page is actionable because you can control the variables and replicate the winning formula to improve results systematically over time.
Common Vanity Metrics Examples And What to Track Instead
Let's move from theory to practice.
Here are some of the most common vanity metrics across different marketing channels, why they're misleading, and the powerful, actionable alternatives you should be tracking instead.
Website & SEO Metrics
Vanity Metric: Page Views / Hits
Why it's vain: A high number of page views tells you nothing about user engagement or quality. 10,000 views from unqualified traffic that bounces immediately is less valuable than 100 views from your ideal customer profile.
Actionable Alternatives:
- Conversion Rate: The percentage of visitors who complete a desired action (e.g., sign up, purchase). This is the ultimate measure of your website's effectiveness.
- Time on Page / Scroll Depth: Indicates how engaged visitors are with your content. Longer time suggests higher interest.
- New vs. Returning Users: Helps you understand audience loyalty and the effectiveness of your retention efforts.
- Goal Completions (in Google Analytics): Tracking specific actions like form fills, downloads, or video plays.
Vanity Metric: Bounce Rate
Why it's vain: A high bounce rate isn't always bad. A user might land on a blog post, find the exact answer they need, and leave satisfied. In that case, the page did its job perfectly. It lacks the context of user intent.
Actionable Alternatives:
- Exit Rate on Key Pages: Shows where users are dropping out of your conversion funnel (e.g., the checkout page).
- Conversion Rate by Channel: Tells you which traffic sources are delivering the most valuable users.
Vanity Metric: Keyword Rankings
Why it's vain: Ranking #1 for a keyword is useless if that keyword doesn't drive qualified traffic or has no commercial intent. Ranking for "free marketing tools" is very different from ranking for "best enterprise marketing automation software."
Actionable Alternatives:
- Organic Traffic Conversions: How many leads or sales are generated from your SEO efforts?
- Click-Through Rate (CTR) from Search: A high ranking with a low CTR might indicate a problem with your title tag or meta description.
- Branded vs. Non-Branded Search Traffic: Measures brand equity and the effectiveness of your top-of-funnel content strategy.
Social Media Metrics
Vanity Metric: Followers / Fans / Likes
Why it's vain: This is the classic vanity metric. A large follower count can be bought, and it doesn't guarantee engagement or business results. 100,000 disengaged followers are worthless.
Actionable Alternatives:
- Engagement Rate (per post or per follower): (Likes + Comments + Shares) / Followers. This measures how compelling your content is to your actual audience.
- Website Clicks from Social: How much traffic are you actually driving from your social channels to your website?
- Conversions from Social Traffic: Using UTM parameters to track how many of those website visitors from social media actually convert into leads or customers is a core tenet of good social media analytics.
- Share of Voice: How often your brand is mentioned compared to competitors.
Vanity Metric: Reach / Impressions
Why it's vain: This just tells you how many people potentially saw your content, not who they were or if they took any action. It's a measure of delivery, not impact.
Actionable Alternatives:
- Click-Through Rate (CTR): (Clicks / Impressions). Measures how effective your creative and copy are at compelling a user to take the next step.
- Cost Per Conversion: The ultimate measure for paid social campaigns. How much does it cost to generate a lead or a sale?
Email Marketing Metrics
Vanity Metric: Total Subscribers
Why it's vain: A large list of unengaged, inactive subscribers can actually harm your deliverability and increase your email platform costs. List quality trumps list quantity every time.
Actionable Alternatives:
- List Growth Rate: Measures the rate at which you are adding new, active subscribers.
- Open Rate & Click-Through Rate: While still top-of-funnel, these are better indicators of subject line effectiveness and content relevance than subscriber count alone.
- Conversion Rate from Email: How many recipients clicked a link and then completed a desired action on your website?
- Unsubscribe Rate: A high rate can indicate a mismatch between what your audience expects and what you're sending.
Building a Data-Driven Strategy Beyond Vanity Metrics
Moving away from vanity metrics isn't just about choosing different KPIs. It requires a fundamental shift in your team's culture, processes, and technology stack. It's about building a system where data serves strategy, not ego.
1. Start with Business Objectives
Before you even look at a dashboard, define what you are trying to achieve as a business.
Is the goal to increase enterprise sales by 15%? Reduce customer churn by 5%?
Every marketing goal and its corresponding metrics must cascade down from these top-level objectives.
2. Map Your Customer Journey
Understand the path your customers take from awareness to purchase and beyond. By mapping this journey, you can identify the key conversion points and assign meaningful metrics to each stage.
This ensures you're measuring what matters at every step, not just the noisy metrics at the top of the funnel.
3. Implement a Robust Tracking System
Actionable metrics require clean, reliable data. This means having a solid analytics implementation, consistent UTM parameter usage across all campaigns, and proper conversion tracking.
A well-designed marketing data pipeline is the foundation that ensures the data flowing into your reports is accurate and trustworthy, allowing you to move from guessing to knowing.
Improvado supports this shift by providing governed, standardized, and automated data collection across all marketing and revenue platforms, ensuring accuracy before insights ever reach your dashboards. With Improvado, teams can enforce consistent naming conventions, unify conversion tracking across channels, and maintain a single source of truth for performance measurement.
Key capabilities include:
- Automated extraction from over 500 marketing, CRM, and analytics platforms
- Standardized UTM and taxonomy management
- Cross-channel conversion and attribution alignment
- Centralized data validation and anomaly detection
- Unified performance schema for paid, organic, and revenue data
- Full data warehouse integration with governance and lineage
- Self-serve access to trusted data for BI and modeling workflows
This foundation turns reporting into a disciplined process rather than a collection of ad-hoc numbers, ensuring decisions are powered by trustworthy, actionable metrics, not vanity signals.
Overcoming Data Silos: The Root Cause of Vanity Reporting
One of the primary reasons teams fall back on vanity metrics is that actionable data is often difficult to access.
Your ad spend data lives in Facebook Ads and Google Ads, your website behavior is in Google Analytics, your lead information is in a marketing automation platform, and your sales data is locked away in a CRM like Salesforce.
When these systems don't communicate, it's impossible to connect top-of-funnel activity (like an ad click) to a bottom-of-funnel outcome (like a closed-won deal).
This is where unifying your data becomes critical. By centralizing all your marketing and sales data into a single source of truth, such as a data warehouse, you break down these silos. This allows you to build comprehensive reports that trace the entire customer journey and calculate the true ROI of your campaigns, making vanity metrics obsolete.
"Improvado helped us gain full control over our marketing data globally. Previously, we couldn't get reports from different locations on time and in the same format, so it took days to standardize them. Today, we can finally build any report we want in minutes due to the vast number of data connectors and rich granularity provided by Improvado.
Now, we don't have to involve our technical team in the reporting part at all. Improvado saves about 90 hours per week and allows us to focus on data analysis rather than routine data aggregation, normalization, and formatting."

Focusing on What Matters: Aligning Metrics with Business Goals
The ultimate goal is to create a culture that prioritizes business impact over busy-work. This means every team member should understand how their work contributes to the bottom line.
It's about shifting the conversation from "How many likes did we get?" to "How many qualified leads did this campaign generate, and what was the cost per acquisition?"
Prioritize ROI-Driven Metrics
Encourage your team to focus on ROI-driven marketing by consistently reporting on metrics that matter to the C-suite:
- Customer Acquisition Cost (CAC): The total cost of sales and marketing to acquire one new customer.
- Customer Lifetime Value (LTV): The total revenue a business can expect from a single customer account. A healthy business model requires LTV to be significantly higher than CAC.
- Marketing-Sourced Revenue: The amount of revenue that originated from a marketing-generated lead.
- Sales Cycle Length: The time it takes to close a lead. Effective marketing should shorten this cycle.
Implement Better Attribution
Simple "last-click" attribution often gives a skewed view of what's working, over-valuing bottom-funnel channels and ignoring the crucial awareness-building activities at the top. To truly understand performance, you need to explore more sophisticated marketing attribution models like linear, time-decay, or data-driven attribution.
This provides a more holistic view of the customer journey and helps you assign proper credit to all the touchpoints that influenced a conversion, moving you far beyond surface-level vanity metrics.
Visualizing Key Metrics: Creating Dashboards That Drive Decisions
How you present your data is just as important as the data itself. A cluttered dashboard filled with vanity metrics will only create confusion. The goal is to design clean, intuitive reports that tell a clear story and guide the viewer toward a specific conclusion or action.
Effective KPI dashboards should be tailored to their audience. An executive dashboard should focus on high-level, ROI-centric metrics, while a channel manager's dashboard can be more granular, focusing on campaign-level performance metrics that are still actionable.
By visualizing the right data in the right way, you can transform your reporting from a boring, backward-looking exercise into a powerful, forward-looking strategic tool.
Conclusion
Breaking up with vanity metrics is a journey of maturity for any marketing organization. It's about moving past the superficial allure of big, empty numbers and embracing the harder, more rewarding work of measuring true business impact.
By asking tougher questions of your data, aligning your KPIs with overarching business objectives, and leveraging technology to unify your data sources, you can transform your marketing function from a perceived cost center into an undeniable engine of growth.
Improvado provides the data foundation to make this shift possible, standardizing tracking, consolidating fragmented sources, and delivering clean, trustworthy metrics that map directly to revenue and outcomes. With governed data and a unified performance model, your team can focus on decisions that matter, not dashboards that impress.
Ready to replace vanity reporting with insight that drives growth? Request a demo and see how Improvado elevates your analytics.


