
For years, digital analytics revolved around sessions, pageviews, and clicks. These metrics provided a snapshot of website traffic. But they failed to tell the whole story. They treated every visit as an isolated event.
This approach misses the most important element: the person behind the screen. It cannot show you how a user interacts with your brand over weeks, months, or even years.
User-centric analytics changes this paradigm completely. It places the individual user at the core of all measurement and analysis. Instead of counting sessions, it focuses on understanding the entire customer journey. This includes every touchpoint across every device and channel.
By adopting a user-centric model, businesses gain profound data-driven insights into user behavior. This allows them to enhance the user experience, boost retention, and drive sustainable growth.
Key Takeaways:
- User-centric analytics focuses on the complete customer journey, not isolated sessions. This provides a holistic view of user behavior over time.
- This model requires unifying data from multiple sources like your website, app, CRM, and offline channels to create a single user profile.
- Key metrics shift from session-based (like bounce rate) to user-based (like customer lifetime value, retention rate, and user engagement).
- Implementing this strategy involves defining objectives, mapping touchpoints, choosing the right tools, and building a unified data infrastructure.
- Platforms like Google Analytics 4 (GA4) are built on a user-centric model, but true mastery often requires a centralized platform for complete data integration.
The Evolution of Web Analytics: From Hits to Humans
Understanding the value of user-centric analytics requires looking back. The history of web analytics shows a clear progression.
We moved from simple counters to more sophisticated models. Each step brought us closer to understanding the actual user.
The Early Days: Pageviews and Hits
In the beginning, web analytics was about counting "hits". A hit was simply a request to a web server. This included every image, script, and file on a page.
This metric was noisy and not very useful.
Soon, the focus shifted to "pageviews," a more meaningful measure of how many times a page was seen by visitors. This was an improvement, but it still lacked context about the user's visit.
The Rise of Session-Based Analytics (The "Visit" Era)
The concept of a "session" or "visit" was a major leap forward. A session groups a series of user interactions within a given timeframe, typically 30 minutes of inactivity. This model allowed analysts to measure things like session duration, pages per session, and bounce rate.
Tools like Universal Google Analytics perfected this approach.
For over a decade, session-based analytics was the industry standard. It helped businesses understand website performance at an aggregate level.
The Limitations of the Session-Based Model
Despite its long reign, the session-based model has critical flaws in today's multi-device world. Its main problem is that it breaks the customer journey into disconnected pieces.
A user visiting your site on their phone in the morning and their laptop in the evening is counted as two separate sessions. This fragmentation hides valuable insights.
- It ignores cross-device behavior: People use multiple devices. Session-based models can't connect these interactions to a single user.
- It devalues long consideration cycles: For many businesses, a purchase decision takes days or weeks. Session-based analytics fails to connect the initial research visit with the final conversion session.
- It doesn't measure people: Sessions don't buy products; people do. Focusing on session metrics can lead to poor strategic decisions that optimize for visits instead of customer value.
- It struggles with offline data: Integrating offline touchpoints, like a store visit or a call center interaction, is nearly impossible with a session-based framework.
Why the Shift to a User-Centric Model Is Necessary
The modern customer journey is complex and non-linear. To succeed, businesses need a deeper understanding of user behavior.
User-centric analytics provides this depth. It connects the dots across all interactions, creating a cohesive narrative for each user.
This holistic view is no longer a luxury. It's a competitive necessity for personalization, product development, and effective marketing.
User-Centric vs. Session-Based Analytics: A Head-to-Head Comparison
The difference between these two models is fundamental. It impacts everything from data collection to the business decisions you make.
One model looks at isolated visits, while the other examines a person's entire relationship with your brand. This table breaks down the key distinctions.
| Aspect | Session-Based Analytics | User-Centric Analytics |
|---|---|---|
| Core Unit | The "visit" or "session." A group of interactions within a set timeframe. | The "user." A single individual identified across multiple sessions and devices. |
| Timeframe | Short-term and isolated. Typically ends after 30 minutes of inactivity. | Long-term and continuous. Spans the entire customer lifecycle. |
| Key Questions | "How many visits did we get?" "What was the bounce rate?" | "What is the lifetime value of our users?" "Which channels acquire the most loyal customers?" |
| Primary Metrics | Sessions, Pageviews, Bounce Rate, Average Session Duration. | Customer Lifetime Value (LTV), Retention Rate, Churn Rate, User Engagement Score. |
| Technology Focus | Relies heavily on cookies to track individual browser sessions. | Uses advanced identity resolution, User IDs, and unified data platforms. |
| Business Goal | Increasing website traffic and optimizing individual page performance. | Increasing customer loyalty, retention, and overall lifetime value. |
| Marketing Impact | Often leads to last-touch attribution, overvaluing bottom-funnel channels. | Enables sophisticated marketing attribution models that value the entire journey. |
The Core Principles of a User-Centric Analytics Strategy
Adopting user-centric analytics is more than just changing your tools. It's a strategic shift in how you think about data and your customers. This approach is built on several foundational principles.
Principle 1: Focus on the Complete Customer Journey
The primary principle is to map and analyze the entire customer journey. This means tracking interactions from the very first touchpoint to conversion and beyond.
Understanding this complete path is crucial for identifying friction points and opportunities. It requires a long-term view of your relationship with each user. A robust customer journey mapping process is essential for this.
Principle 2: Unify Data Across All Touchpoints
A user-centric view is impossible with siloed data. You must bring together information from every platform a user interacts with.
This includes your website, mobile app, CRM, email platform, advertising networks, and even offline systems. The goal is to create a single, comprehensive user profile that serves as your source of truth.
Principle 3: Prioritize User Experience (UX) Metrics
User-centric analytics is deeply connected to user experience.
Instead of just tracking conversions, it focuses on metrics that indicate user satisfaction and engagement. These key UX metrics might include feature adoption rates, task completion times, and user feedback scores. A better user experience directly leads to higher retention and LTV.
Principle 4: Segment Users Based on Behavior, Not Just Demographics
While demographic data is useful, behavioral data is far more powerful.
User-centric analytics allows you to create dynamic user segments based on their actions.
For example, you can group users who have used a specific feature, viewed certain content, or followed a particular path. This enables highly targeted personalization and communication.
Principle 5: Drive Retention and Lifetime Value (LTV)
The ultimate goal of user-centric analytics is to build a sustainable business. This means moving the focus from short-term acquisition to long-term retention.
By understanding what makes users stick around, you can make product and marketing decisions that increase LTV. This is the true measure of a healthy, growing business.
Key User-Centric Metrics You Need to Track
When you shift to a user-centric model, your key performance indicators (KPIs) also change. Instead of focusing on session volume, you'll start tracking metrics that reflect long-term customer value and health.
Customer Lifetime Value (CLV or LTV)
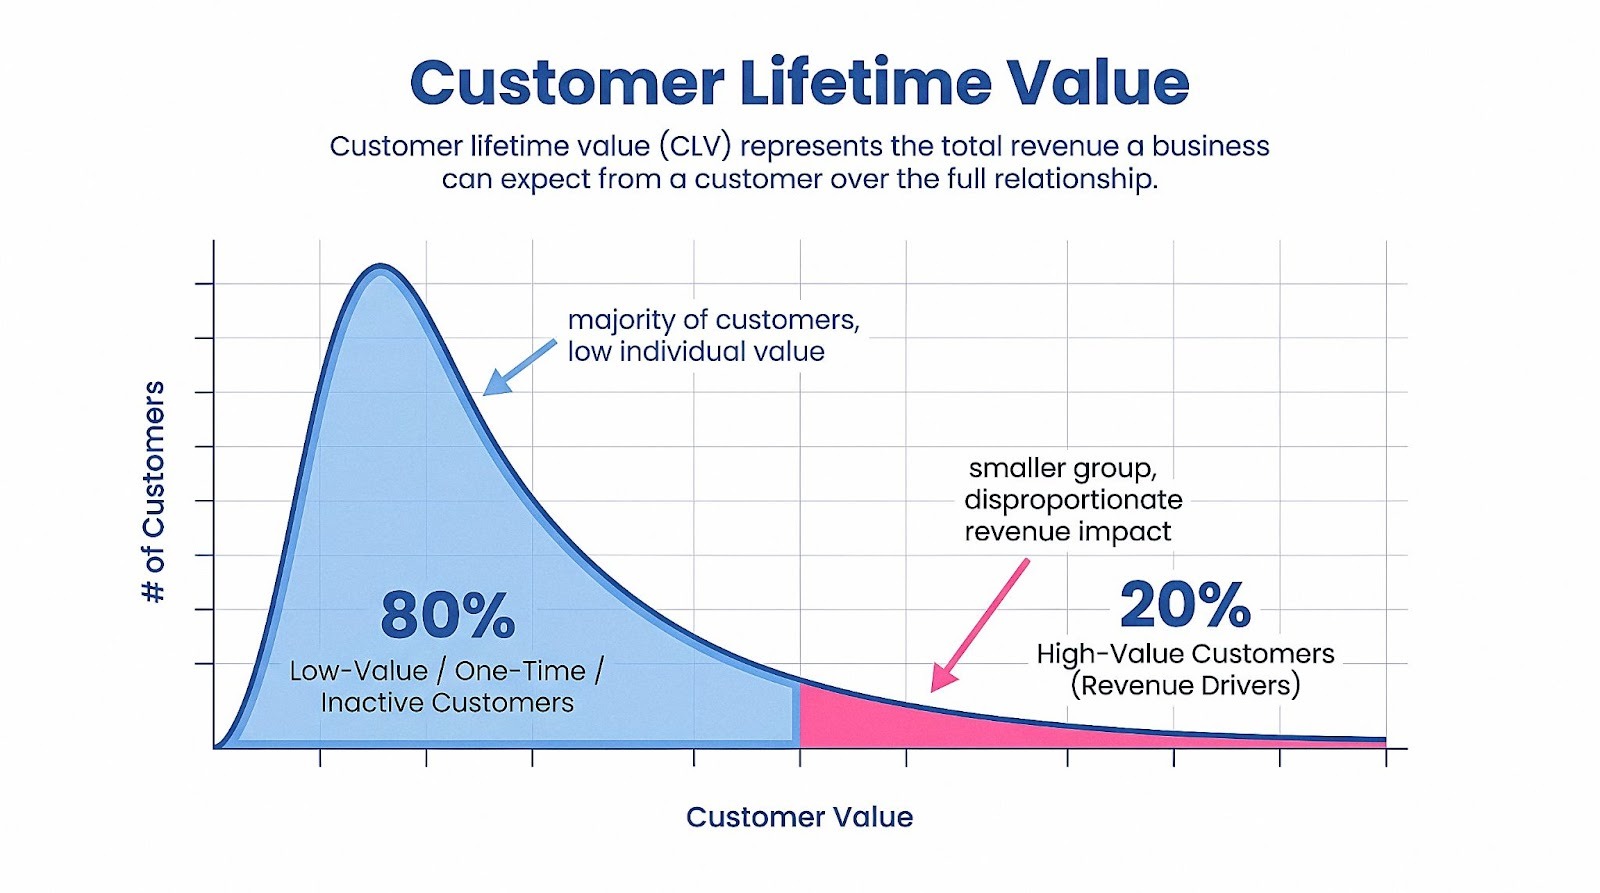
LTV measures total revenue generated by a customer over their relationship with your business.
It should be calculated at the cohort and channel level, not just globally. This reveals which acquisition sources generate durable value versus short-term conversions.
Compare LTV to Customer Acquisition Cost (CAC). The LTV:CAC ratio determines whether growth is sustainable.
Churn Rate and Retention Rate
Retention measures how many users remain active over time. Churn measures the opposite.
Track retention by cohort, channel, and product tier. Early churn often signals onboarding friction. Late churn may indicate pricing or competitive pressure.
In subscription or repeat-purchase models, retention directly drives profitability. Small retention gains compound over time.
User Engagement Score
Engagement predicts retention. It should be modeled using weighted behavioral signals tied to product value.
High-intent actions should carry more weight than passive activity. For example, completing setup or activating a core feature matters more than logging in.
Segment users by engagement score to identify expansion opportunities and churn risk.
Conversion Rates by User Segment
Overall conversion rates hide variability. Segment by behavior, acquisition source, and lifecycle stage.
Measure conversion from signup to activation, activation to paid, and paid to expansion.
This reveals which segments progress efficiently through the funnel and where friction occurs.
Time to Value (TTV)
TTV measures the time between first interaction and meaningful value realization.
Define value clearly. It could be first purchase, first campaign launch, or first completed workflow.
Shorter TTV increases retention probability. Track median TTV by acquisition channel and onboarding path.
Feature Adoption Rate
Feature adoption measures product-market alignment at the feature level.
Track adoption alongside retention and revenue impact. A widely adopted feature that correlates with high retention is strategically important.
Low adoption combined with high development cost signals misalignment or positioning issues.
User-centric analytics shifts focus from traffic to lifetime economics.
It answers not just who converts, but who stays, expands, and generates durable value.
How to Implement a User-Centric Analytics Framework
Transitioning to a user-centric framework is a multi-step process. It requires careful planning, the right technology, and a cultural shift within your organization. Follow these steps to build a solid foundation.
Step 1: Define Your Business Objectives and Key Questions
Start with durable business drivers. Retention. Expansion. LTV. CAC efficiency.
Avoid vague goals like “improve engagement.” Define measurable outcomes tied to revenue and margin.
Frame analytical questions around lifecycle performance. Which channels drive long-term value, not just initial conversions? Where does activation break? What behaviors correlate with renewal or repeat purchase?
User-centric analytics must answer decisions, not just describe trends.
Step 2: Identify and Map User Touchpoints
Most organizations underestimate journey complexity. Users interact across paid media, website visits, product usage, sales conversations, and support interactions.
Document every touchpoint that influences conversion or retention. Include system boundaries. Identify where identifiers change or disappear.
This mapping exercise usually reveals fragmented tracking, inconsistent lifecycle definitions, and revenue gaps. Fixing those inconsistencies is foundational.
Step 3: Choose the Right Analytics Tools and Platforms
Before building pipelines, define the logical structure of your data.
Clarify how users relate to accounts. How accounts relate to opportunities. How opportunities relate to revenue.
Define lifecycle stages consistently across marketing, product, and sales. If “activation” means something different in each system, funnel analysis will be unreliable.
A user-centric model requires structured entities, not loosely connected reports.
Step 4: Establish a Unified Data Infrastructure
User-centric analytics depends on consolidated data. That typically requires a cloud warehouse where behavioral, marketing, CRM, and revenue data coexist.
Raw ingestion is not enough. Data must be standardized.
Campaign naming must be aligned. Currency must be normalized. Timezones must be consistent. Revenue recognition logic must be defined.
Transformation is where user-centric analytics becomes trustworthy. Without it, cross-channel comparisons are misleading.
Step 5: Implement Tracking and User Identification
Identity is the backbone of the framework.
For logged-in users, persistent User IDs are critical. For anonymous traffic, device identifiers and UTMs must be captured consistently.
The challenge is reconciliation. When an anonymous visitor becomes known, their prior interactions must be stitched correctly.
Identity logic should be deterministic where possible and documented. Duplicate or fragmented user records distort retention, LTV, and attribution.
Step 6: Establish Governance and Ownership
User-centric analytics fails without metric governance.
Define calculation logic centrally. Document it. Align stakeholders around shared definitions.
Retention windows. Churn criteria. LTV formulas. Attribution models.
Assign owners for each lifecycle KPI. Analytics must drive action.
Step 7: Operationalize the Framework
The final step is behavioral, not technical.
Embed lifecycle reporting into weekly reviews. Monitor activation velocity. Track retention cohorts monthly. Tie channel spend to downstream revenue, not just top-of-funnel metrics.
User-centric analytics becomes valuable when it changes decisions.
When implemented correctly, this framework replaces fragmented campaign reporting with structured lifecycle intelligence. It shifts focus from acquisition volume to sustainable growth and long-term value creation.
Overcoming the Challenges of User-Centric Data Unification
A unified user view is strategic. It is also technically demanding.
User data is fragmented across advertising platforms, web analytics tools, CRMs, billing systems, and offline channels. Each system uses different identifiers, schemas, and attribution logic. Without structured integration, the “unified view” becomes unreliable.
The Cross-Device Identity Puzzle
Users rarely interact from a single device. They may click an ad on mobile, research on desktop, and convert later from a different browser.
Deterministic matching — using login IDs or email addresses — is the most accurate method. But it works only after authentication.
Probabilistic matching fills the gaps. It relies on behavioral signals and device fingerprints. However, it introduces margin of error and governance risk.
A structured data foundation must support identity stitching at the data model level.
Improvado supports identity and entity mapping across systems. It aligns user IDs, campaign identifiers, and account records before data reaches BI tools. This reduces duplication and attribution distortion across devices and sessions.
Bridging Online and Offline Data
Offline interactions often drive revenue but remain disconnected from digital attribution. Retail purchases, call center interactions, in-person demos, and partner sales frequently sit outside marketing analytics.
To unify this data, you need a common key. Customer ID, hashed email, CRM contact ID, or account-level identifiers.
Data must be normalized before joining. Timestamp alignment, currency conversion, and lifecycle stage mapping are critical.
Improvado centralizes both online and offline datasets into a warehouse-ready schema. It standardizes revenue fields and lifecycle definitions, enabling accurate funnel tracking from first touch to closed revenue.
"Improvado helped us gain full control over our marketing data globally. Previously, we couldn't get reports from different locations on time and in the same format, so it took days to standardize them. Today, we can finally build any report we want in minutes due to the vast number of data connectors and rich granularity provided by Improvado.
Now, we don't have to involve our technical team in the reporting part at all. Improvado saves about 90 hours per week and allows us to focus on data analysis rather than routine data aggregation, normalization, and formatting."

Ensuring Data Privacy and Compliance
User-centric analytics increases exposure to compliance risk. You are working with identifiable data.
Regulations such as GDPR and CCPA require transparency, access controls, and deletion workflows.
Your infrastructure must support:
- Role-based access control
- Audit logs
- Data minimization principles
- Governance of metric definitions
The Technical Hurdles of Data Integration
API instability is common. Data schemas change. Metrics are renamed. Attribution windows differ.
Manual pipelines break frequently under this complexity.
A scalable integration strategy requires:
- Automated API ingestion with monitoring
- Schema normalization across platforms
- Consistent metric definitions
- Controlled transformation logic
Improvado automates extraction from 1,000+ marketing, CRM, and analytics platforms. It standardizes schemas, enforces naming conventions, and loads structured data into a central warehouse.
This shifts the burden away from manual data wrangling and toward lifecycle analysis and optimization.
User-centric analytics fails when data unification is treated as a reporting task. It succeeds when data integration, identity resolution, and governance are designed as part of the architecture.
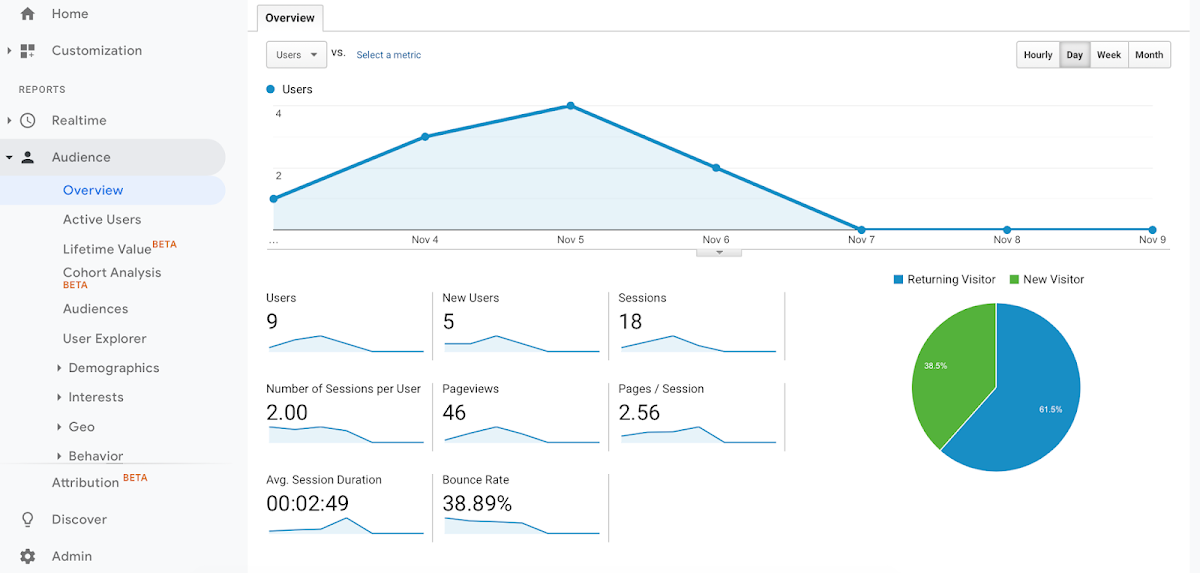
The Role of Google Analytics 4 (GA4) in User-Centric Measurement
Google Analytics 4 represents a fundamental shift from its predecessor, Universal Analytics. GA4 was built from the ground up with a user-centric and event-based model, making it a key tool in any modern analytics stack.
GA4's Event-Based Data Model Explained
Unlike Universal Analytics, which was built around sessions and pageviews, everything in GA4 is an event. A pageview is an event, a button click is an event, and a purchase is an event.
This flexible model allows you to track any user interaction that is important to your business. It provides a much richer dataset for understanding user behavior.
Understanding Users, Not Just Sessions
GA4 automatically uses multiple identity spaces to create a more accurate user count. It uses User ID (if you provide it), Google Signals (for signed-in Google users), and device ID.
By combining these, GA4 does a better job of de-duplicating users across devices and platforms than its predecessor. The focus is clearly on the user lifecycle.
Key GA4 Reports for User-Centric Analysis
GA4's interface is designed around the user journey. The "Explore" section offers powerful tools for deep analysis:
- User explorer: Lets you drill down into the event stream of individual anonymous users.
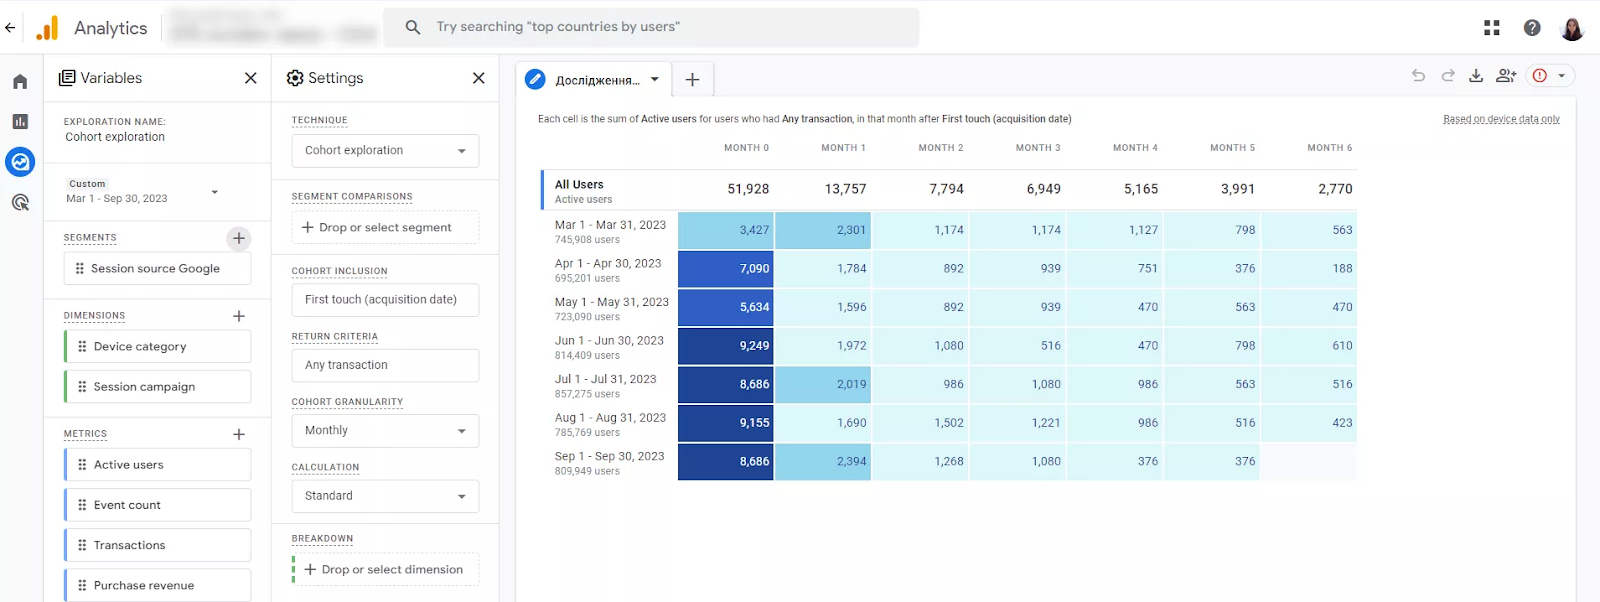
- Cohort exploration: Allows you to group users based on common attributes (like acquisition date) and track their behavior over time.
- Path exploration: Helps you visualize the common paths users take through your website or app.
Limitations of GA4 and When to Look Beyond It
While GA4 is a major step forward, it has limitations. Its primary focus is on on-site and in-app behavior. Integrating data from other sources like your CRM, advertising platforms, or offline systems is still challenging within the GA4 interface.
To get a truly complete user view, you need to export GA4 data to a data warehouse and combine it with your other data sources. This is where a centralized analytics platform becomes essential.
Advanced User-Centric Analysis Techniques
Once user-level data is unified and governed, analytics moves from descriptive to diagnostic and predictive.
The focus shifts from “what happened” to “what drives value” and “what will happen next.”
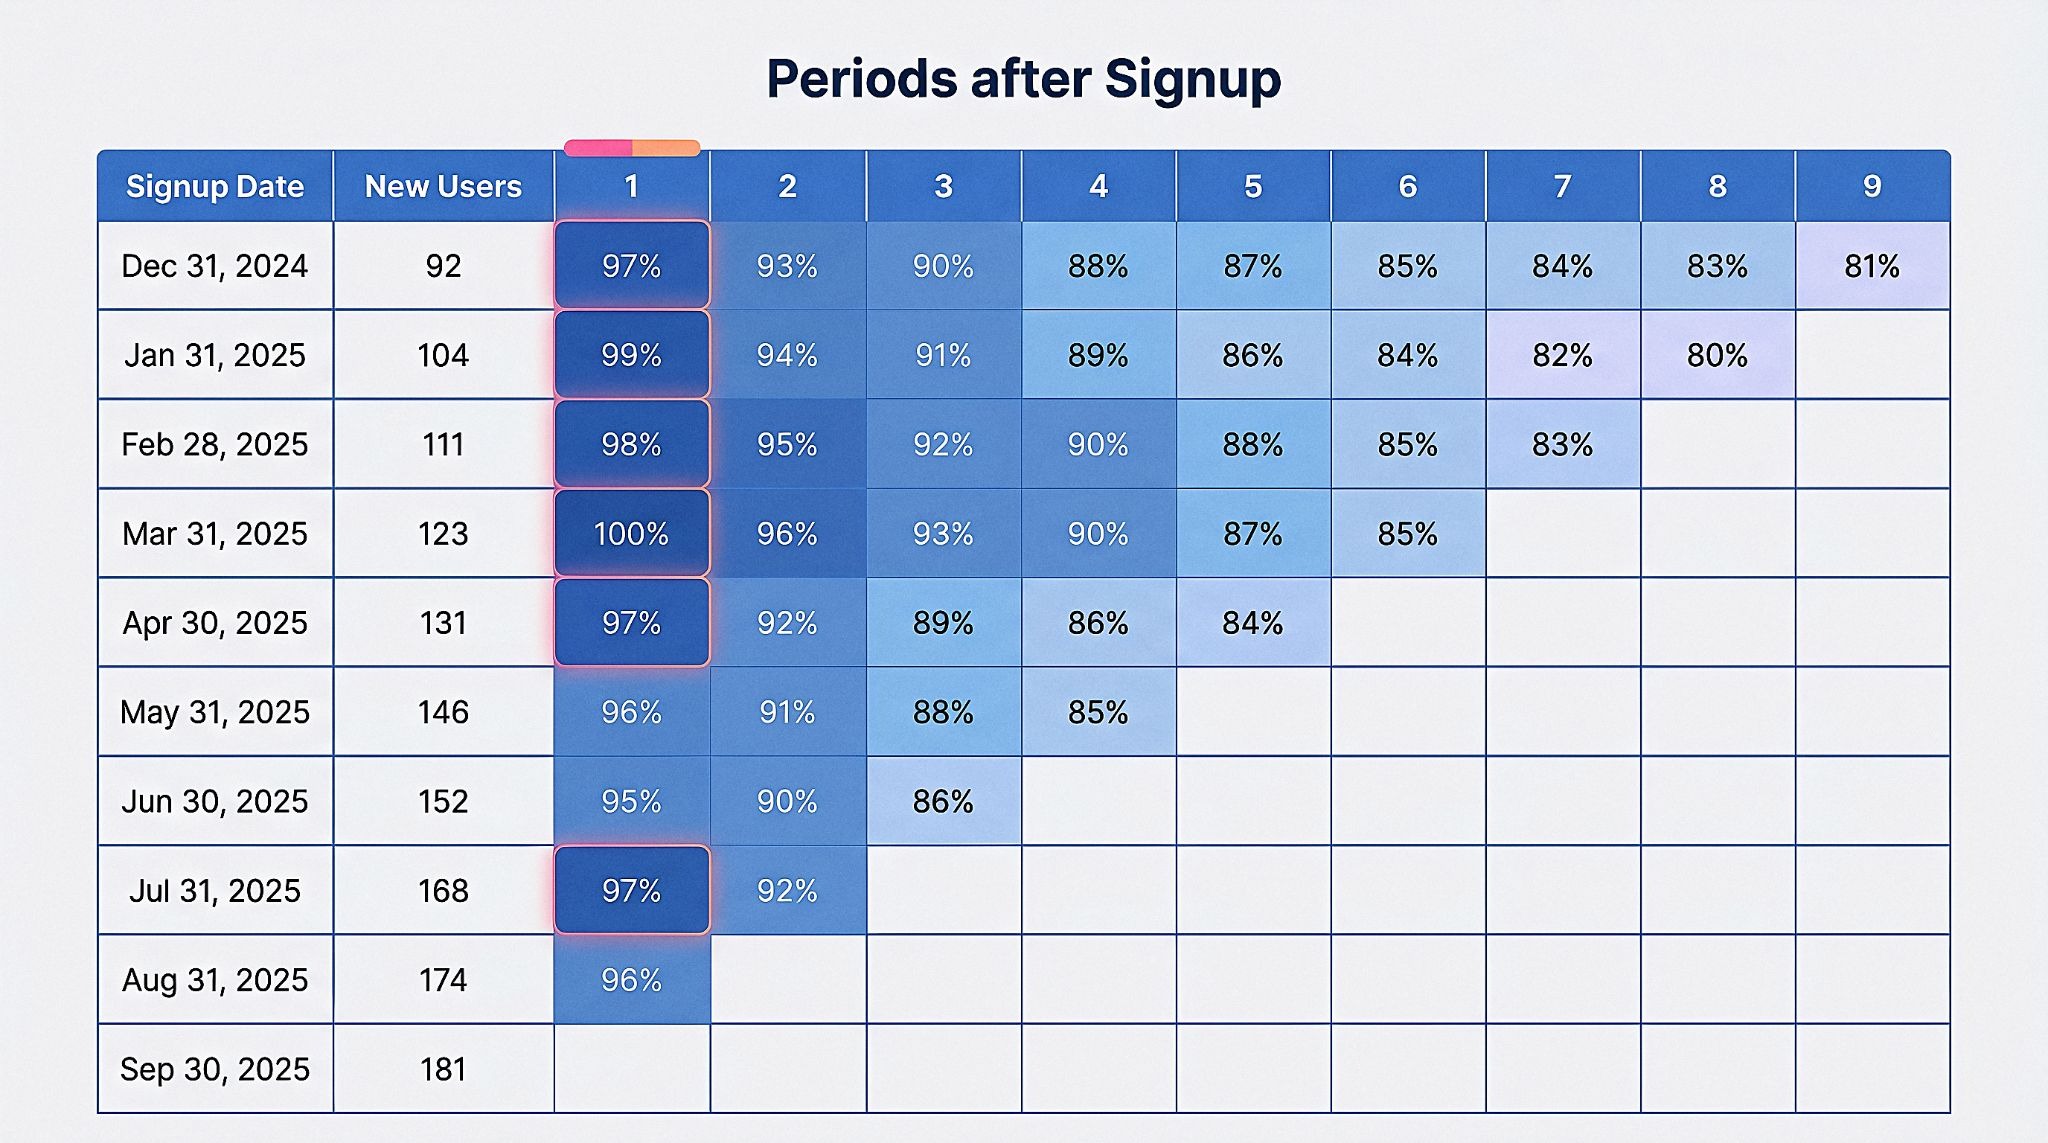
Cohort Analysis: Tracking User Groups Over Time

Cohort analysis isolates users based on a shared starting point. Most commonly acquisition date. But mature teams also cohort by channel, campaign, feature adoption, pricing tier, or geography.
Track retention curves, repeat purchase behavior, expansion revenue, and churn velocity across cohorts.
The objective is not just retention rate. It is retention quality. Do cohorts from paid search generate higher 12-month LTV than paid social? Do onboarding experiments improve activation for new cohorts?
When data is centralized in a warehouse, cohort definitions can incorporate CRM lifecycle stages and revenue, not just sessions or events.
Funnel Analysis: Identifying Structural Friction
Traditional funnel reports are session-based. A user-centric model reconstructs funnels at the user or account level across multiple sessions and devices.
This distinction matters. High-intent users often require multiple interactions before converting.
Advanced funnel analysis includes:
- Time between funnel steps
- Channel influence at each stage
- Funnel velocity across cohorts
- Stage-to-stage conversion segmented by acquisition source
Linking marketing touchpoints to CRM progression (MQL → SQL → Opportunity → Closed Won) transforms funnel analysis into pipeline intelligence.
Path Analysis: Understanding Behavioral Sequences
Path analysis reveals behavioral sequences before and after key events.
Which actions precede activation? Which behaviors correlate with churn? Which feature combinations predict expansion?
Advanced path analysis includes probability modeling. Instead of visualizing only the most common paths, it quantifies transition likelihood between events.
This helps identify high-value behavioral patterns that can be operationalized in onboarding flows or lifecycle campaigns.
Predictive Analytics: Modeling Future Outcomes
With structured historical data, predictive modeling becomes feasible.
Examples include:
- Churn propensity scoring
- LTV prediction at acquisition
- Conversion probability by segment
- Pipeline close probability
Built-in predictive audiences in tools like GA4 provide directional insights. However, advanced modeling requires centralized, clean datasets that incorporate marketing, behavioral, and revenue data.
When unified data is stored in a warehouse and governed properly, machine learning models can be trained on full-funnel signals rather than isolated channel metrics.
The advantage of a unified architecture is not visualization. It is model reliability.
Advanced user-centric analytics connects behavioral signals to revenue outcomes. That is what enables optimization beyond surface-level conversion rates.
Leveraging User-Centric Insights Across Your Organization
The value of user-centric analytics is realized when its insights are used to make better decisions across the entire company. It's not just a tool for analysts; it's a strategic asset for everyone.
For Product Teams: Informing the Roadmap and Feature Development
Product teams can use user-centric data to understand which features drive engagement and retention. They can identify user pain points by analyzing drop-offs in funnels.
This data-driven approach helps them prioritize the product roadmap and build features that users actually want and need, leading to a better overall product.
For Marketing Teams: Personalizing Campaigns and Optimizing Spend
Marketing teams can move beyond channel-level performance.
They can analyze which channels acquire the most valuable users based on LTV, not just initial conversion. These insights allow for smarter budget allocation and the development of personalized campaigns tailored to different user segments.
This directly improves your marketing ROI.
For Sales Teams: Identifying High-Value Leads
By analyzing the behavior of users who eventually become high-value customers, sales teams can build a lead scoring model.
This model can identify product-qualified leads (PQLs) who are showing strong buying signals. This allows the sales team to focus their efforts on the leads most likely to close.
For Customer Success: Proactively Reducing Churn
Customer success teams can use behavioral data to identify users who are at risk of churning.
For example, a drop in engagement or failure to adopt key features can be an early warning sign. This allows the team to reach out proactively with support or training, helping to retain the customer.
Selecting the Best User-Centric Analytics Tools
The market for analytics tools is vast. Choosing the right stack depends on your business model, technical resources, and goals.
Here’s a comparison of the main categories of tools that enable a user-centric approach.
| Tool Category | Primary Use Case | Data Unification | Ideal For |
|---|---|---|---|
| Web/App Analytics (e.g., GA4) | Tracking on-site and in-app user behavior, acquisition channels. | Limited. Primarily focuses on its own data ecosystem. | All businesses as a foundational layer for digital behavior tracking. |
| Product Analytics (e.g., Mixpanel) | Deep analysis of in-product user behavior, funnels, retention, and cohorts. | Good for product data, but limited integration with marketing/sales data. | SaaS, mobile apps, and any business with a complex digital product. |
| Customer Data Platform (CDP) | Collecting and unifying customer data to create persistent profiles for marketing activation. | Excellent. Designed specifically for unifying data from multiple sources. | Marketing teams focused on personalization and multi-channel campaigns. |
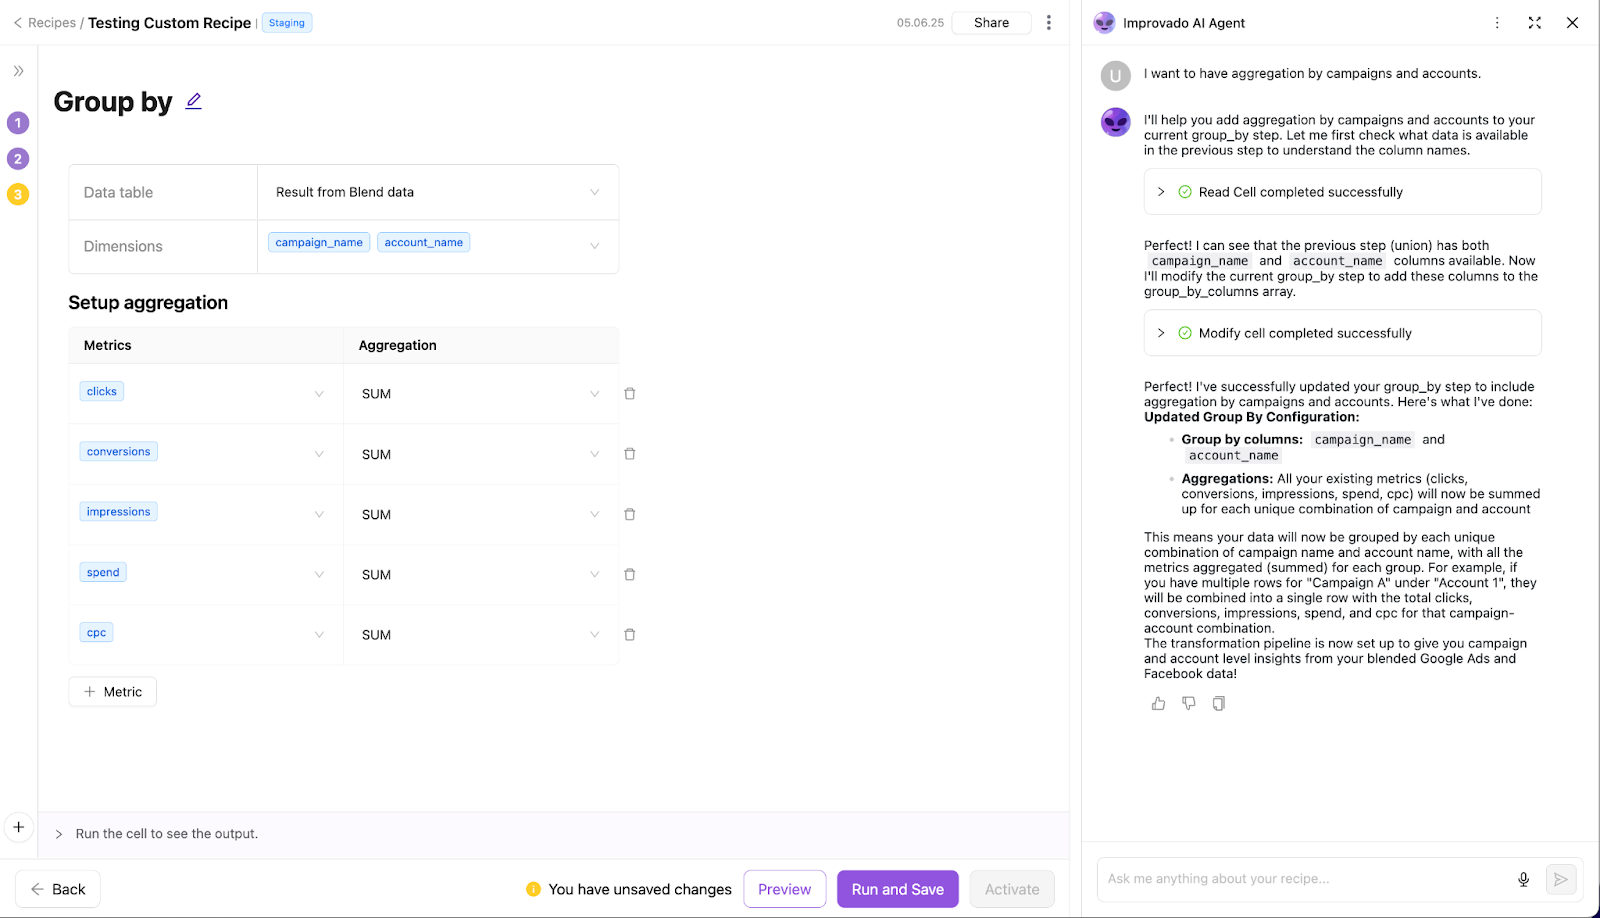
| Centralized Analytics Platform (e.g., Improvado) | Automating data integration from all sources into a data warehouse for holistic analysis. | Best-in-class. Connects marketing, sales, product, and finance data. | Data-mature organizations needing a single source of truth for all business analytics. |
For most businesses, the ideal solution involves using a combination of these tools. However, the key to a truly successful user-centric strategy is having a single source of truth.
A single source of truth is where a centralized marketing analytics platform like Improvado provides immense value. It acts as the data plumbing that connects all your disparate tools, automates the data collection and normalization process, and feeds a clean, unified dataset into your data warehouse and BI tools.
This allows your team to focus on analysis and insight generation, not data wrangling.
The Future of Analytics: AI and Person-Based Insights
The field of analytics is constantly evolving. The shift to user-centric is a major step, but the future holds even more advanced capabilities. Two key trends are shaping what's next: Artificial Intelligence and the move toward person-based analytics.
How AI is Enhancing User Behavior Analysis
AI and machine learning are transforming analytics. Instead of just describing what happened, AI can help predict what will happen next. It can automatically detect anomalies in your data, surface hidden insights that a human analyst might miss, and power predictive models for churn and LTV.
AI-driven tools make sophisticated analysis more accessible to a broader range of users.
The Shift from User-Centric to Person-Based Analytics
Person-based analytics is the next evolution. While user-centric analytics aims to create a single profile for each user, person-based analytics achieves this with a higher degree of accuracy by relying on verified personal data (like an email address) rather than cookies.
This approach is more resilient to cross-device challenges and provides a more stable foundation for understanding the customer. It is the gold standard for creating a true 360-degree customer view.
Preparing Your Strategy for a Cookieless Future
The impending deprecation of third-party cookies is accelerating the shift away from session-based models. Businesses that rely on these cookies for tracking and advertising will face significant challenges.
A user-centric strategy, which prioritizes first-party data and authenticated user IDs, is far more resilient. Building direct relationships with your customers and encouraging them to log in will be critical for success in the cookieless era.
Conclusion
The transition from session-based to user-centric analytics is not just a technical upgrade; it's a fundamental shift in business strategy. It's about recognizing that behind every data point is a person with unique needs and a complex journey. By placing the user at the heart of your measurement, you unlock a deeper level of understanding that drives smarter product development, more effective marketing, and lasting customer relationships.
This journey requires a commitment to breaking down data silos, investing in the right technology, and fostering a data-driven culture. While the path has its challenges, the rewards are immense. Businesses that master user-centric analytics will gain a significant competitive advantage, building products that customers love and a business that is built to last. The time to move beyond sessions and start understanding your users is now.
Related reading: Snowflake Analytics Guide for Marketing Teams | 2026, Tableau Analytics Guide for Marketing Teams (2026), Twitter Analytics Guide 2026: Track & Optimize X Performance, WooCommerce Analytics Guide 2026 | Track & Optimize Sales, Zoho CRM Analytics Guide for Data Analysts (2026)


