.png)
Your customer's journey is not a straight line. It is a complex web of interactions. They might see your ad on a phone, research on a tablet, and buy on a desktop. Without connecting these dots, you only see fragments of the story. Your data becomes siloed, leading to wasted ad spend and missed opportunities.
Cross-device analytics solves this fragmentation. It stitches together user interactions from every device and platform. This creates a single, unified view of each customer. You can finally understand the complete path to conversion. This guide provides a comprehensive roadmap to mastering cross-device analytics for transformative marketing results.
Key Takeaways:
- Definition: Cross-device analytics unifies user data from multiple devices (desktop, mobile, tablet) to create a single, person-centric view of the customer journey.
- Importance: It provides accurate user counts, enables true personalization, improves ad targeting, and reveals the full impact of your marketing efforts on conversions.
- Core methods: Tracking relies on two main approaches–deterministic (using logged-in data for high accuracy) and probabilistic (using algorithms to infer connections).
- Impact on ROI: By understanding the complete customer path, you can optimize spend, improve attribution, and significantly increase your marketing return on investment.
What Is Cross-Device Analytics?
Cross-device analytics is the process of collecting, measuring, and analyzing user behavior across multiple devices. The goal is to understand how one individual interacts with your brand, regardless of the device they use.
Cross-device analytics shifts the focus from device-centric data to person-centric insights. This approach provides a holistic view of the customer journey.
When you understand the full context of a user's interactions, you can deliver more relevant messages. You can avoid showing ads for a product they already bought. You can tailor website content based on their previous research. This deeper understanding builds stronger customer relationships and drives growth.
The Critical Importance of Cross-Device Analytics
Cross-device analytics is fundamental to accurate measurement and effective marketing strategy. Businesses that master this capability gain a significant competitive advantage.
Achieving Accurate User Counts and De-duplication
Most marketing platforms report users at the device or browser level. This inflates audience size and undercounts true frequency and conversion rates. Cross-device identity resolution de-duplicates users across sessions, devices, and platforms.
Accurate user counts directly impact core metrics:
- Conversion rate calculations
- Customer acquisition cost (CAC)
- Lifetime value (LTV)
- Funnel drop-off analysis
Without de-duplication, these metrics are systematically skewed. Strategy built on flawed baselines leads to wasted spend and incorrect optimization decisions.
Mapping the Complete Customer Journey
Cross-device analytics exposes how channels and devices interact across the funnel. It reveals whether mobile ads drive later desktop conversions. It shows how email engagement influences in-app purchases. It identifies device handoffs during consideration.
This level of visibility enables:
- Precise multi-touch attribution
- Better funnel design
- Friction identification across devices
Teams can optimize journeys based on real behavior, not assumed paths.
Enhancing Personalization and Customer Experience
Unified user profiles allow consistent experiences across devices. Behavioral signals from one device inform messaging on another. Cart abandonment on mobile can trigger personalized follow-ups on desktop. Prior content engagement can shape landing page experiences.
Improving Ad Targeting and Reducing Wasted Spend
Cross-device identity mapping strengthens audience targeting. Marketers can retarget users across devices, not just within a single platform. Frequency capping can be enforced at the user level instead of the device level. Converted users can be suppressed immediately across all devices.
The impact is measurable:
- Lower wasted impressions
- Higher retargeting efficiency
- More accurate reach and frequency control
- Better ROAS and CPA performance
In a multi-device world, cross-device analytics is not an advanced capability. It is a baseline requirement for accurate measurement and efficient marketing execution.
How Cross-Device Analytics Works: The Core Mechanisms
The magic of cross-device analytics lies in its ability to connect anonymous data points into a cohesive user profile. This is a complex technical process that relies on various identifiers and data stitching techniques.
The Role of Identifiers: Stitching User Data Together
Identifiers are the pieces of information used to link devices to a single person. These can range from a logged-in user ID to an anonymous cookie or device ID. The quality and persistence of these identifiers determine the accuracy of the cross-device matching.
Common identifiers include:
- User ID: A unique ID assigned when a user logs into your website or app.
- Email address: Often hashed for privacy, used to connect activity across platforms.
- Device ID: A unique identifier for a mobile device (e.g., Apple's IDFA or Android's GAID).
- First-party cookies: Set by your own domain to recognize returning browsers.
Data Collection Across Touchpoints
A reliable cross-device view starts with comprehensive data collection. User interactions must be captured across websites, mobile apps, ad platforms, CRM systems, analytics tools, and transaction databases. Each system records events differently, uses its own identifiers, and stores data in unique schemas. Without automation, aligning these inputs becomes slow and error-prone.
Improvado simplifies this step by aggregating data from hundreds of marketing, analytics, and revenue platforms into a centralized environment. It automates API connections, handles schema differences, and standardizes event structures as data is ingested.
Identifiers such as user IDs, emails, cookies, and device IDs are normalized at the point of entry. This ensures downstream identity resolution is built on consistent, high-quality inputs rather than fragmented raw data.
The result is continuous, structured data flow from every touchpoint. No manual exports. No broken pipelines. No inconsistent event definitions.
ASUS needed a centralized platform to consolidate global marketing data and deliver comprehensive dashboards and reports for stakeholders.
Improvado, an enterprise-grade marketing analytics platform, seamlessly integrated all of ASUS’s marketing data into a managed BigQuery instance. With a reliable data pipeline in place, ASUS achieved seamless data flow between deployed and in-house solutions, streamlining operational efficiency and the development of marketing strategies.
"Improvado helped us gain full control over our marketing data globally. Previously, we couldn't get reports from different locations on time and in the same format, so it took days to standardize them. Today, we can finally build any report we want in minutes due to the vast number of data connectors and rich granularity provided by Improvado.
Improvado saves us about 90 hours per week and allows us to focus on data analysis rather than routine data aggregation, normalization, and formatting."

The Process of Unifying User Profiles
Once data is collected, identity resolution connects interactions across devices into a single user entity. This requires mapping identifiers from different systems, aligning timestamps, and reconciling conflicting records. Without transformation and governance, identity stitching produces unreliable or incomplete user profiles.
Improvado supports this process through automated data transformation and entity mapping. It applies consistent logic to match identifiers across platforms, normalizes user-level events, and maintains persistent user records inside the data warehouse. As new data arrives, mappings are refreshed and validated to prevent drift or duplication.
This produces continuously updated, analytics-ready user profiles. Teams can then run cross-device attribution, personalization, and journey analysis on stable, governed datasets. The focus shifts from building identity infrastructure to using identity insights for better marketing decisions.
Core Methods of Cross-Device Tracking: A Detailed Comparison
There are two primary methods for linking user activity across devices: deterministic and probabilistic. Each has its own strengths and weaknesses. Many modern solutions now use a hybrid approach to maximize both accuracy and scale.
Deterministic Tracking: The Gold Standard of Accuracy
Deterministic tracking relies on known, persistent identifiers to make a direct match. This typically involves a user logging in with an email address, phone number, or social media account. When a user logs in on their phone and later on their desktop, the system knows with near-100% certainty that it is the same person.
This method is highly accurate but is limited to your known, authenticated user base.
Probabilistic Tracking: Using Data Science to Make Connections
Probabilistic tracking uses algorithms and statistical modeling to infer connections between devices. It analyzes thousands of anonymous data points. These can include IP address, device type, browser version, screen resolution, and location data. The system then calculates the probability that different devices belong to the same user.
This method offers much greater scale but is less accurate than deterministic matching.
Hybrid Models: Combining the Best of Both Worlds
A hybrid model uses deterministic matching as its foundation. It then layers probabilistic methods on top to expand its reach to anonymous users. This creates a comprehensive identity graph. It leverages the accuracy of logged-in data while also providing insights into the behavior of the wider, unknown audience. This is the approach used by many leading platforms.
| Aspect | Deterministic Tracking | Probabilistic Tracking | Hybrid Model |
|---|---|---|---|
| Primary Method | Direct matching via logged-in user data (email, User ID). | Statistical analysis of anonymous data points (IP, device type). | Combines deterministic foundation with probabilistic expansion. |
| Accuracy | Very high (95-100%). Considered the source of truth. | Lower (60-90%). An educated guess based on data patterns. | High, leveraging the accuracy of deterministic matches first. |
| Scale/Reach | Limited to your authenticated user base. | Can reach a much larger, anonymous audience. | Offers the largest possible reach with varying confidence levels. |
| Data Requirements | Requires a robust login system and first-party data. | Relies on large volumes of anonymous device and browser signals. | Requires both authenticated user data and broad anonymous signals. |
| Privacy Impact | Requires clear user consent for data usage. | Can have privacy implications; must be handled carefully. | Must balance user consent with anonymous data processing. |
| Best For | Accurate measurement of known customers, personalization. | Audience expansion, top-of-funnel targeting, trend analysis. | Comprehensive customer journey mapping and attribution. |
Setting Up Cross-Device Analytics in Google Analytics 4 (GA4)
Google Analytics 4 was built with cross-device measurement in mind. It offers more sophisticated ways to unify user journeys compared to its predecessor, Universal Analytics. Setting it up correctly is a key step for many businesses.
The Shift from Universal Analytics to GA4
Universal Analytics was primarily cookie-based. This made cross-device tracking difficult and reliant on complex User-ID implementations.
GA4 uses an event-based data model. It prioritizes a blended approach to user identification, making it inherently better at handling cross-device behavior.
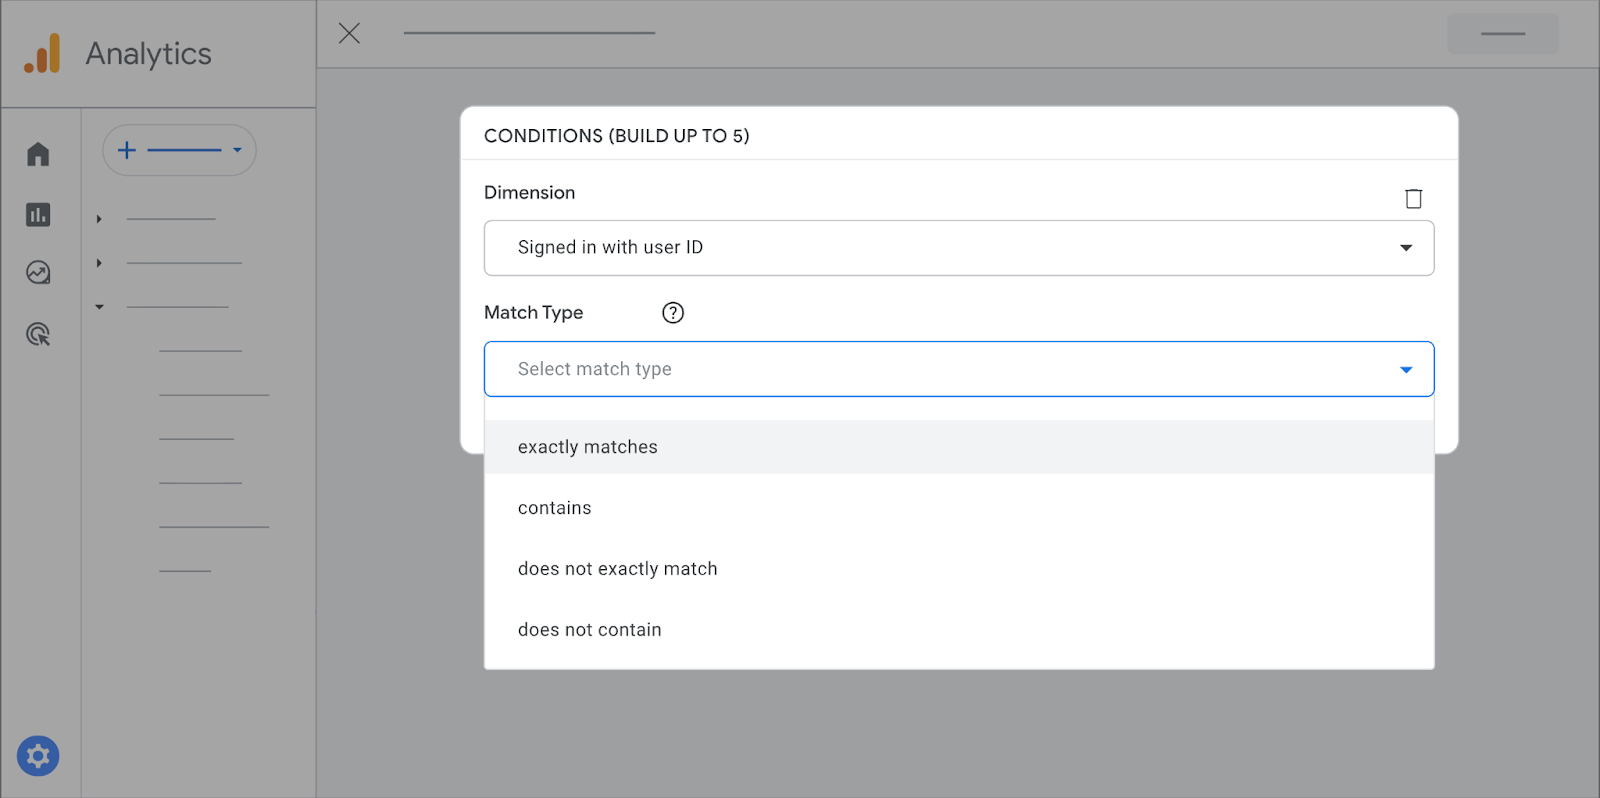
Activating Google Signals: The First Step
Google Signals is a feature that uses aggregated, anonymized data from users signed into their Google accounts who have enabled Ads Personalization. Activating it allows GA4 to de-duplicate users across devices.
This powers cross-device reporting and remarketing without requiring a user to log into your specific site.
- Navigate to your GA4 property's Admin section.
- Under Data Collection and Modification, click on Data Collection.
- Find the Google Signals data collection section and click Get started.
- Follow the prompts to activate the feature.
Remember, data from Google Signals is modeled and subject to thresholds. It is not retroactive, so activate it as soon as possible.
Leveraging User-ID for Logged-in Experiences
For the highest accuracy, you should also implement the User-ID feature. This involves passing a unique, non-personally identifiable ID to GA4 whenever a user logs in.
This creates a deterministic link for all of that user's activity. GA4 will use this User-ID as the primary identifier, overriding Google Signals or device ID for that user.
Understanding GA4's Reporting Identity Hierarchy
GA4 uses a hierarchy to identify users in your reports. It tries to use the most accurate method available for each user:
- User-ID: The most precise method, used for logged-in users.
- Google Signals: Used for users not logged into your site but logged into Google.
- Device ID: The least precise method, based on the browser cookie or app instance ID.
- Modeling: Fills in gaps when data is incomplete due to privacy or technical limitations.
This blended approach allows GA4 to provide a more complete picture of user behavior than any single method alone. It is a core component of effective marketing analytics in the modern era.
Cross-Device Analytics Beyond Google: Exploring Other Platforms
While GA4 is a powerful tool, it's not the only option.
Other platforms, particularly in the enterprise space, offer specialized and robust cross-device capabilities. Understanding the landscape can help you choose the right solution for your needs.
Adobe Analytics and Cross-Device Analytics (CDA)
Adobe Analytics is a leading enterprise analytics solution. Its Cross-Device Analytics (CDA) feature allows organizations to stitch user data across devices.
Adobe CDA primarily uses a "device graph" to make these connections. Organizations can use Adobe's private device graph or integrate with third-party graphs. This provides a flexible and powerful way to unify customer data within the Adobe Experience Cloud ecosystem.
Specialized MarTech Platforms for Identity Resolution
A growing category of MarTech is dedicated to identity resolution. Platforms like CDPs (Customer Data Platforms) are built to solve this problem.
They ingest data from all your sources, unify it into single customer profiles, and then syndicate those profiles to your other marketing tools. Using a Customer Data Platform (CDP) can provide a more robust and flexible foundation for your cross-device strategy.
Improvado and Marketing Data Pipelines
Cross-device analytics requires more than identity stitching. It demands clean, consistent, continuously refreshed data from every marketing and revenue system. This is the foundation Improvado provides.
Improvado centralizes data from advertising platforms, analytics tools, CRM systems, and transaction databases into a single source of truth. It standardizes event structures, aligns identifiers, and applies governance before data reaches reporting or attribution layers. This ensures cross-device insights are built on reliable inputs, not fragmented records.
Key capabilities that support cross-device analytics include:
- Automated ingestion of user- and event-level data across channels
- Normalization of identifiers such as user IDs, emails, cookies, and device IDs
- Entity mapping to connect interactions across devices and platforms
- Data transformation and validation inside the warehouse
- Governed metric and event definitions to keep analysis consistent
- Delivery of analysis-ready datasets to BI tools and AI-powered insights
With this infrastructure in place, teams can accurately map multi-device journeys, run cross-device attribution, and personalize experiences across channels. Instead of fighting data complexity, marketers focus on understanding behavior and improving performance.
| Platform | Primary Method | Key Advantage | Best For |
|---|---|---|---|
| Google Analytics 4 | Hybrid (User-ID, Google Signals, Modeling) | Free, natively integrated with Google Ads, good for most businesses. | SMBs and enterprises heavily invested in the Google ecosystem. |
| Adobe Analytics | Device Graph (Private or 3rd Party) | Deep integration with Adobe Experience Cloud, enterprise-grade features. | Large enterprises using other Adobe products for marketing and sales. |
| Dedicated CDPs | Flexible (Deterministic and Probabilistic) | Vendor-neutral, creates a portable single source of truth for all tools. | Companies with complex data stacks wanting a centralized customer view. |
| Improvado | Data Aggregation and Normalization | Connects all marketing data, cleans it, and sends it to any BI tool. | Marketers who need to unify data without complex engineering. |
Overcoming the Main Challenges of Cross-Device Analytics
Implementing a successful cross-device analytics strategy is not without its hurdles. From navigating privacy regulations to managing technical complexity, there are several key challenges that organizations must address.
Navigating Privacy Regulations (GDPR, CCPA)
Privacy is paramount. Regulations like GDPR in Europe and CCPA in California impose strict rules on how user data can be collected, processed, and linked.
Gaining explicit user consent is a legal requirement for many cross-device tracking activities, especially those involving personal data like email addresses. Your strategy must be built on a foundation of transparency and user control.
The Impact of Third-Party Cookie Deprecation
The marketing world is moving away from third-party cookies. This directly impacts many probabilistic tracking methods that relied on them to connect user activity across different websites.
This shift makes first-party data and deterministic matching more important than ever. Companies must invest in strategies to encourage user logins and collect data directly. A solid cookieless tracking strategy is no longer optional.
Ensuring Data Quality and Accuracy Across Sources
Your cross-device insights are only as good as the data you feed into the system. Inconsistent naming conventions, messy data, and tracking errors can all undermine your efforts. Implementing a process for data normalization and governance is crucial.
This ensures that data from different sources can be accurately combined and analyzed.
Before Booyah Advertising implemented Improvado, their analytics team struggled with frequent data quality issues. Entire days of data were missing, duplicates distorted performance metrics, and aggregation across over 100 clients required extensive manual reconciliation.
After the migration, Booyah achieved 99.9% data accuracy and cut daily budget-pacing updates from hours to 10-30 minutes. Improvado’s unified pipelines, standardization logic, and real-time refresh capability gave the agency full visibility and control over multi-source data (15–20 feeds per client).
“We never have issues with data timing out or not populating in GBQ. We only go into the platform now to handle a backend refresh if naming conventions change or something. That's it.
With Improvado, we now trust the data. If anything is wrong, it’s how someone on the team is viewing it, not the data itself. It’s 99.9% accurate.”

The Technical Complexity of Implementation
Stitching data from dozens of marketing platforms, a CRM, a mobile app, and a website is a significant technical challenge. It often requires dedicated engineering resources to build and maintain data pipelines.
This complexity can be a major barrier for many marketing teams. Solutions that automate data integration can help overcome this hurdle.
Unlocking Actionable Insights with Cross-Device Data
Once you have a unified view of your customers, you can unlock a wealth of actionable insights. This data empowers you to make smarter decisions across your entire marketing function, from funnel optimization to budget allocation.
Optimizing the Customer Journey Funnel
With a clear view of the end-to-end journey, you can identify points of friction. Where do users drop off? Which device transitions are seamless, and which are clunky? You can analyze device paths to see common sequences that lead to conversion.
For example, you might discover that users who start on mobile and finish on desktop convert at a higher rate. This insight allows you to optimize your mobile experience to better facilitate that handoff.
Refining Attribution Models for True Impact
Single-device data often leads to flawed attribution. A last-click model might give all the credit to a desktop brand search, ignoring the mobile social ad that initiated the journey.
Cross-device data allows you to implement more sophisticated attribution models, such as data-driven or position-based models. This gives you a much more accurate understanding of which channels and tactics are truly driving results.
Analyzing User Behavior by Device Combination
You can segment users based on the devices they use.
For example, "Mobile Only," "Desktop Only," and "Mobile + Desktop" users. These segments often exhibit very different behaviors.
Mobile-only users might be more focused on quick, task-oriented interactions. Multi-device users might be more engaged and have a higher lifetime value. Understanding these differences allows you to tailor your messaging and product experience for each group.
Improving Audience Segmentation for Campaigns
Cross-device insights enable powerful audience segmentation. You can create retargeting lists of users who abandoned a cart on any device. You can build lookalike audiences based on your most valuable multi-device customers.
This precision targeting leads to higher engagement rates, lower costs per acquisition, and better overall campaign performance. You can visualize this performance in detailed marketing dashboards.
Measuring Performance and ROI with a Unified View
The purpose of cross-device analytics is not just visibility but accurate performance measurement. When interactions across phones, desktops, tablets, and apps are connected, marketing outcomes can be tied directly to revenue with far greater precision.
Attributing Conversions Accurately Across the Journey
Without cross-device resolution, attribution models favor the last device touched. This hides the impact of earlier interactions. A mobile ad that drives awareness may appear ineffective if the conversion happens later on desktop.
A unified view corrects this. It assigns value to each touchpoint across devices and channels. Top-of-funnel campaigns receive proper credit. Budget decisions become data-driven instead of assumption-based.
Calculating Lifetime Value (LTV) with More Precision
Customer Lifetime Value depends on tracking repeat behavior over time. When users appear as separate identities across devices, LTV is underestimated and segmentation becomes unreliable.
Cross-device user profiles solve this. Every purchase, visit, and engagement is tied to the same individual. Teams can identify high-value segments, understand retention patterns, and invest in acquisition strategies that attract similar customers.
Proving and Maximizing Your Marketing ROI
Accurate attribution and LTV feed directly into ROI measurement. Spend can be mapped to revenue across the entire journey, not just the final click. This provides defensible ROI reporting and clearer insight into channel performance.
With a unified dataset, marketers can demonstrate how campaigns work together, justify budgets with evidence, and continuously reallocate spend toward activities that drive incremental growth.
The Future of Cross-Device Analytics: Trends to Watch
Cross-device analytics is evolving quickly. Privacy regulation, browser restrictions, and changes in identity tracking are reshaping how marketers collect, connect, and activate user data.
The next generation of cross-device analytics will rely less on third-party identifiers and more on controlled, first-party data environments powered by automation and AI.
Server-Side Tracking and First-Party Data Become the Standard
Client-side tracking is losing reliability. Browsers now limit cookies, and ad blockers reduce data capture. In response, more organizations are shifting to server-side data collection. Events are sent directly from owned servers to analytics and data platforms. This improves data completeness, reduces signal loss, and gives companies direct control over data governance.
At the same time, first-party data is becoming the core identity asset. Logged-in user IDs, CRM records, and authenticated sessions provide stable identifiers for deterministic cross-device matching. Companies that invest in first-party data infrastructure will maintain higher identity resolution accuracy as third-party identifiers disappear.
AI-Driven Identity Resolution
As deterministic identifiers become harder to collect at scale, probabilistic matching is growing more sophisticated. Machine learning models can detect behavioral patterns, device usage signals, and interaction sequences that indicate likely user matches across devices.
AI-driven identity resolution increases match rates while maintaining privacy compliance. It allows platforms to connect anonymous interactions with higher confidence and continuously improve matching logic as new data arrives. This will be essential for sustaining cross-device visibility in a privacy-first ecosystem.
Unified Marketing Data Warehouses as the Identity Backbone
More organizations are consolidating marketing, analytics, and revenue data into centralized data warehouses such as BigQuery or Snowflake. These environments act as the system of record for user events, identifiers, and transactions.
With all raw data in one place, companies can run identity mapping, attribution, and cohort modeling directly inside their own controlled infrastructure. This improves transparency, ownership, and flexibility compared to relying on black-box platform identity graphs.
The future of cross-device analytics belongs to teams that control their data, automate identity processes, and apply AI to scale resolution and insight generation.
Conclusion
Implementing a robust cross-device analytics strategy is one of the most impactful steps a marketing team can take to mature measurement. It replaces fragmented assumptions with evidence-based decisions and creates a measurable competitive advantage.
Improvado helps teams operationalize cross-device analytics at scale. It aggregates data from marketing, analytics, CRM, and revenue systems, standardizes identifiers and events, and applies transformation and mapping logic inside the data warehouse.
The result is a unified, governed user dataset ready for attribution, journey analysis, personalization, and performance reporting. Teams spend less time fixing data and more time acting on insights.
If you want to build a reliable cross-device measurement foundation, request a demo of Improvado.
Related reading: User-Centric Analytics: A Guide to Unlocking User Data Insights

